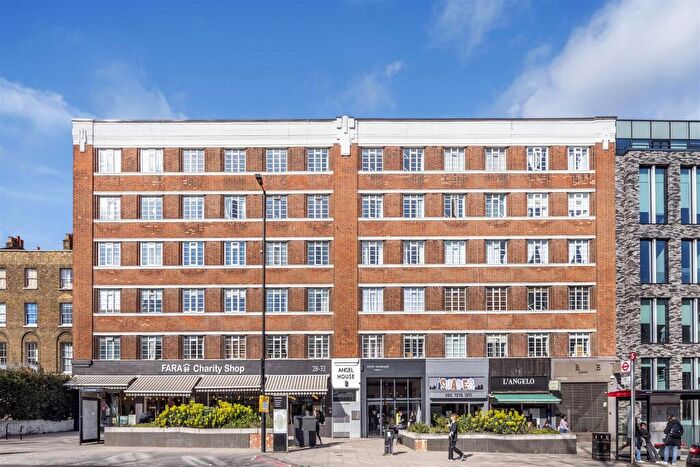
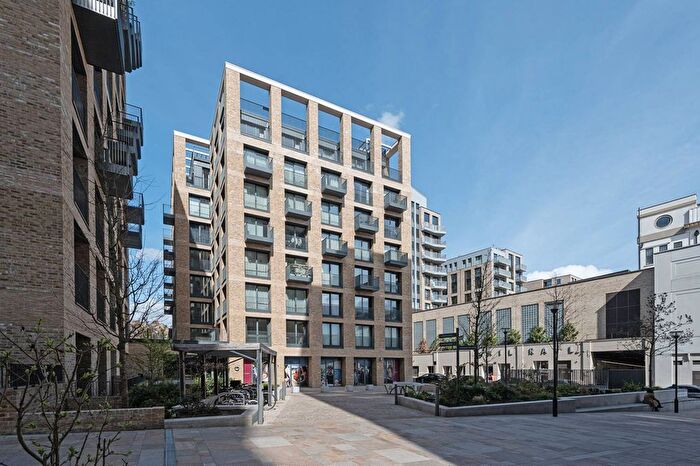
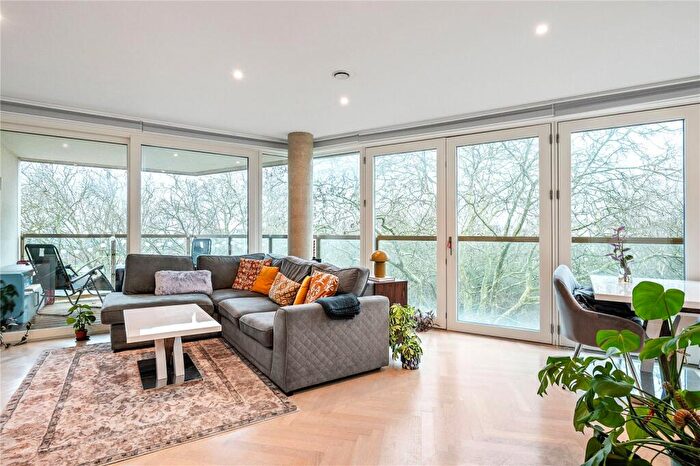
Houses for sale & to rent in Islington London Borough, England
House Prices in Islington London Borough
Properties in Islington London Borough have
an average house price of
£837,527.00
and had 5,815 Property Transactions
within the last 3 years.¹
Islington London Borough is a location in
England with
93,291 households², where the most expensive property was sold for £7,510,000.00.
Properties for sale in Islington London Borough
Towns in Islington London Borough
Navigate through our locations to find the location of your next house in Islington, England for sale or to rent.
Transport in Islington London Borough
Please see below transportation links in this area:
-
Caledonian Road and Barnsbury Station
-
Highbury and Islington Station
-
Essex Road Station
-
Angel Station
-
Caledonian Road Station
-
Drayton Park Station
-
Holloway Road Station
-
Canonbury Station
-
King's Cross Station
-
Kings Cross St. Pancras Station
- FAQ
- Price Paid By Year
- Property Type Price
Frequently asked questions about Islington London Borough
What is the average price for a property for sale in Islington London Borough?
The average price for a property for sale in Islington London Borough is £837,527. This amount is 134% higher than the average price in England. There are more than 10,000 property listings for sale in Islington London Borough.
Which train stations are available in or near Islington London Borough?
Some of the train stations available in or near Islington London Borough are Caledonian Road and Barnsbury, Highbury and Islington and Essex Road.
Which tube stations are available in or near Islington London Borough?
Some of the tube stations available in or near Islington London Borough are Highbury and Islington, Angel and Caledonian Road.
Property Price Paid in Islington London Borough by Year
The average sold property price by year was:
| Year | Average Sold Price | Price Change |
Sold Properties
|
|---|---|---|---|
| 2025 | £791,198 | -8% |
1,535 Properties |
| 2024 | £857,417 | 1% |
2,251 Properties |
| 2023 | £850,509 | -0,4% |
2,029 Properties |
| 2022 | £854,128 | 3% |
2,346 Properties |
| 2021 | £827,609 | 5% |
2,653 Properties |
| 2020 | £787,081 | 6% |
1,999 Properties |
| 2019 | £740,627 | 2% |
2,068 Properties |
| 2018 | £724,633 | -6% |
2,018 Properties |
| 2017 | £770,137 | 3% |
1,806 Properties |
| 2016 | £744,333 | 1% |
2,581 Properties |
| 2015 | £733,564 | 9% |
2,514 Properties |
| 2014 | £664,643 | 13% |
2,974 Properties |
| 2013 | £575,765 | 9% |
3,036 Properties |
| 2012 | £523,430 | 3% |
2,866 Properties |
| 2011 | £506,996 | 5% |
2,619 Properties |
| 2010 | £480,400 | 14% |
2,847 Properties |
| 2009 | £414,749 | -3% |
2,379 Properties |
| 2008 | £427,024 | -2% |
2,324 Properties |
| 2007 | £437,415 | 16% |
3,782 Properties |
| 2006 | £367,084 | 9% |
4,030 Properties |
| 2005 | £333,732 | 4% |
3,065 Properties |
| 2004 | £321,288 | 8% |
2,935 Properties |
| 2003 | £295,300 | 1% |
2,818 Properties |
| 2002 | £292,140 | 11% |
3,404 Properties |
| 2001 | £260,860 | 6% |
3,358 Properties |
| 2000 | £246,155 | 17% |
2,996 Properties |
| 1999 | £204,590 | 17% |
3,800 Properties |
| 1998 | £169,348 | 14% |
3,229 Properties |
| 1997 | £145,349 | 14% |
3,148 Properties |
| 1996 | £124,818 | 4% |
2,432 Properties |
| 1995 | £120,058 | - |
1,772 Properties |
Property Price per Property Type in Islington London Borough
Here you can find historic sold price data in order to help with your property search.
The average Property Paid Price for specific property types in the last three years are:
| Property Type | Average Sold Price | Sold Properties |
|---|---|---|
| Semi Detached House | £2,106,060.00 | 106 Semi Detached Houses |
| Terraced House | £1,506,211.00 | 1,110 Terraced Houses |
| Detached House | £2,405,028.00 | 22 Detached Houses |
| Flat | £638,447.00 | 4,577 Flats |

