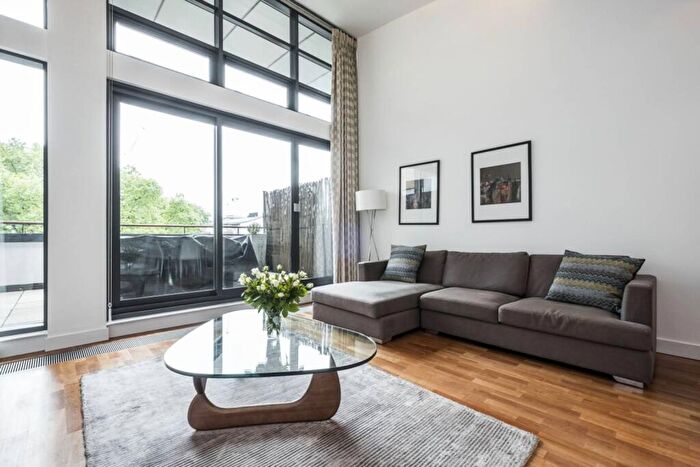
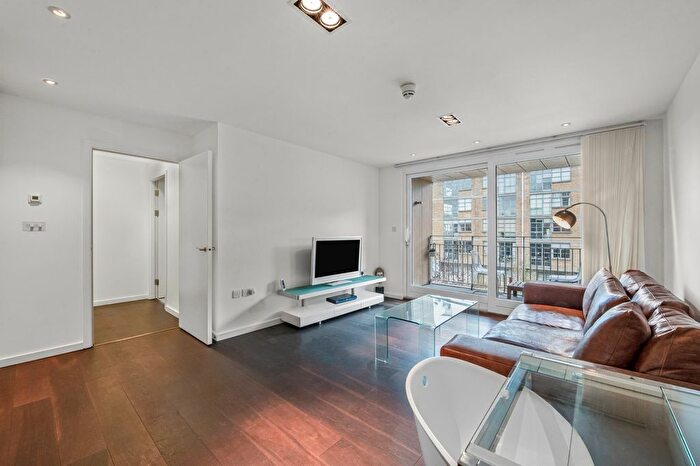
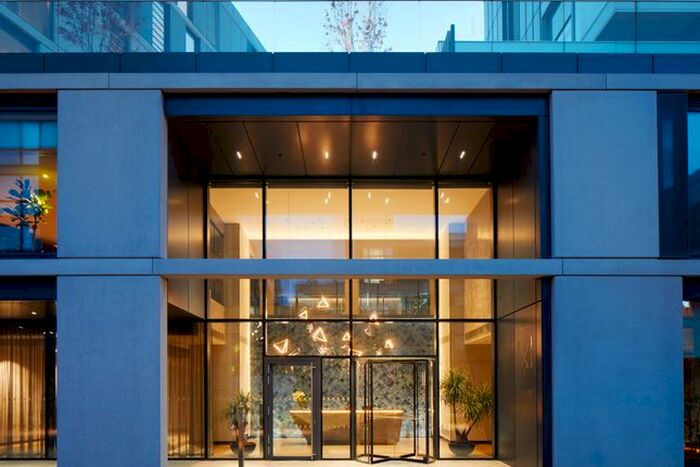
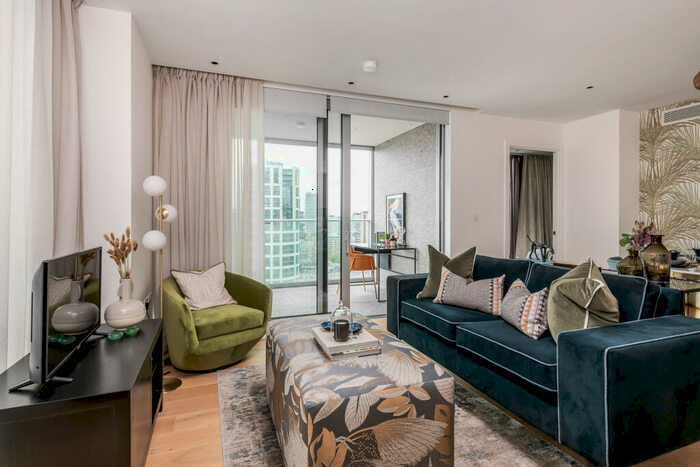
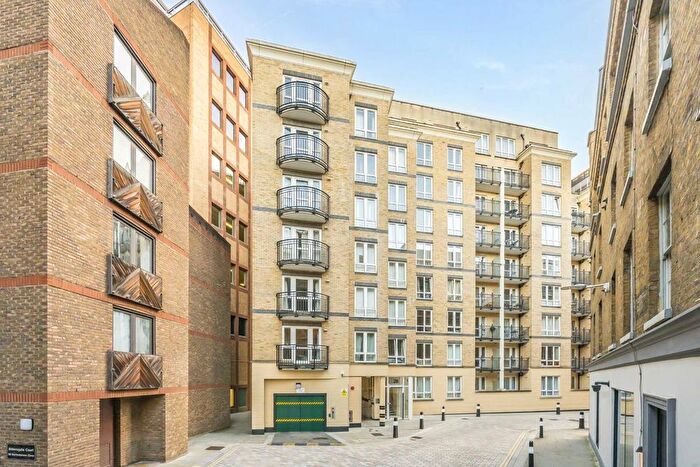
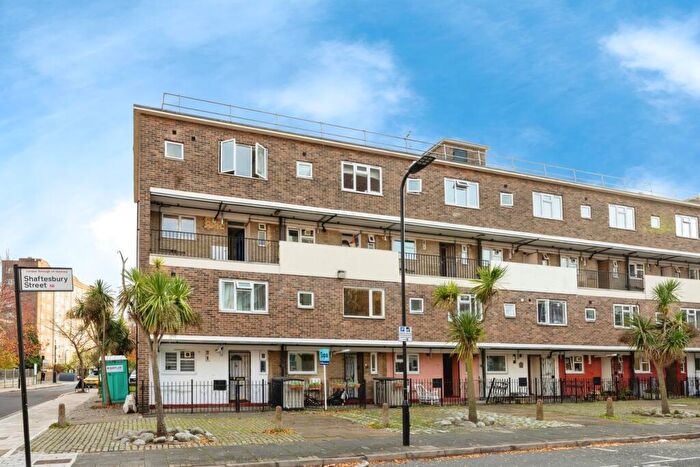
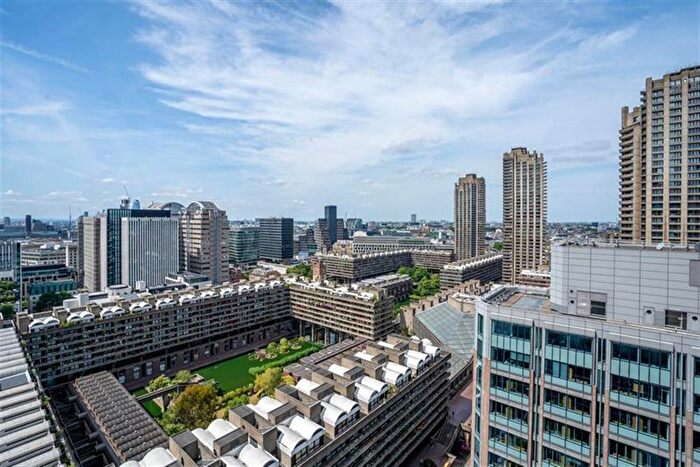
Houses for sale & to rent in Cripplegate, London
House Prices in Cripplegate
Properties in this part of Cripplegate within London have an average house price of £903,311.00 and had 168 Property Transactions within the last 3 years¹. This area has 1,440 households² , where the most expensive property was sold for £3,400,000.00.
Properties for sale in Cripplegate
Roads and Postcodes in Cripplegate
Navigate through our locations to find the location of your next house in Cripplegate, London for sale or to rent.
| Streets | Postcodes |
|---|---|
| Barbican | EC2Y 8AT EC2Y 8AU EC2Y 8AX EC2Y 8AY EC2Y 8BA EC2Y 8BD EC2Y 8BL EC2Y 8BN EC2Y 8DD EC2Y 8DL EC2Y 8DQ EC2Y 8NB EC2Y 8NH EC2Y 8NQ EC2Y 8PQ |
| Brackley Street | EC1Y 0AB |
| Brandon Mews | EC2Y 8BE |
| Fann Street | EC1Y 0SA |
| Frobisher Crescent | EC2Y 8HD |
| Golden Lane | EC1Y 0AD EC1Y 0RR |
| Golden Lane Estate | EC1Y 0RB EC1Y 0RD EC1Y 0RE EC1Y 0RH EC1Y 0RJ EC1Y 0RL EC1Y 0RN EC1Y 0RQ EC1Y 0SH EC1Y 0SJ EC1Y 0SL EC1Y 0SN EC1Y 0SQ EC1Y 0ST EC1Y 0SU EC1Y 0TN EC1Y 0TP EC1Y 0TR |
| Milton Street | EC2Y 9BH |
| Monkwell Square | EC2Y 5BL |
| Moor Lane | EC2Y 9AP EC2Y 9AZ EC2Y 9BA EC2Y 9BB |
| Silk Street | EC2Y 8DS EC2Y 8DT |
| Speed Highwalk | EC2Y 8DX |
| St Giles Terrace | EC2Y 8DU |
| The Postern | EC2Y 8BJ |
| Wallside | EC2Y 8BH |
| EC2Y 8BB EC2Y 8DA |
Transport near Cripplegate
-
Barbican Station
-
Moorgate Station
-
Old Street Station
-
St. Pauls Station
-
Farringdon Station
-
Liverpool Street Station
-
Bank Station
-
Mansion House Station
-
City Thameslink Station
-
Cannon Street Station
- FAQ
- Price Paid By Year
- Property Type Price
Frequently asked questions about Cripplegate
What is the average price for a property for sale in Cripplegate?
The average price for a property for sale in Cripplegate is £903,311. This amount is 11% lower than the average price in London. There are 7,655 property listings for sale in Cripplegate.
What streets have the most expensive properties for sale in Cripplegate?
The streets with the most expensive properties for sale in Cripplegate are The Postern at an average of £2,420,000, Brandon Mews at an average of £1,282,333 and Barbican at an average of £933,068.
What streets have the most affordable properties for sale in Cripplegate?
The streets with the most affordable properties for sale in Cripplegate are Golden Lane Estate at an average of £601,611, Moor Lane at an average of £787,885 and Frobisher Crescent at an average of £864,000.
Which train stations are available in or near Cripplegate?
Some of the train stations available in or near Cripplegate are Moorgate, Old Street and Farringdon.
Which tube stations are available in or near Cripplegate?
Some of the tube stations available in or near Cripplegate are Barbican, Moorgate and Old Street.
Property Price Paid in Cripplegate by Year
The average sold property price by year was:
| Year | Average Sold Price | Price Change |
Sold Properties
|
|---|---|---|---|
| 2025 | £858,327 | -3% |
25 Properties |
| 2024 | £886,141 | -10% |
46 Properties |
| 2023 | £977,803 | 12% |
53 Properties |
| 2022 | £857,090 | -6% |
44 Properties |
| 2021 | £906,163 | 4% |
58 Properties |
| 2020 | £871,724 | 3% |
31 Properties |
| 2019 | £845,683 | -12% |
45 Properties |
| 2018 | £943,679 | 4% |
56 Properties |
| 2017 | £906,709 | -4% |
52 Properties |
| 2016 | £943,225 | -2% |
52 Properties |
| 2015 | £961,705 | -2% |
72 Properties |
| 2014 | £978,457 | 17% |
81 Properties |
| 2013 | £810,886 | 38% |
274 Properties |
| 2012 | £499,741 | -2% |
39 Properties |
| 2011 | £508,179 | 10% |
80 Properties |
| 2010 | £455,296 | -4% |
67 Properties |
| 2009 | £471,718 | 12% |
40 Properties |
| 2008 | £416,614 | -9% |
24 Properties |
| 2007 | £454,332 | 16% |
75 Properties |
| 2006 | £381,210 | 16% |
73 Properties |
| 2005 | £321,252 | -4% |
79 Properties |
| 2004 | £332,938 | 12% |
75 Properties |
| 2003 | £291,521 | 6% |
92 Properties |
| 2002 | £274,177 | 9% |
96 Properties |
| 2001 | £248,771 | 8% |
85 Properties |
| 2000 | £228,680 | 24% |
89 Properties |
| 1999 | £174,848 | 15% |
125 Properties |
| 1998 | £148,870 | 13% |
84 Properties |
| 1997 | £128,952 | 15% |
86 Properties |
| 1996 | £110,117 | -2% |
86 Properties |
| 1995 | £112,489 | - |
69 Properties |
Property Price per Property Type in Cripplegate
Here you can find historic sold price data in order to help with your property search.
The average Property Paid Price for specific property types in the last three years are:
| Property Type | Average Sold Price | Sold Properties |
|---|---|---|
| Flat | £903,311.00 | 168 Flats |


