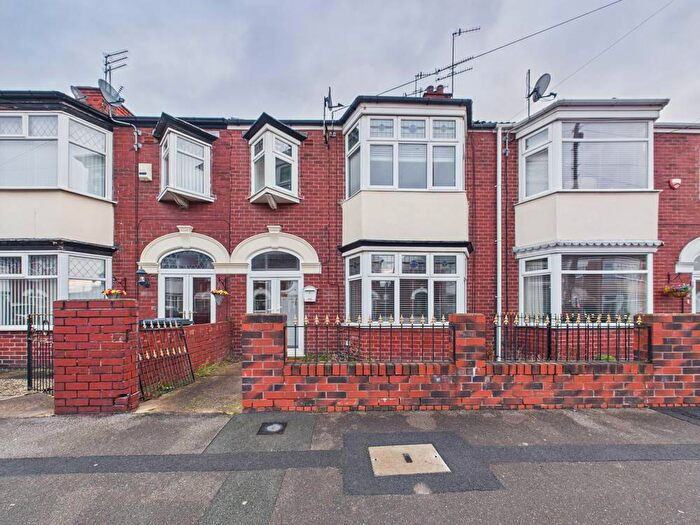
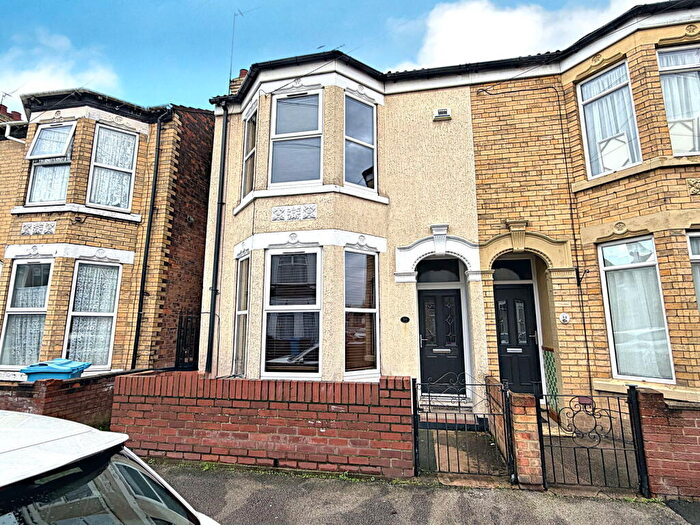
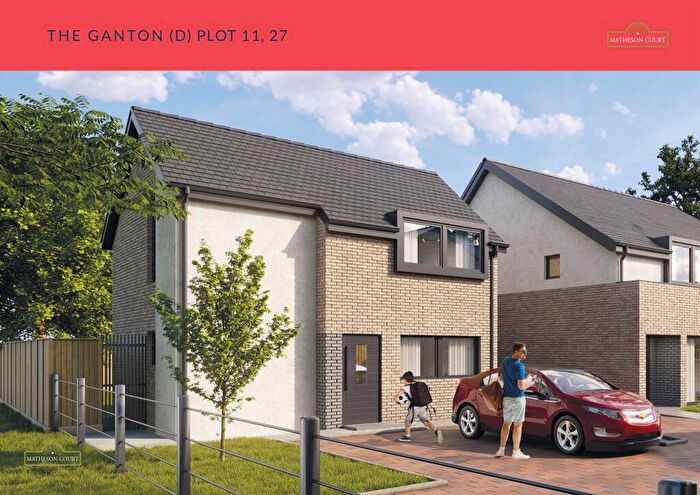
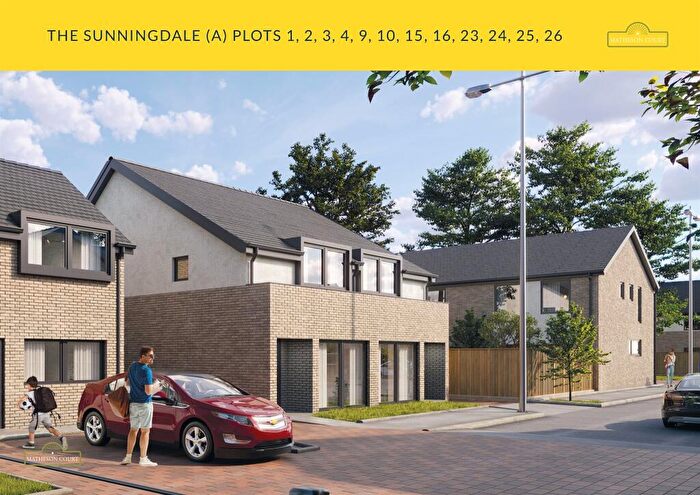
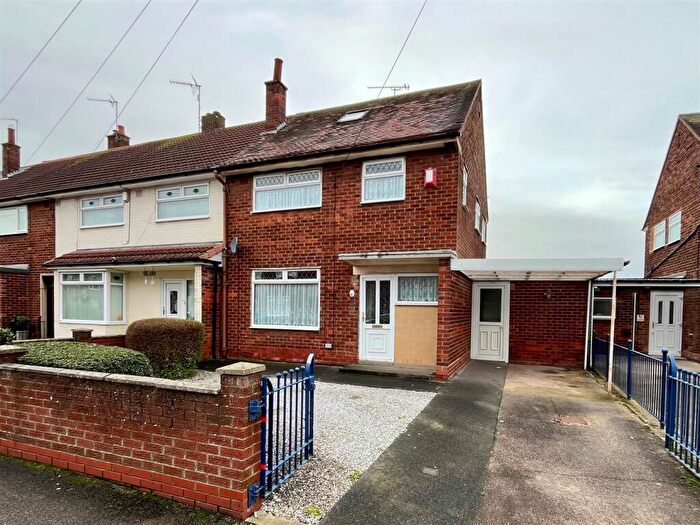
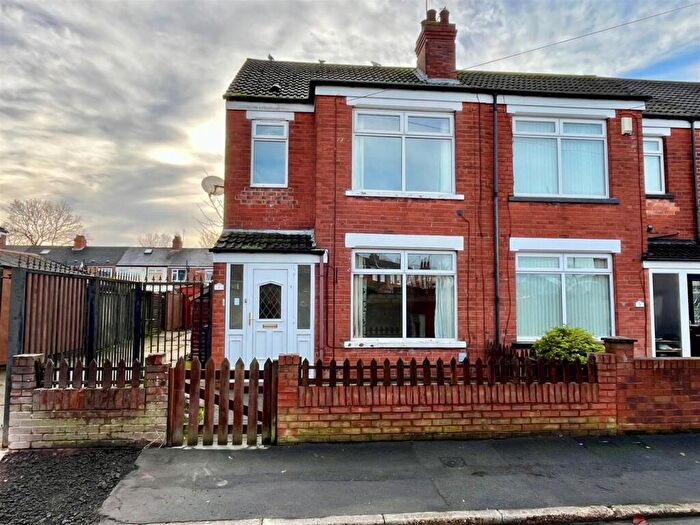
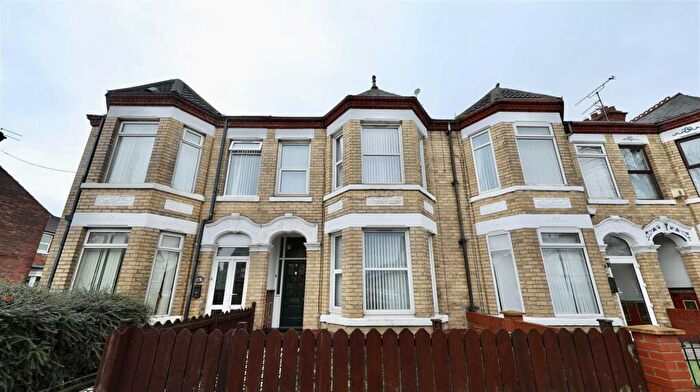
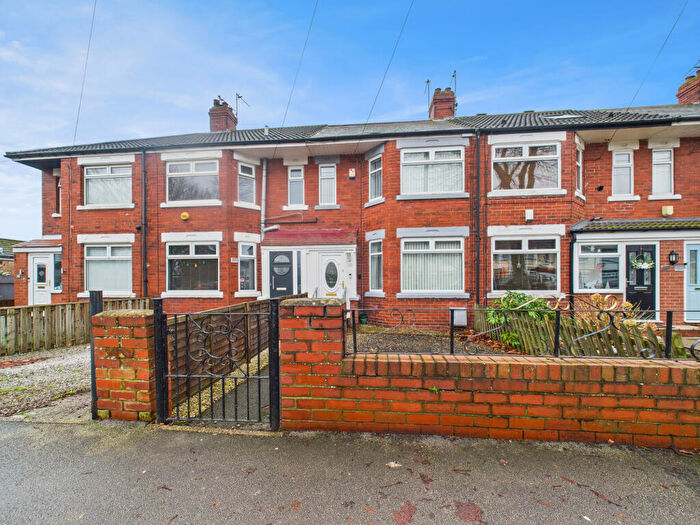
Houses for sale & to rent in Southcoates East, Hull
House Prices in Southcoates East
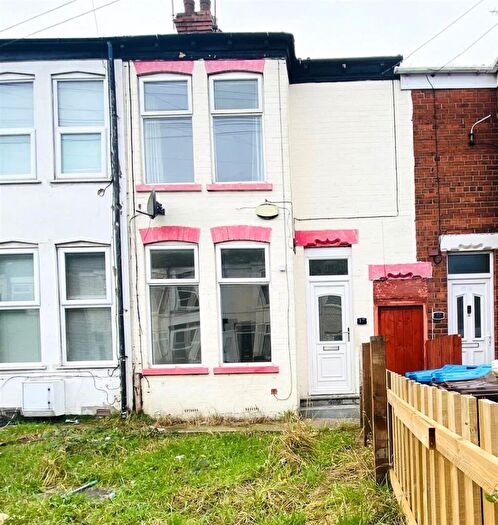
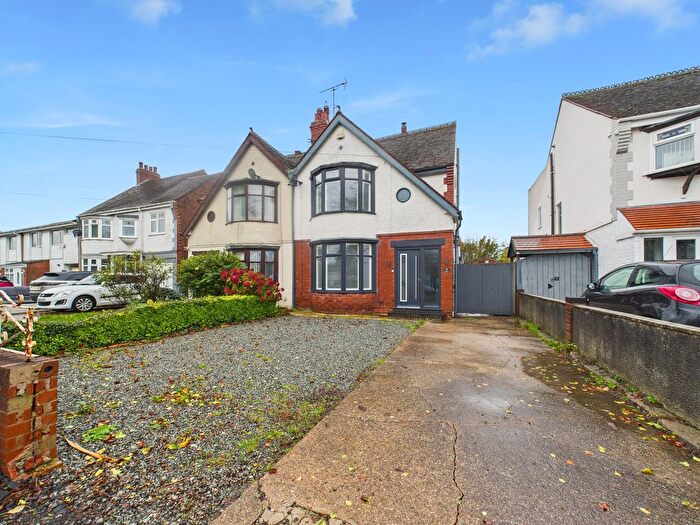
Properties in Southcoates East have an average house price of £128,046.00 and had 180 Property Transactions within the last 3 years¹.
Southcoates East is an area in Hull, City of Kingston upon Hull with 2,455 households², where the most expensive property was sold for £245,000.00.
Properties for sale in Southcoates East
Roads and Postcodes in Southcoates East
Navigate through our locations to find the location of your next house in Southcoates East, Hull for sale or to rent.
| Streets | Postcodes |
|---|---|
| Aberdeen Street | HU9 3JS HU9 3JU |
| Arnold Mews | HU9 3LL |
| Bessingby Grove | HU9 5UG |
| Bilsdale Grove | HU9 3UP HU9 3US HU9 3UT HU9 3UX HU9 3UY |
| Bilton Grove | HU9 5XZ HU9 5YA |
| Bransdale Grove | HU9 3UR |
| Brigham Grove | HU9 5TY |
| Cambridge Grove | HU9 3SJ HU9 3SN |
| Camerton Grove | HU9 3PS |
| Charlton Mews | HU9 3AS |
| College Grove | HU9 3RU HU9 3RZ HU9 3SG |
| Danthorpe Grove | HU9 3RA |
| Downing Grove | HU9 3SY HU9 3SZ |
| Ellerby Grove | HU9 3PR HU9 3RE |
| Endeavour Crescent | HU9 5SY HU9 5SZ |
| Exeter Grove | HU9 3ST HU9 5XS |
| Fire Station Houses | HU9 3TX |
| Fitling Grove | HU9 3DJ |
| Foston Grove | HU9 5UU |
| Ganstead Grove | HU9 3QU HU9 3QX |
| Glaisdale Grove | HU9 3UU |
| Hilston Grove | HU9 5UN HU9 5UW |
| Holderness Road | HU9 3EX HU9 3EY HU9 3EZ HU9 3JA HU9 3JP HU9 3JR |
| Hopkins Street | HU9 5XU |
| Keble Grove | HU9 3TA |
| Kilnsea Grove | HU9 3QP HU9 3QS HU9 3RB HU9 3RD |
| Kingsley Avenue | HU9 3HL |
| Laytham Grove | HU9 3EQ |
| Lismore Avenue | HU9 3NL |
| Lorenzos Way | HU9 3HS |
| Mappleton Grove | HU9 5XD |
| Marfleet Lane | HU9 5TH HU9 5UH |
| Maybury Road | HU9 3NG HU9 3NX |
| Oban Avenue | HU9 3NH HU9 3NJ |
| Oriel Grove | HU9 3SU |
| Pembroke Grove | HU9 3SR |
| Portobello Street | HU9 3JB HU9 3JD HU9 3JE HU9 3JF HU9 3NN HU9 3NP HU9 3NR HU9 3NS HU9 3NT HU9 3NU HU9 3NW |
| Preston Road | HU9 3RN HU9 3RS HU9 3RW HU9 3TB HU9 5UP HU9 5UY |
| Rowlston Grove | HU9 3PU |
| Rutherglen Drive | HU9 3PE HU9 3PF |
| Ryedale Grove | HU9 3UZ |
| Ryehill Grove | HU9 3QG HU9 3QZ |
| Saints Close | HU9 3HU |
| Seafield Avenue | HU9 3JG HU9 3JQ |
| Skipsea Grove | HU9 3DF |
| Southcoates Avenue | HU9 3HF HU9 3HG HU9 3HP |
| Southcoates Lane | HU9 3UN |
| St Aidans Way | HU9 3HT |
| St Austells Close | HU9 3HX |
| St Clements Way | HU9 3HW |
| St Johns Grove | HU9 3RR HU9 3SP HU9 5SR HU9 5SS HU9 5ST |
| Stanhope Avenue | HU9 3HN |
| Suddaby Close | HU9 3RG |
| The Broadway | HU9 3JJ |
| Trinity Grove | HU9 3RP |
| Troutsdale Grove | HU9 3SB HU9 3SD HU9 3SE |
| Wansford Grove | HU9 5TT |
| Westerdale Grove | HU9 3UJ HU9 3UL |
| Whitworth Street | HU9 3HH |
Transport near Southcoates East
-
Hull Station
-
New Holland Station
-
Cottingham Station
-
Goxhill Station
-
Barrow Haven Station
-
Hessle Station
-
Thornton Abbey Station
-
Beverley Station
-
Barton-On-Humber Station
-
Ferriby Station
- FAQ
- Price Paid By Year
- Property Type Price
Frequently asked questions about Southcoates East
What is the average price for a property for sale in Southcoates East?
The average price for a property for sale in Southcoates East is £128,046. This amount is 4% lower than the average price in Hull. There are 1,410 property listings for sale in Southcoates East.
What streets have the most expensive properties for sale in Southcoates East?
The streets with the most expensive properties for sale in Southcoates East are St Clements Way at an average of £210,000, Seafield Avenue at an average of £189,000 and Kingsley Avenue at an average of £187,500.
What streets have the most affordable properties for sale in Southcoates East?
The streets with the most affordable properties for sale in Southcoates East are Camerton Grove at an average of £67,500, Danthorpe Grove at an average of £72,327 and College Grove at an average of £72,750.
Which train stations are available in or near Southcoates East?
Some of the train stations available in or near Southcoates East are Hull, New Holland and Cottingham.
Property Price Paid in Southcoates East by Year
The average sold property price by year was:
| Year | Average Sold Price | Price Change |
Sold Properties
|
|---|---|---|---|
| 2025 | £129,411 | 9% |
28 Properties |
| 2024 | £117,326 | -6% |
43 Properties |
| 2023 | £124,648 | -11% |
49 Properties |
| 2022 | £137,866 | 17% |
60 Properties |
| 2021 | £114,062 | 8% |
60 Properties |
| 2020 | £104,730 | 2% |
41 Properties |
| 2019 | £102,322 | 12% |
47 Properties |
| 2018 | £89,995 | -1% |
52 Properties |
| 2017 | £90,842 | 7% |
64 Properties |
| 2016 | £84,795 | -2% |
44 Properties |
| 2015 | £86,313 | 12% |
49 Properties |
| 2014 | £75,883 | -8% |
51 Properties |
| 2013 | £82,138 | 6% |
45 Properties |
| 2012 | £76,875 | -3% |
26 Properties |
| 2011 | £79,283 | 4% |
31 Properties |
| 2010 | £76,344 | -5% |
24 Properties |
| 2009 | £80,471 | 2% |
42 Properties |
| 2008 | £78,547 | -10% |
62 Properties |
| 2007 | £86,404 | 14% |
96 Properties |
| 2006 | £74,265 | 4% |
94 Properties |
| 2005 | £71,228 | 7% |
75 Properties |
| 2004 | £66,399 | 14% |
61 Properties |
| 2003 | £57,216 | 10% |
96 Properties |
| 2002 | £51,730 | 27% |
86 Properties |
| 2001 | £37,924 | 2% |
87 Properties |
| 2000 | £37,287 | 5% |
67 Properties |
| 1999 | £35,287 | 14% |
44 Properties |
| 1998 | £30,350 | -8% |
50 Properties |
| 1997 | £32,926 | -8% |
50 Properties |
| 1996 | £35,605 | 3% |
64 Properties |
| 1995 | £34,513 | - |
58 Properties |
Property Price per Property Type in Southcoates East
Here you can find historic sold price data in order to help with your property search.
The average Property Paid Price for specific property types in the last three years are:
| Property Type | Average Sold Price | Sold Properties |
|---|---|---|
| Semi Detached House | £136,596.00 | 75 Semi Detached Houses |
| Terraced House | £118,339.00 | 96 Terraced Houses |
| Detached House | £187,285.00 | 7 Detached Houses |
| Flat | £66,000.00 | 2 Flats |

