
Houses for sale & to rent in City of Kingston upon Hull, England
House Prices in City of Kingston upon Hull
Properties in City of Kingston upon Hull have
an average house price of
£134k
and had 9,755 Property Transactions
within the last 3 years.¹
City of Kingston upon Hull is a location in
England with
110,579 households², where the most expensive property was sold for £1.31M.
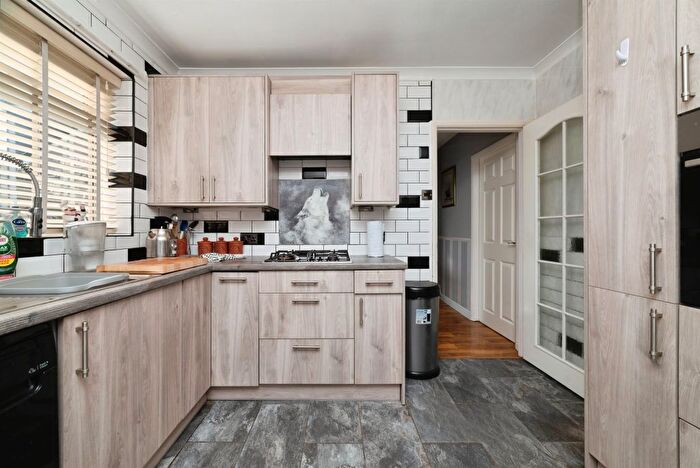
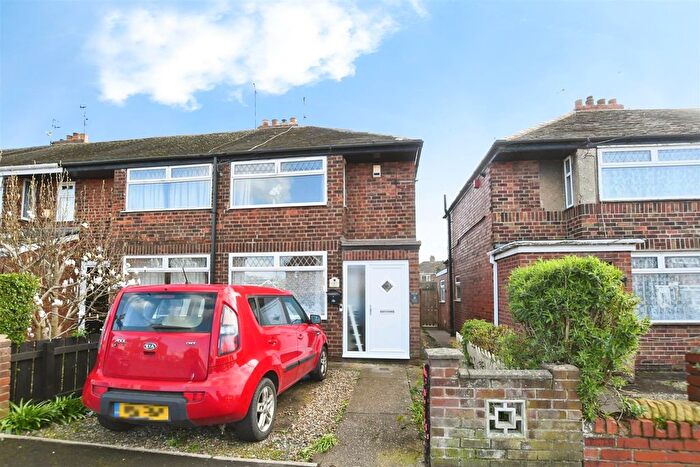
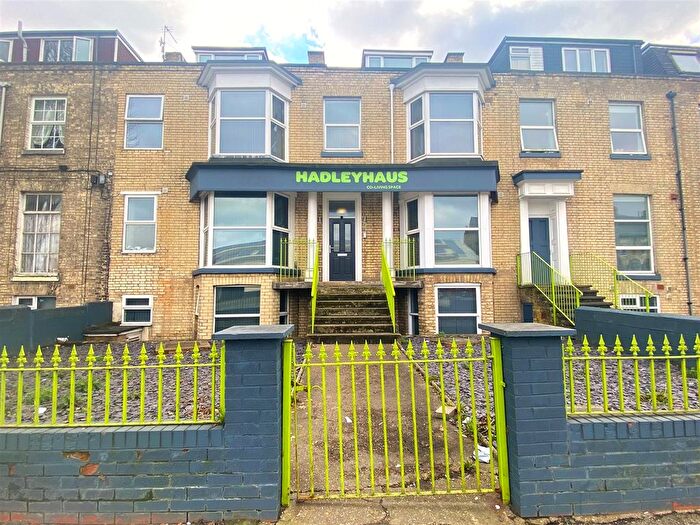
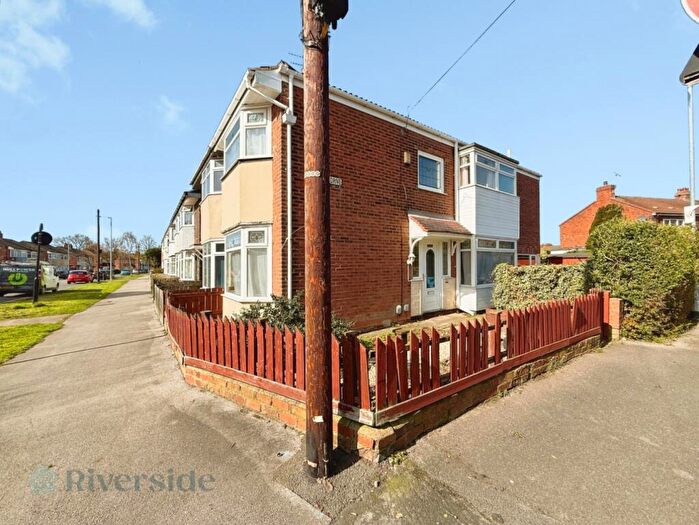
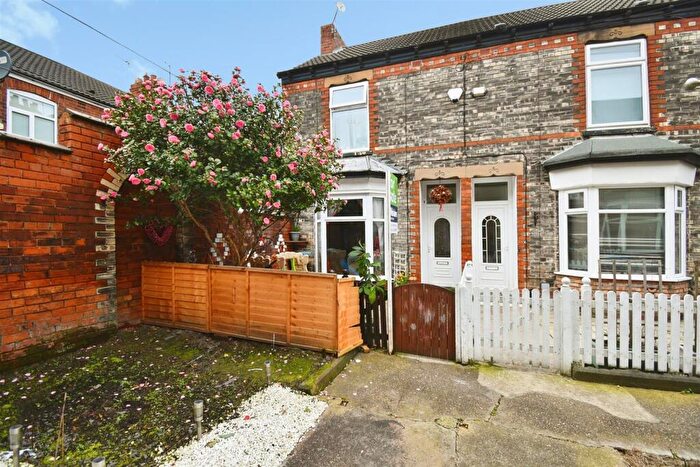
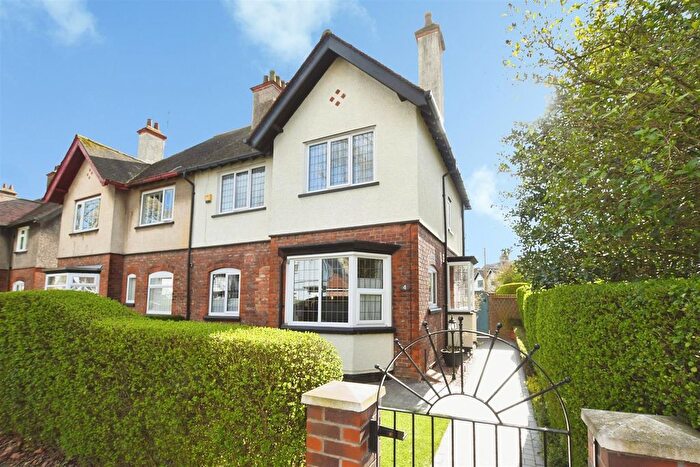
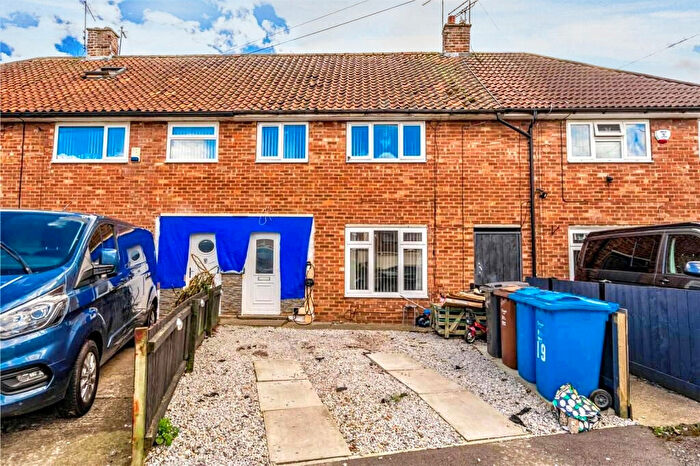
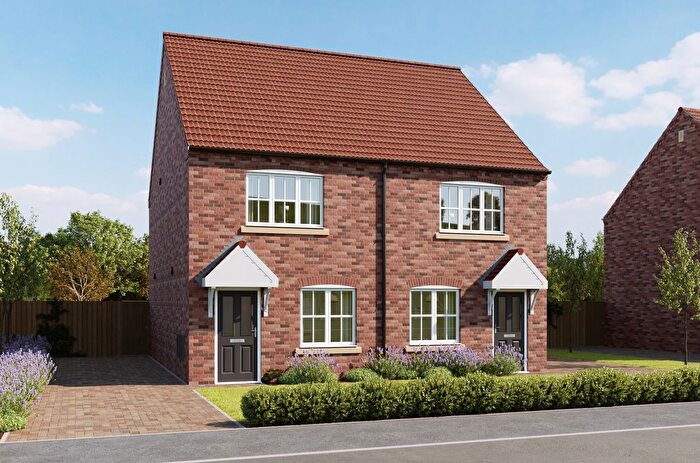
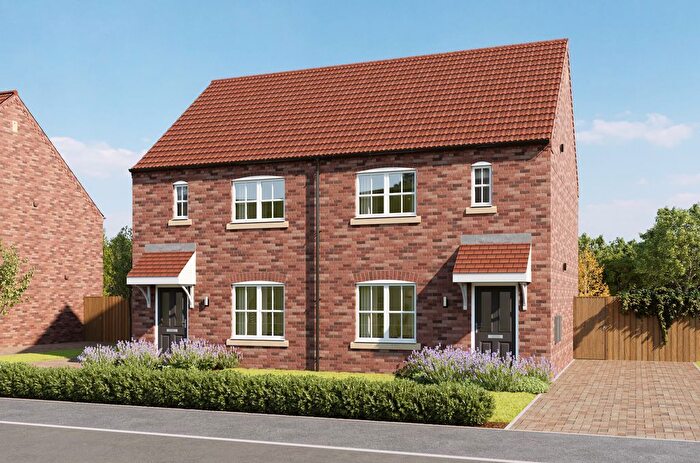
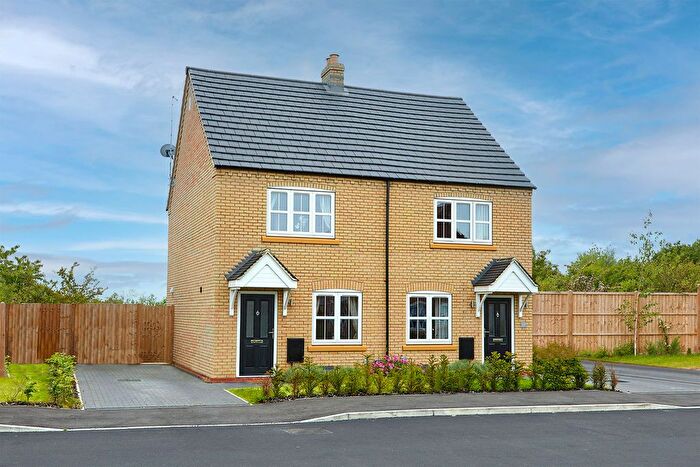
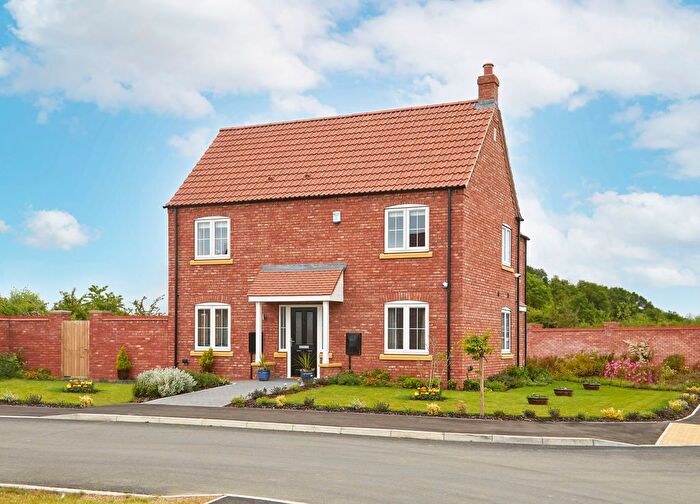
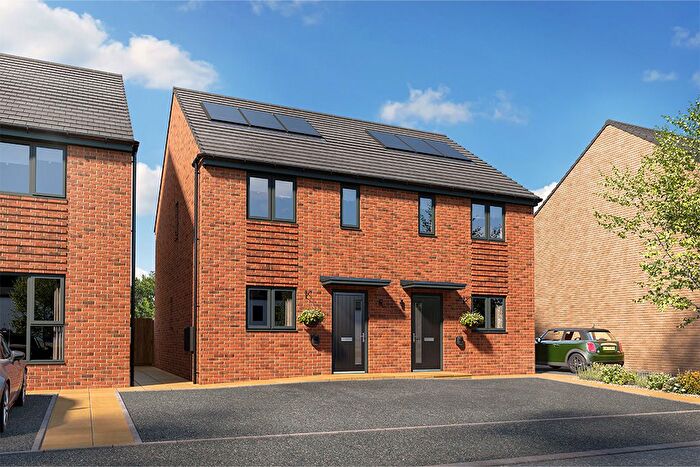
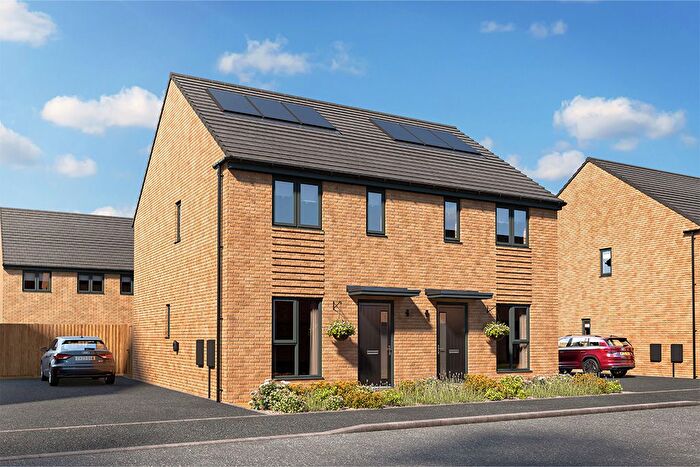
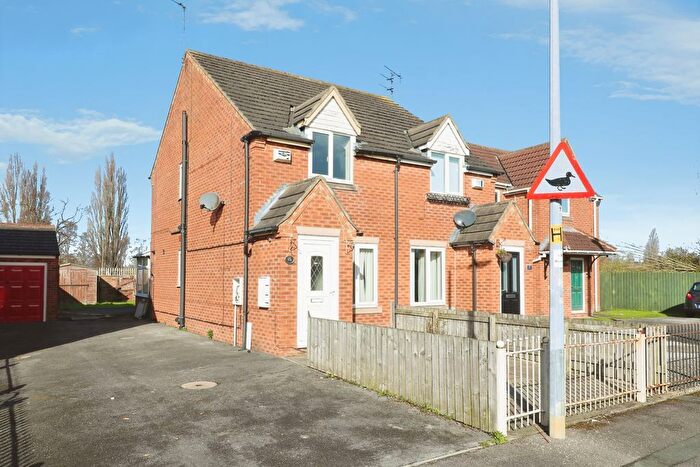
Properties for sale in City of Kingston upon Hull
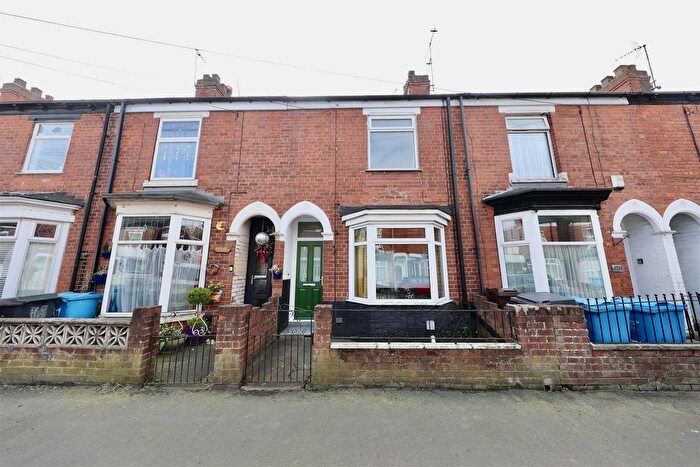
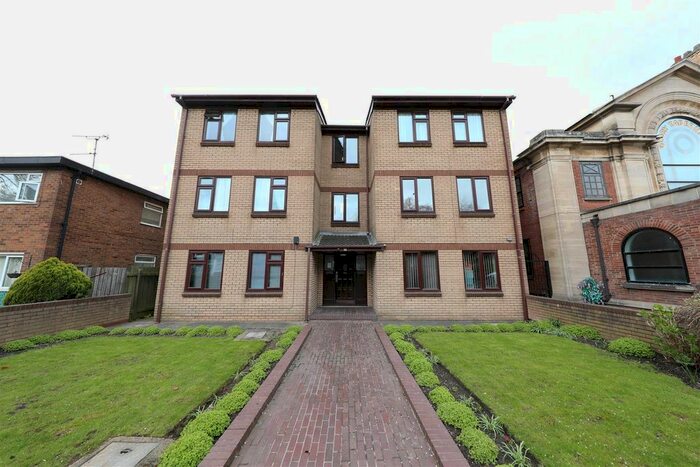
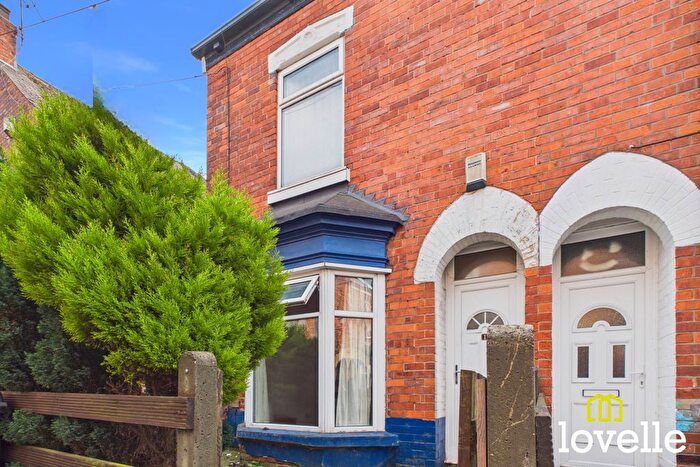
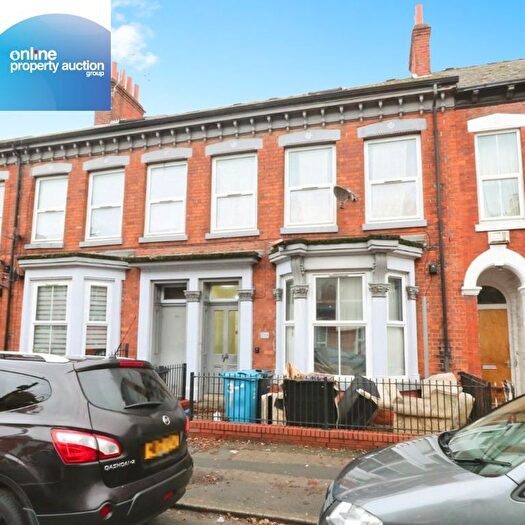
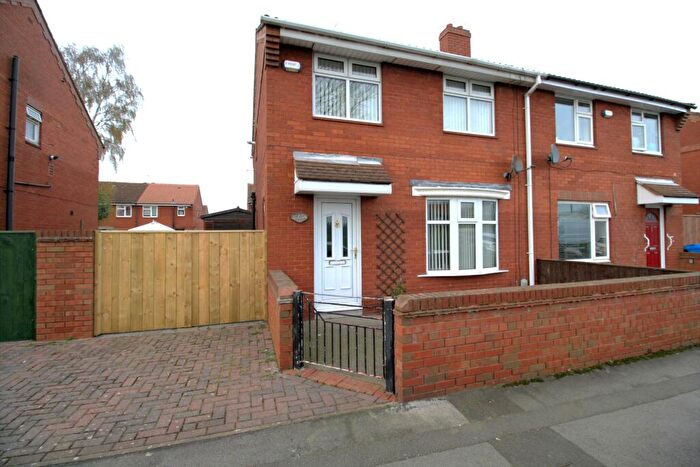

![]()
If you are looking to sell your house, let it out, or receive a property valuation, an expert can help you.
Click the button below to get started.


Towns in City of Kingston upon Hull
Navigate through our locations to find the location of your next house in City of Kingston upon Hull, England for sale or to rent.
Transport in City of Kingston upon Hull
Please see below transportation links in this area:

- FAQ
- Price Paid By Year
- Property Type Price
Frequently asked questions about City of Kingston upon Hull
What is the average price for a property for sale in City of Kingston upon Hull?
The average price for a property for sale in City of Kingston upon Hull is £133,674. This amount is 63% lower than the average price in England. There are more than 10,000 property listings for sale in City of Kingston upon Hull.
Which train stations are available in or near City of Kingston upon Hull?
Some of the train stations available in or near City of Kingston upon Hull are Hull, Cottingham and New Holland.
Property Price Paid in City of Kingston upon Hull by Year
The average sold property price by year was:
| Year | Average Sold Price | Price Change |
Sold Properties
|
|---|---|---|---|
| 2026 | £131,307 | -6% |
57 Properties |
| 2025 | £139,500 | 5% |
3,014 Properties |
| 2024 | £132,606 | 2% |
3,437 Properties |
| 2023 | £129,439 | -4% |
3,247 Properties |
| 2022 | £135,103 | 5% |
4,166 Properties |
| 2021 | £127,688 | 2% |
4,471 Properties |
| 2020 | £124,666 | 2% |
3,382 Properties |
| 2019 | £122,012 | 4% |
3,999 Properties |
| 2018 | £117,395 | 1% |
4,090 Properties |
| 2017 | £115,955 | 4% |
3,778 Properties |
| 2016 | £111,600 | 5% |
3,299 Properties |
| 2015 | £105,732 | 3% |
3,937 Properties |
| 2014 | £102,519 | 2% |
3,757 Properties |
| 2013 | £100,382 | 2% |
2,769 Properties |
| 2012 | £98,160 | -0,1% |
2,313 Properties |
| 2011 | £98,287 | -1% |
2,357 Properties |
| 2010 | £99,484 | 4% |
2,217 Properties |
| 2009 | £95,160 | -7% |
2,157 Properties |
| 2008 | £102,113 | -0,4% |
3,220 Properties |
| 2007 | £102,481 | 10% |
6,103 Properties |
| 2006 | £92,276 | 12% |
6,627 Properties |
| 2005 | £81,024 | 16% |
5,580 Properties |
| 2004 | £68,458 | 15% |
6,401 Properties |
| 2003 | £58,514 | 17% |
6,419 Properties |
| 2002 | £48,496 | 13% |
5,967 Properties |
| 2001 | £41,951 | 4% |
4,890 Properties |
| 2000 | £40,178 | - |
3,766 Properties |
| 1999 | £40,179 | 8% |
3,465 Properties |
| 1998 | £36,996 | 2% |
3,750 Properties |
| 1997 | £36,166 | 1% |
3,793 Properties |
| 1996 | £35,804 | -2% |
3,783 Properties |
| 1995 | £36,379 | - |
3,484 Properties |
Property Price per Property Type in City of Kingston upon Hull
Here you can find historic sold price data in order to help with your property search.
The average Property Paid Price for specific property types in the last three years are:
| Property Type | Average Sold Price | Sold Properties |
|---|---|---|
| Semi Detached House | £159,914.00 | 2,351 Semi Detached Houses |
| Terraced House | £116,632.00 | 6,134 Terraced Houses |
| Detached House | £250,196.00 | 633 Detached Houses |
| Flat | £85,145.00 | 637 Flats |