Houses for sale & to rent in Newborough, Peterborough
House Prices in Newborough
Properties in Newborough have an average house price of £339,631.00 and had 128 Property Transactions within the last 3 years¹.
Newborough is an area in Peterborough, City of Peterborough with 1,106 households², where the most expensive property was sold for £1,570,000.00.
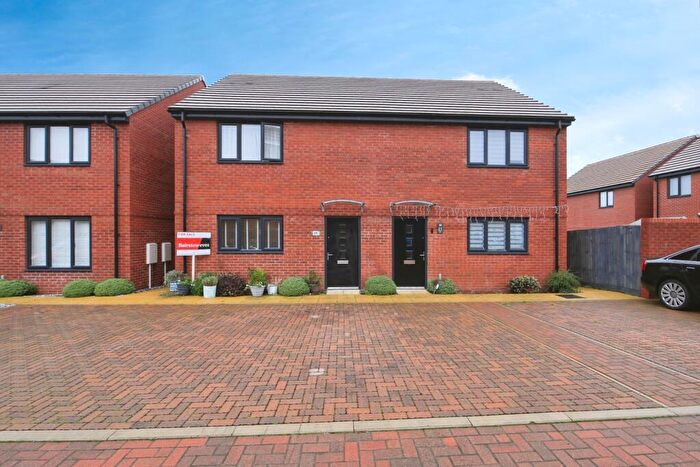
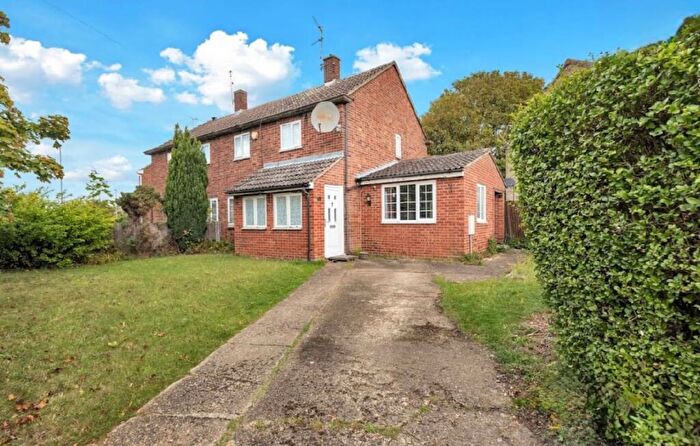
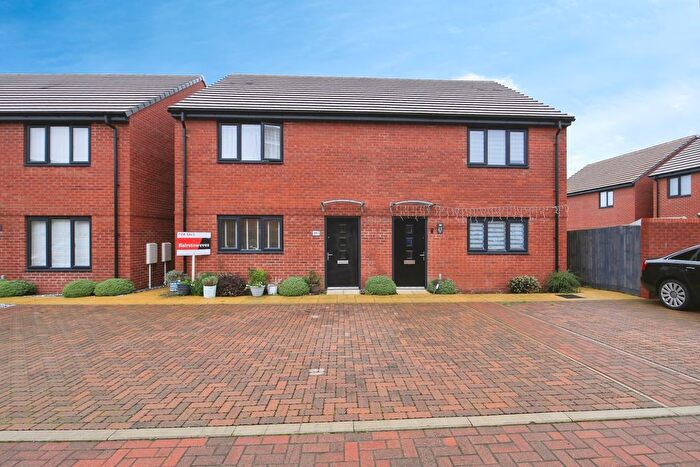
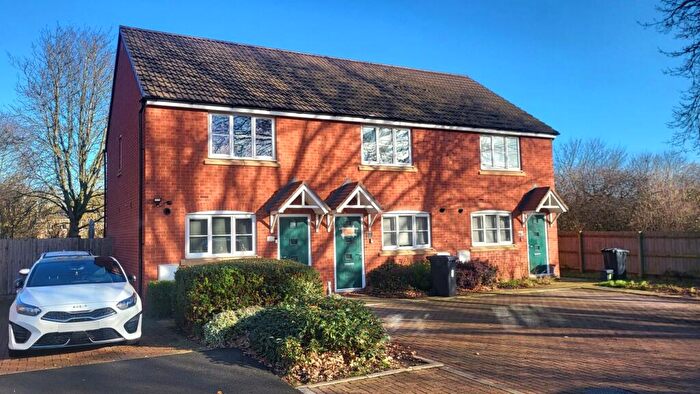
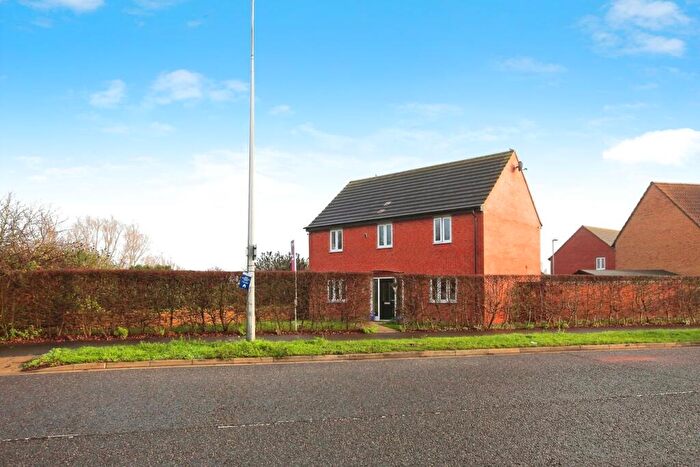
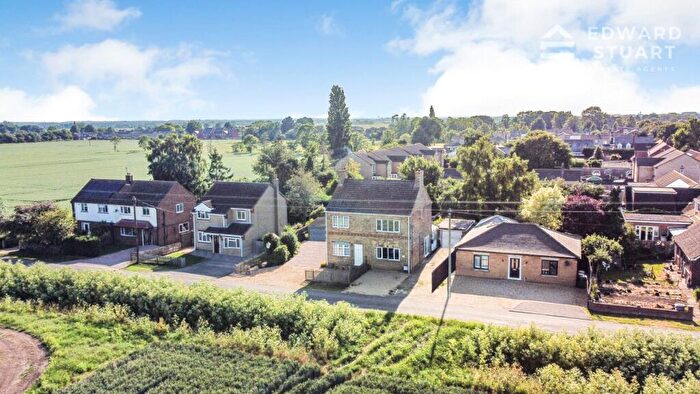
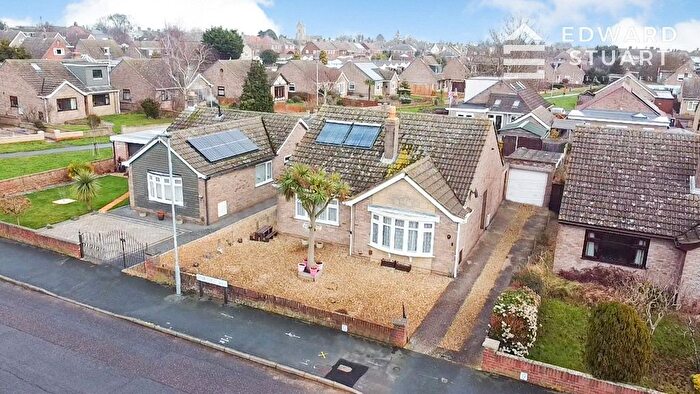
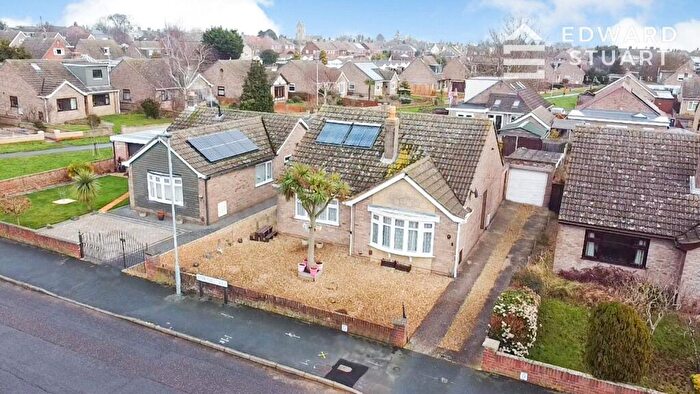
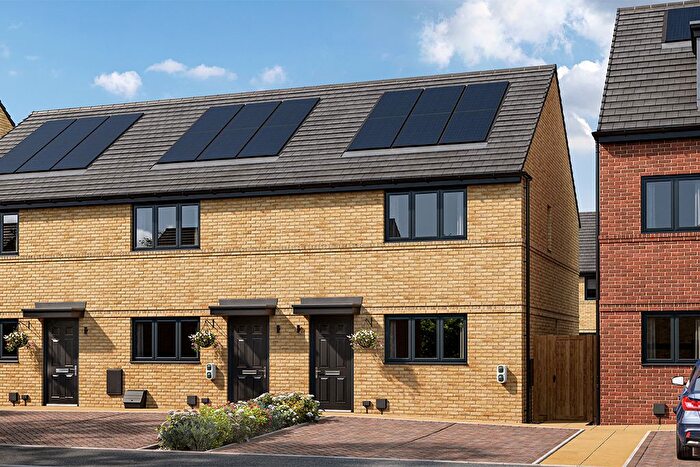
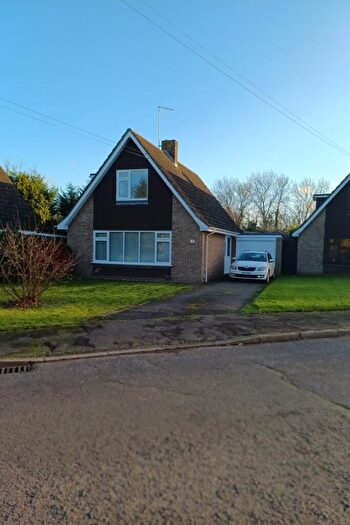
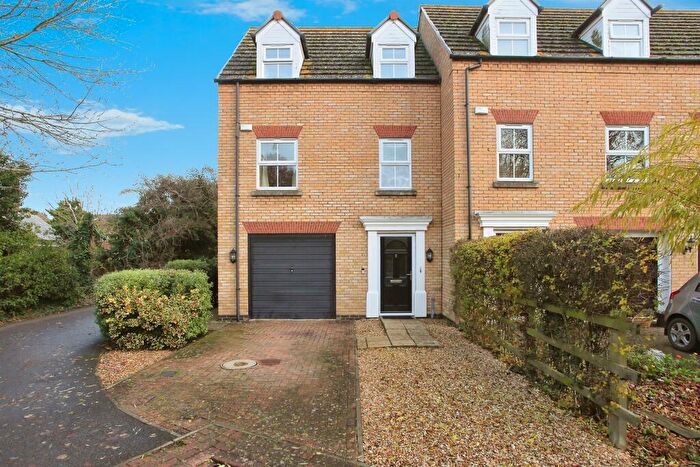
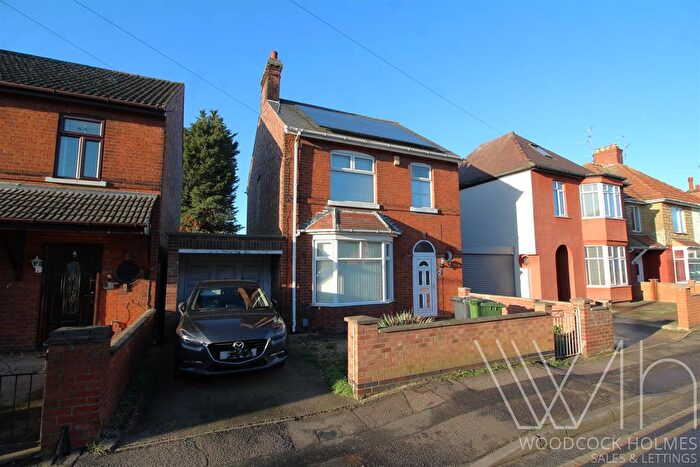
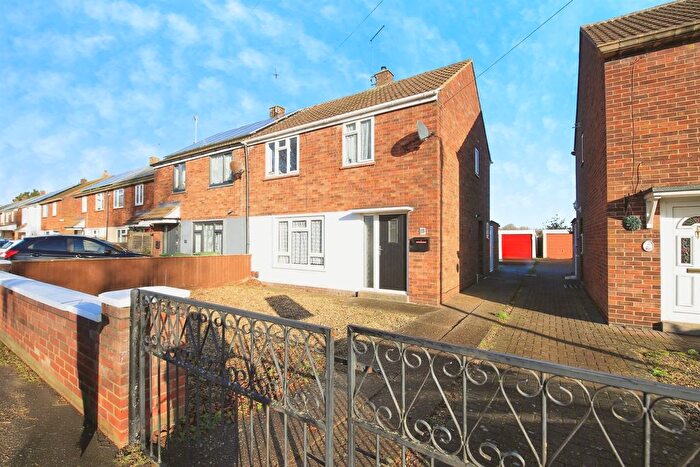
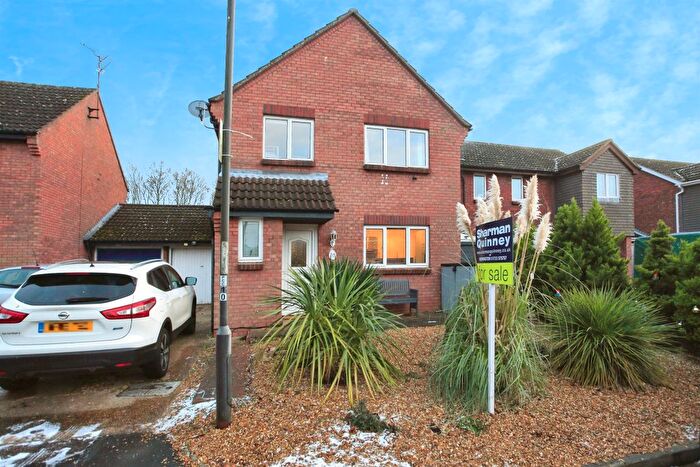
Properties for sale in Newborough
Roads and Postcodes in Newborough
Navigate through our locations to find the location of your next house in Newborough, Peterborough for sale or to rent.
| Streets | Postcodes |
|---|---|
| Bridgehill Road | PE6 7SA |
| Bukehorn Road | PE6 7TU |
| Bull Lane | PE6 7NQ |
| Chestnut Close | PE6 7NW |
| Church Close | PE6 7RA |
| Crowland Road | PE6 7TN PE6 7TP PE6 7TR PE6 7TT |
| Dawson Close | PE6 7SJ |
| Decoy Road | PE6 7QE |
| Deeping Road | PE6 7NP |
| East Close | PE6 7AR |
| Eves Close | PE6 7RF |
| Fenside Drive | PE6 7SF |
| Fernie Close | PE6 7RH |
| Firdale Close | PE6 7NS |
| Foxcovert Road | PE6 7HF |
| Glinton Road | PE6 7PN |
| Godfrey Close | PE6 7SS |
| Green Road | PE6 7YP PE6 7YR |
| Guntons Road | PE6 7QW PE6 7QZ PE6 7RT PE6 7RU |
| Harris Close | PE6 7AJ |
| Hawthorn Close | PE6 7QY |
| Holly Close | PE6 7QX |
| Hundreds Road | PE6 0LG |
| Laws Close | PE6 7PS |
| Meadow Road | PE6 7NX PE6 7QG |
| Milking Nook | PE6 7PL |
| Mill Close | PE6 7PA |
| Moor Road | PE6 7PQ |
| Newstead Close | PE6 7UH |
| Northam Close | PE6 7TS |
| Northborough Road | PE6 7PR |
| Penwald Court | PE6 7HD |
| Pershore Way | PE6 7QL |
| Peterborough Road | PE6 0AD PE6 7RE |
| Plough Lane | PE6 7SR |
| Quorn Close | PE6 7RQ |
| Reaches Lane | PE6 7TY |
| Rectory Lane | PE6 7NH |
| Reedmace Close | PE6 7QS |
| Rowell Close | PE6 7SU |
| School Road | PE6 7RG |
| Seargeants Close | PE6 7QU |
| Soke Road | PE6 7QT |
| Speechley Drove | PE6 7RR |
| St Martins Road | PE6 7QR PE6 7SH |
| St Pegas Road | PE6 7NF |
| The Mallards | PE6 7NJ |
| The Park | PE6 7NG |
| The Sanderlings | PE6 7NZ |
| Thorney Road | PE6 7NR PE6 7PH PE6 7PJ PE6 7PT PE6 7QP PE6 7RB PE6 7RS PE6 7RW |
| Verde Close | PE6 7GR |
| Walnut Close | PE6 7RJ |
| Waterfall Gardens | PE6 7QN |
| Werrington Bridge Road | PE6 7PP PE6 7QF |
| White Post Road | PE6 7SW |
| Whitsed Road | PE6 7ST |
| Williams Close | PE6 7RZ |
| Willow Drove | PE6 7QA PE6 7QB |
| Woolfehill Road | PE6 7YN |
| Wright Drove | PE6 0AB |
Transport near Newborough
- FAQ
- Price Paid By Year
- Property Type Price
Frequently asked questions about Newborough
What is the average price for a property for sale in Newborough?
The average price for a property for sale in Newborough is £339,631. This amount is 38% higher than the average price in Peterborough. There are 4,541 property listings for sale in Newborough.
What streets have the most expensive properties for sale in Newborough?
The streets with the most expensive properties for sale in Newborough are Bukehorn Road at an average of £950,000, Mill Close at an average of £710,000 and Deeping Road at an average of £685,000.
What streets have the most affordable properties for sale in Newborough?
The streets with the most affordable properties for sale in Newborough are Verde Close at an average of £181,718, Dawson Close at an average of £185,000 and School Road at an average of £235,000.
Which train stations are available in or near Newborough?
Some of the train stations available in or near Newborough are Peterborough, Whittlesea and Stamford.
Property Price Paid in Newborough by Year
The average sold property price by year was:
| Year | Average Sold Price | Price Change |
Sold Properties
|
|---|---|---|---|
| 2025 | £284,945 | -43% |
23 Properties |
| 2024 | £406,676 | 26% |
34 Properties |
| 2023 | £299,014 | -16% |
31 Properties |
| 2022 | £345,565 | 21% |
40 Properties |
| 2021 | £272,529 | 10% |
53 Properties |
| 2020 | £246,012 | -13% |
41 Properties |
| 2019 | £277,777 | 4% |
56 Properties |
| 2018 | £267,133 | 14% |
36 Properties |
| 2017 | £230,271 | -6% |
47 Properties |
| 2016 | £243,134 | 0,5% |
46 Properties |
| 2015 | £241,996 | 24% |
39 Properties |
| 2014 | £183,140 | -5% |
49 Properties |
| 2013 | £191,445 | 1% |
38 Properties |
| 2012 | £188,611 | 19% |
31 Properties |
| 2011 | £152,393 | -21% |
46 Properties |
| 2010 | £184,529 | 3% |
55 Properties |
| 2009 | £178,147 | -8% |
37 Properties |
| 2008 | £191,545 | -14% |
30 Properties |
| 2007 | £218,020 | -4% |
64 Properties |
| 2006 | £227,074 | 18% |
52 Properties |
| 2005 | £185,687 | 10% |
47 Properties |
| 2004 | £166,827 | -2% |
75 Properties |
| 2003 | £169,584 | 12% |
52 Properties |
| 2002 | £149,660 | 29% |
84 Properties |
| 2001 | £105,815 | 2% |
62 Properties |
| 2000 | £103,208 | 20% |
52 Properties |
| 1999 | £82,451 | 20% |
57 Properties |
| 1998 | £65,771 | 6% |
37 Properties |
| 1997 | £61,540 | -30% |
33 Properties |
| 1996 | £80,132 | 35% |
34 Properties |
| 1995 | £52,065 | - |
31 Properties |
Property Price per Property Type in Newborough
Here you can find historic sold price data in order to help with your property search.
The average Property Paid Price for specific property types in the last three years are:
| Property Type | Average Sold Price | Sold Properties |
|---|---|---|
| Semi Detached House | £251,647.00 | 39 Semi Detached Houses |
| Detached House | £410,981.00 | 76 Detached Houses |
| Terraced House | £214,025.00 | 8 Terraced Houses |
| Flat | £142,350.00 | 5 Flats |

