
Houses for sale & to rent in City of Peterborough, England
House Prices in City of Peterborough
Properties in City of Peterborough have
an average house price of
£251k
and had 7,029 Property Transactions
within the last 3 years.¹
City of Peterborough is a location in
England with
73,533 households², where the most expensive property was sold for £2.75M.
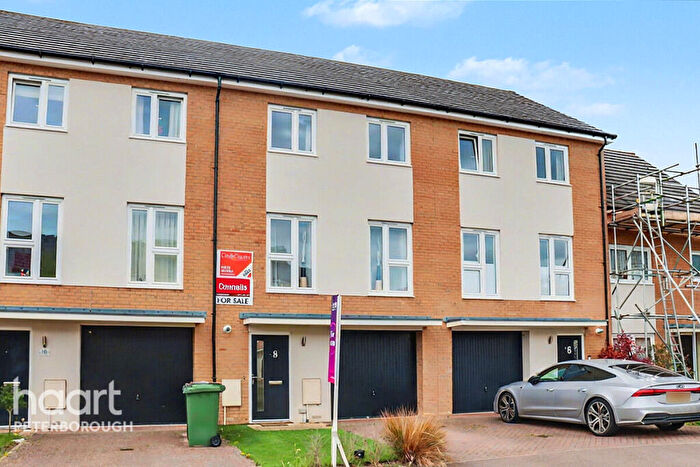
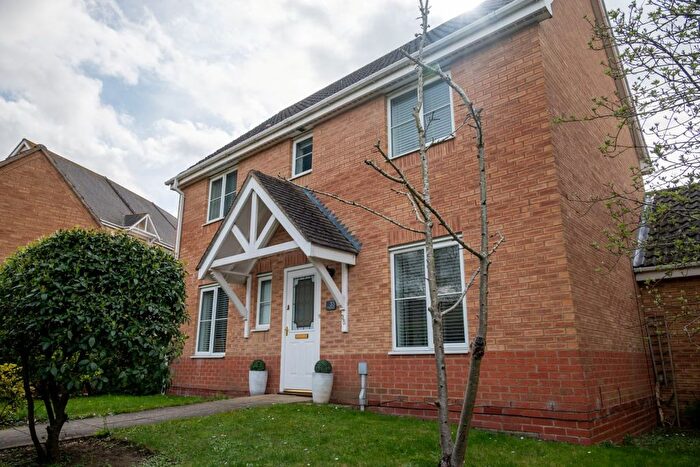
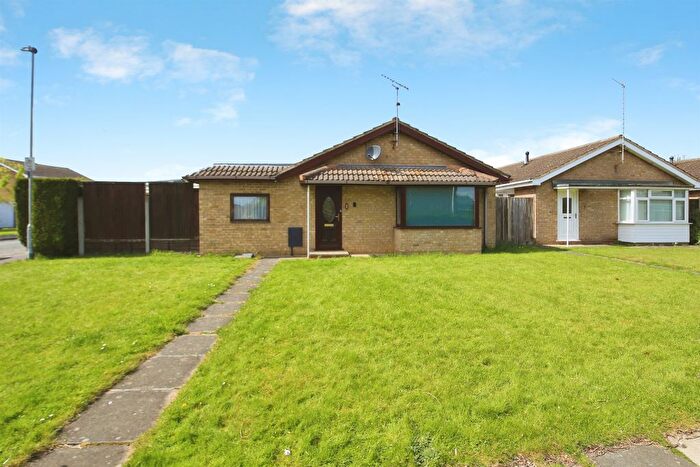
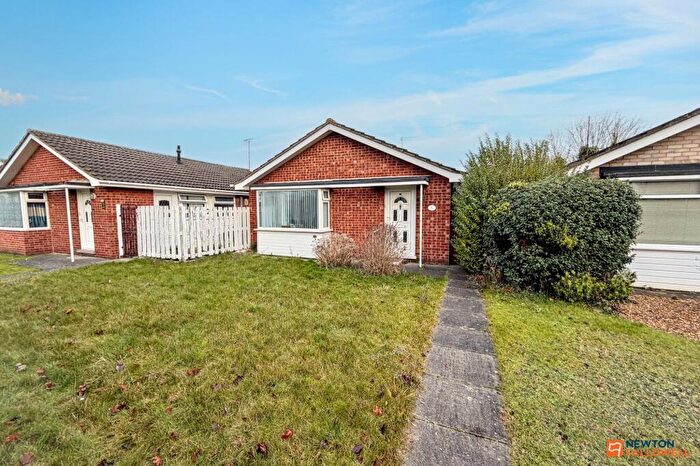
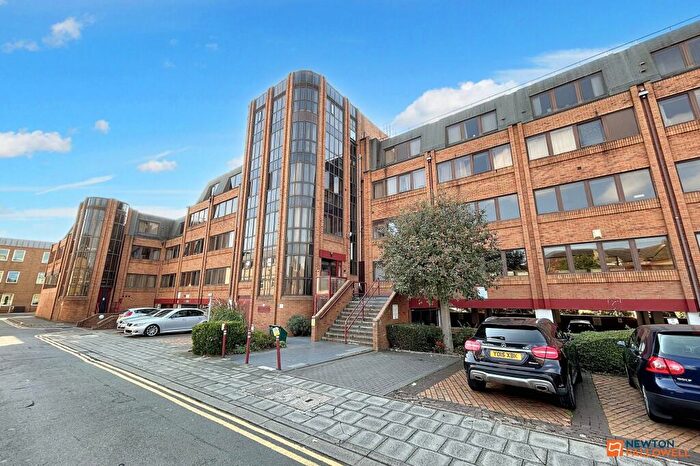
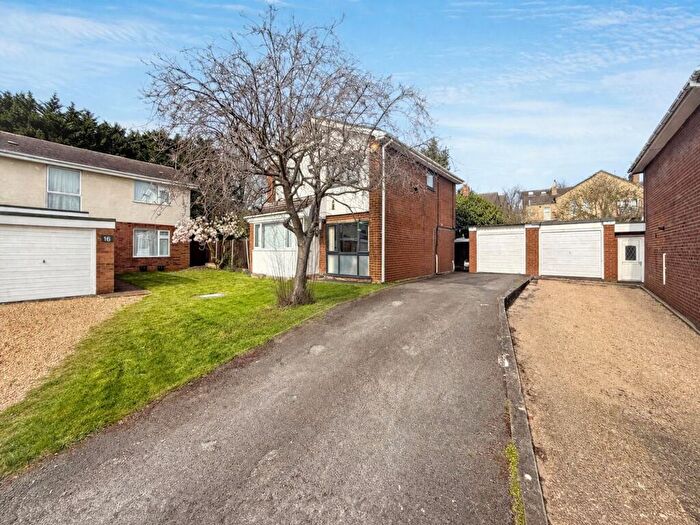
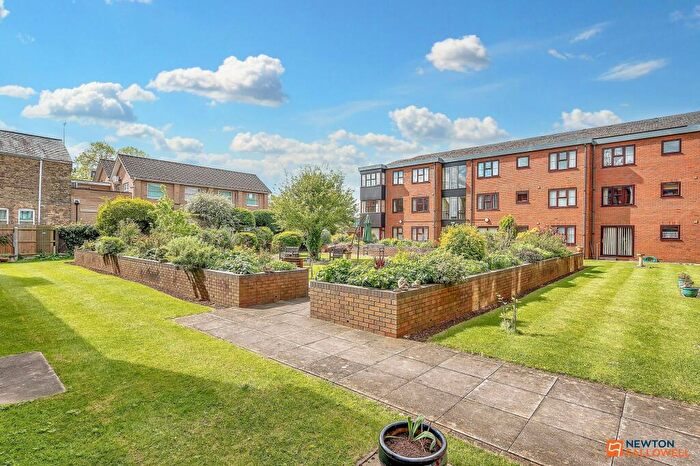
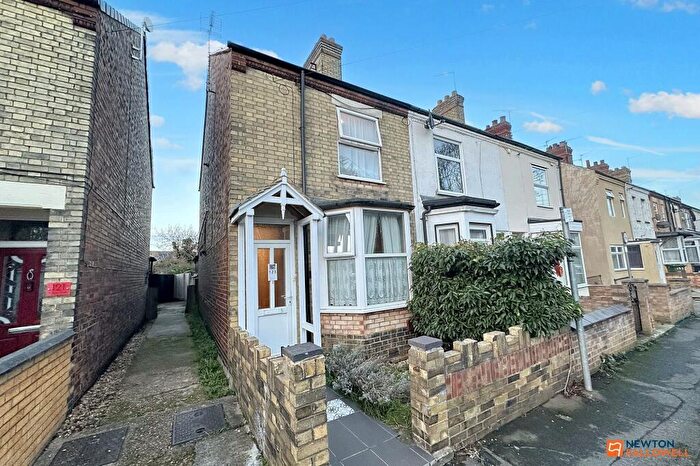
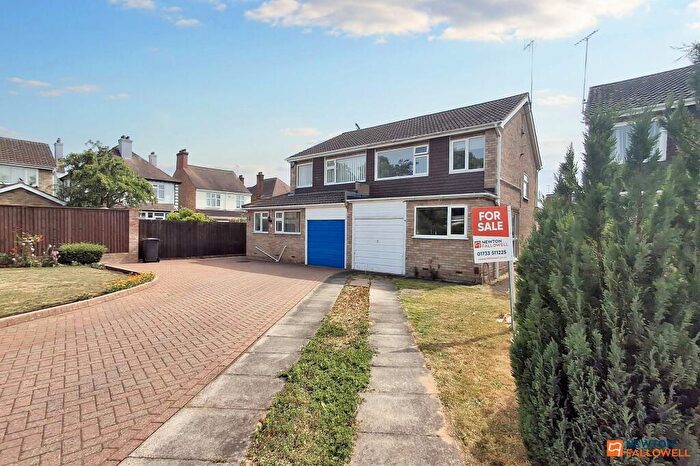
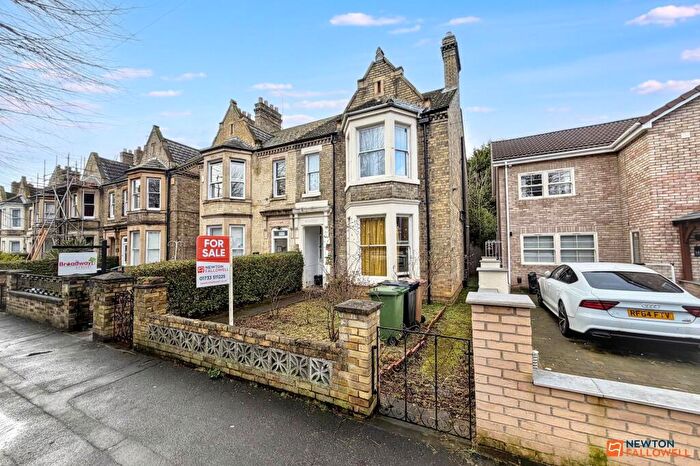
Properties for sale in City of Peterborough
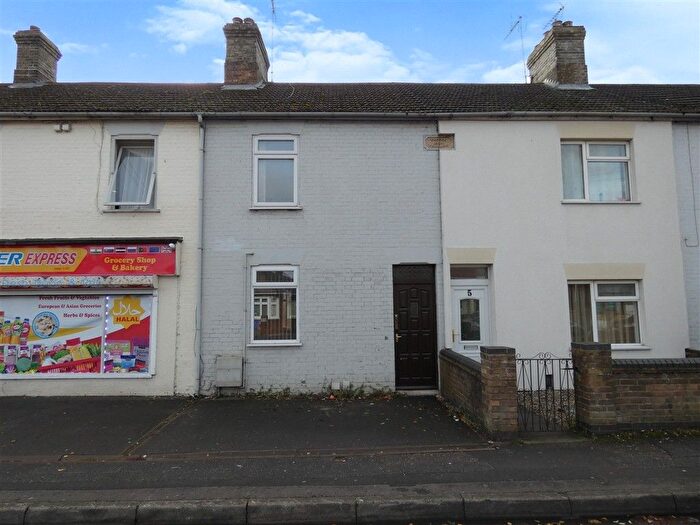
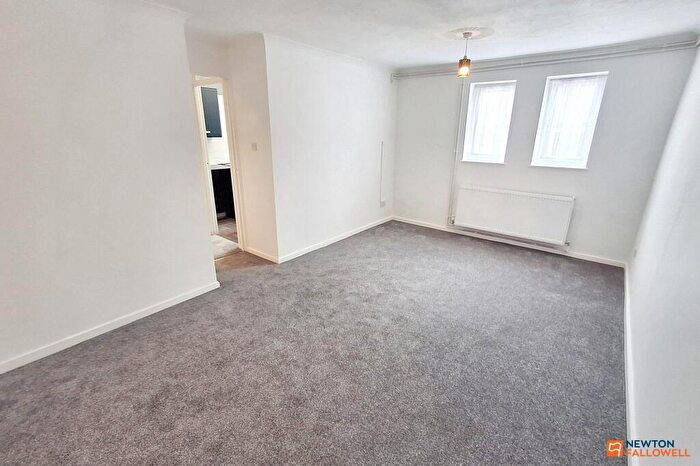
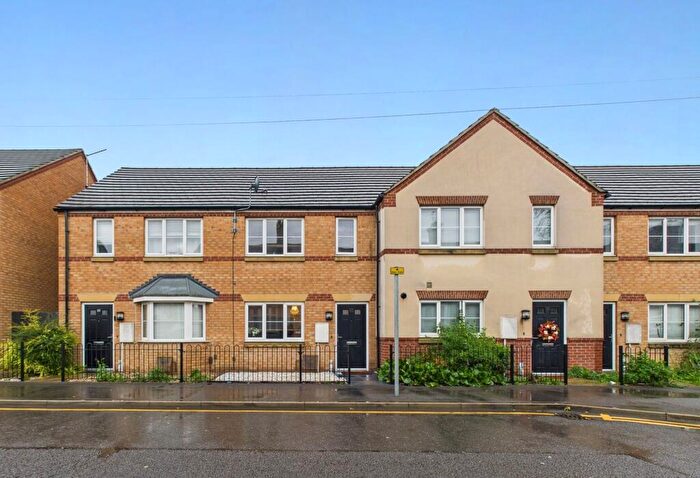
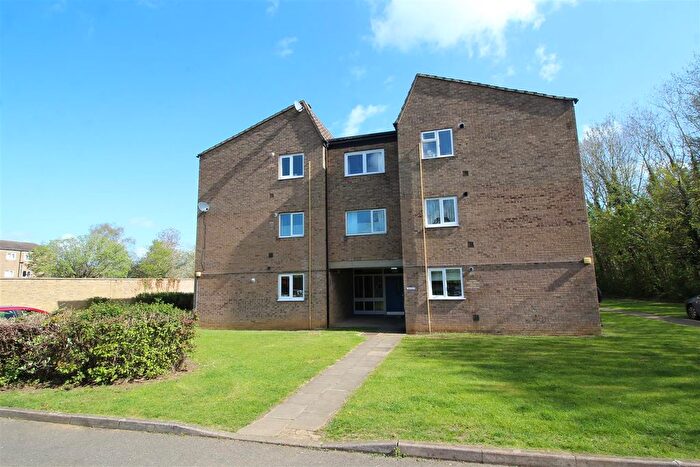
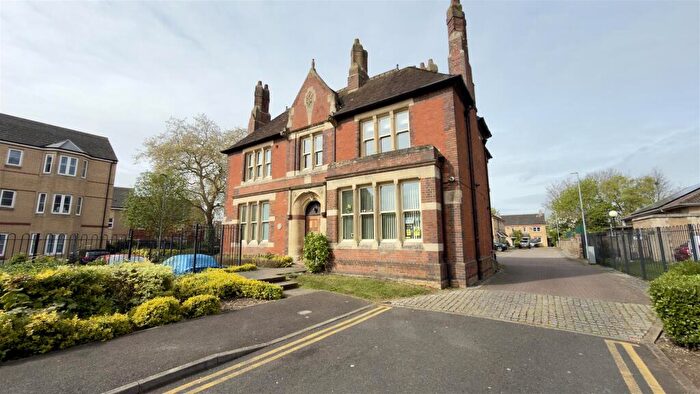
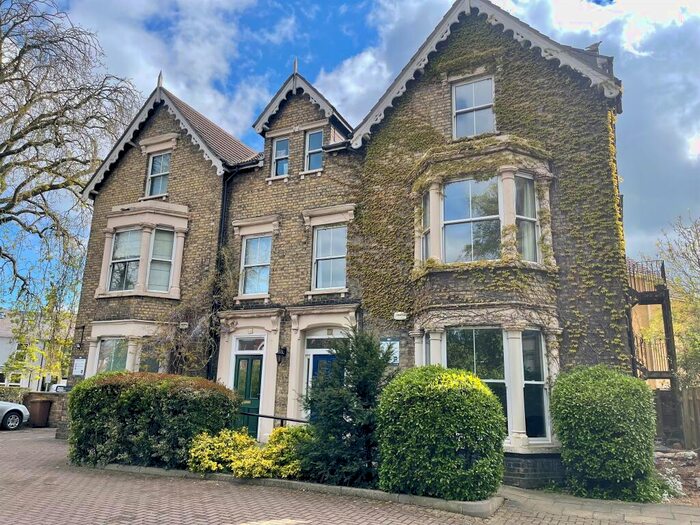
![]()
If you are looking to sell your house, let it out, or receive a property valuation, an expert can help you.
Click the button below to get started.
Towns in City of Peterborough
Navigate through our locations to find the location of your next house in City of Peterborough, England for sale or to rent.
Transport in City of Peterborough
Please see below transportation links in this area:

- FAQ
- Price Paid By Year
- Property Type Price
Frequently asked questions about City of Peterborough
What is the average price for a property for sale in City of Peterborough?
The average price for a property for sale in City of Peterborough is £250,839. This amount is 30% lower than the average price in England. There are more than 10,000 property listings for sale in City of Peterborough.
What locations have the most expensive properties for sale in City of Peterborough?
The location with the most expensive properties for sale in City of Peterborough is Stamford at an average of £730,890.
What locations have the most affordable properties for sale in City of Peterborough?
The location with the most affordable properties for sale in City of Peterborough is Peterborough at an average of £247,053.
Which train stations are available in or near City of Peterborough?
Some of the train stations available in or near City of Peterborough are Peterborough, Whittlesea and Stamford.
Property Price Paid in City of Peterborough by Year
The average sold property price by year was:
| Year | Average Sold Price | Price Change |
Sold Properties
|
|---|---|---|---|
| 2026 | £225,375 | -12% |
48 Properties |
| 2025 | £253,350 | -0,2% |
2,165 Properties |
| 2024 | £253,933 | 3% |
2,518 Properties |
| 2023 | £245,615 | -0,2% |
2,298 Properties |
| 2022 | £246,083 | 4% |
3,081 Properties |
| 2021 | £236,485 | 6% |
3,646 Properties |
| 2020 | £221,271 | 5% |
2,801 Properties |
| 2019 | £210,016 | 3% |
3,609 Properties |
| 2018 | £203,387 | 5% |
3,613 Properties |
| 2017 | £192,890 | 4% |
3,705 Properties |
| 2016 | £184,381 | 8% |
3,688 Properties |
| 2015 | £170,237 | 1% |
3,475 Properties |
| 2014 | £167,783 | 5% |
3,309 Properties |
| 2013 | £158,978 | 3% |
2,632 Properties |
| 2012 | £153,446 | -0,4% |
2,130 Properties |
| 2011 | £154,007 | -1% |
2,180 Properties |
| 2010 | £155,624 | 5% |
1,983 Properties |
| 2009 | £148,512 | -8% |
1,906 Properties |
| 2008 | £160,213 | -2% |
2,309 Properties |
| 2007 | £163,454 | 6% |
4,455 Properties |
| 2006 | £154,354 | 9% |
5,126 Properties |
| 2005 | £141,153 | 4% |
3,944 Properties |
| 2004 | £135,464 | 15% |
4,755 Properties |
| 2003 | £115,806 | 15% |
4,488 Properties |
| 2002 | £98,706 | 20% |
5,226 Properties |
| 2001 | £78,553 | 12% |
4,833 Properties |
| 2000 | £69,209 | 8% |
3,976 Properties |
| 1999 | £63,474 | 9% |
4,139 Properties |
| 1998 | £57,533 | 5% |
3,518 Properties |
| 1997 | £54,505 | 5% |
3,459 Properties |
| 1996 | £51,885 | 5% |
2,905 Properties |
| 1995 | £49,271 | - |
2,426 Properties |
Property Price per Property Type in City of Peterborough
Here you can find historic sold price data in order to help with your property search.
The average Property Paid Price for specific property types in the last three years are:
| Property Type | Average Sold Price | Sold Properties |
|---|---|---|
| Semi Detached House | £237,216.00 | 2,241 Semi Detached Houses |
| Terraced House | £193,937.00 | 2,152 Terraced Houses |
| Detached House | £379,143.00 | 1,912 Detached Houses |
| Flat | £123,305.00 | 724 Flats |