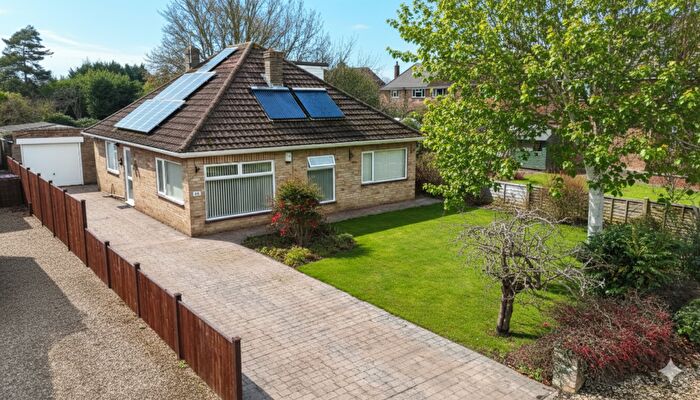
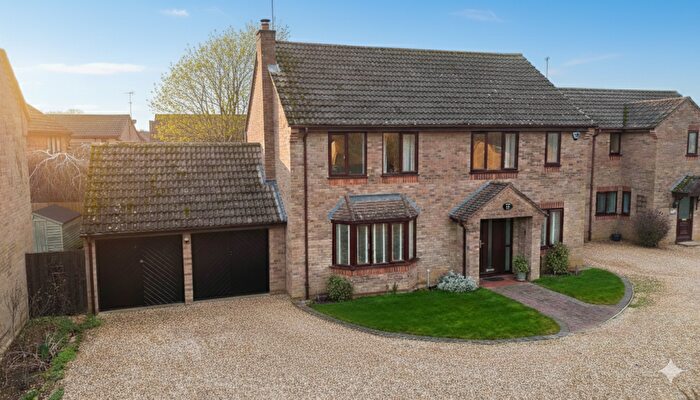
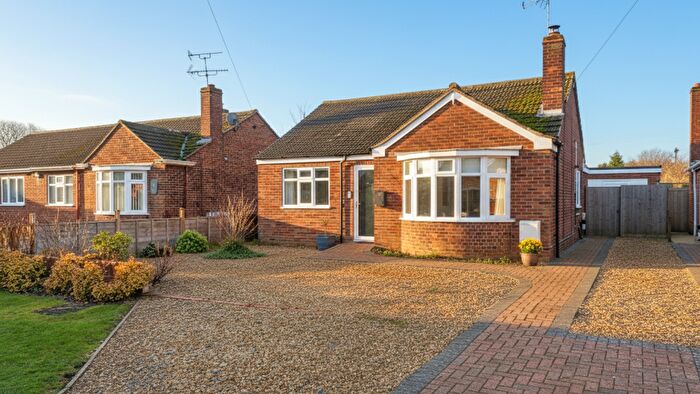
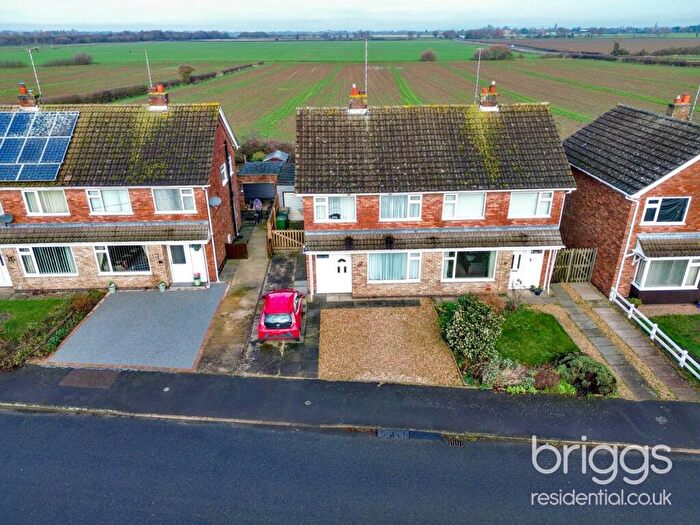
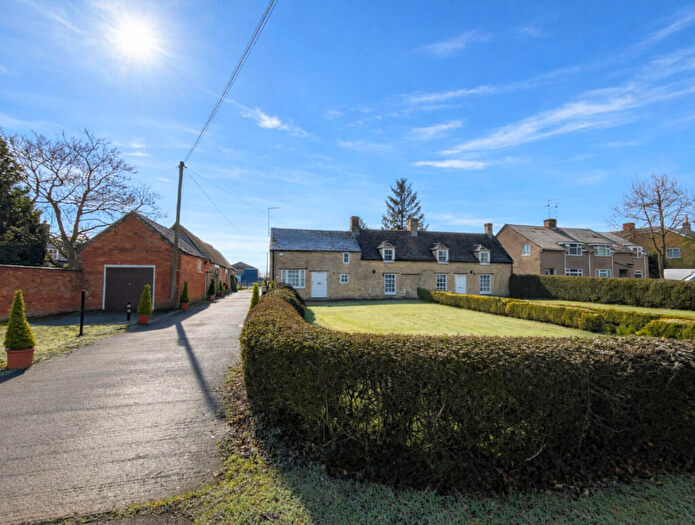
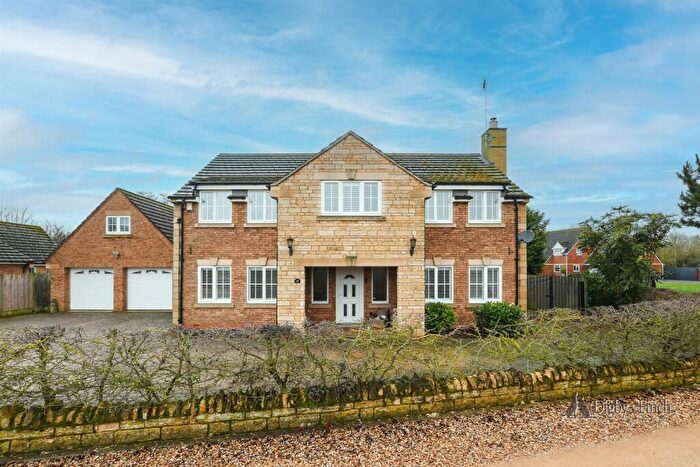
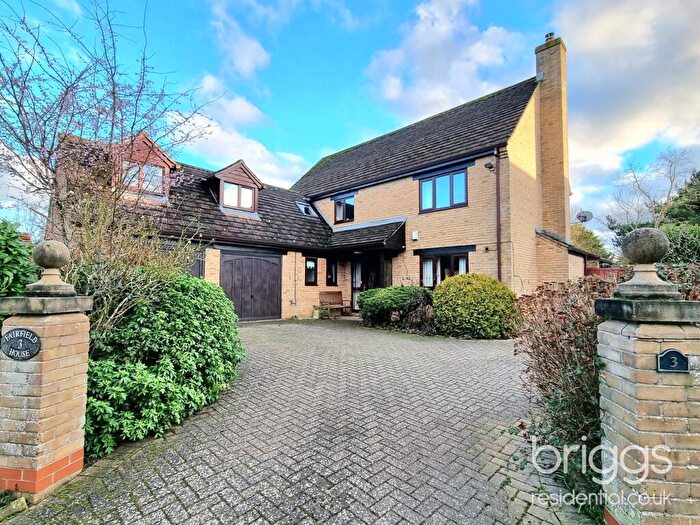
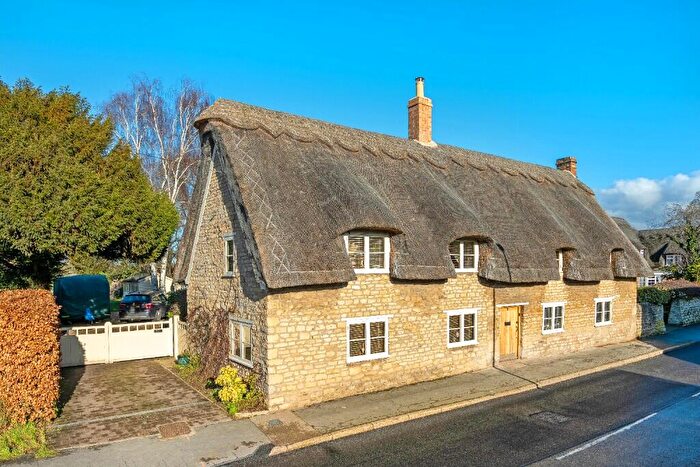
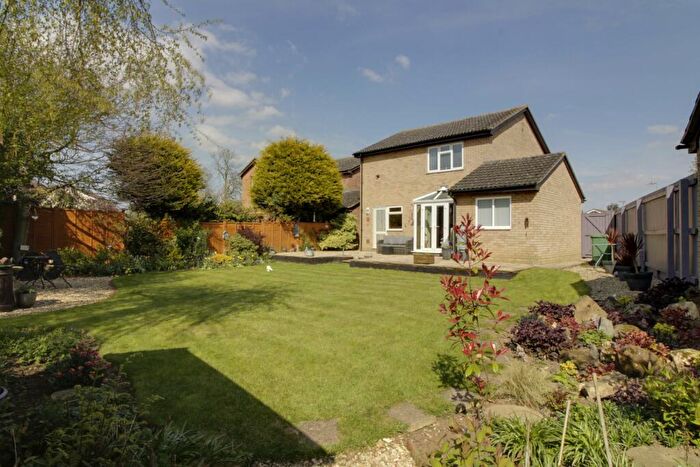
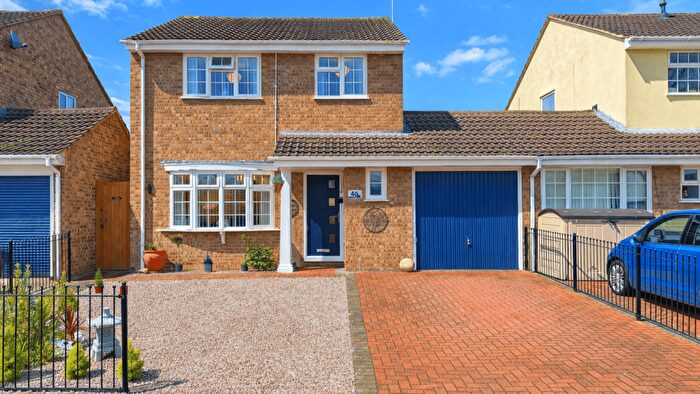
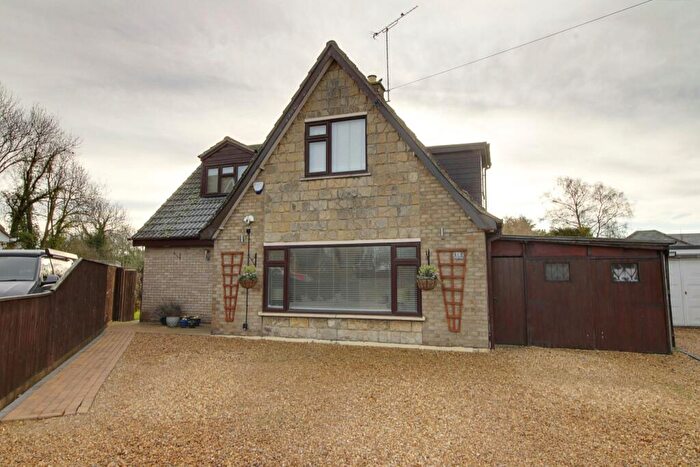
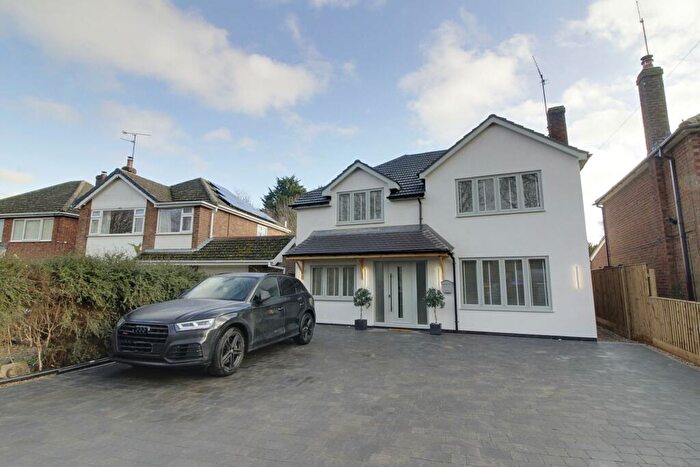
Houses for sale & to rent in Northborough, Peterborough
House Prices in Northborough
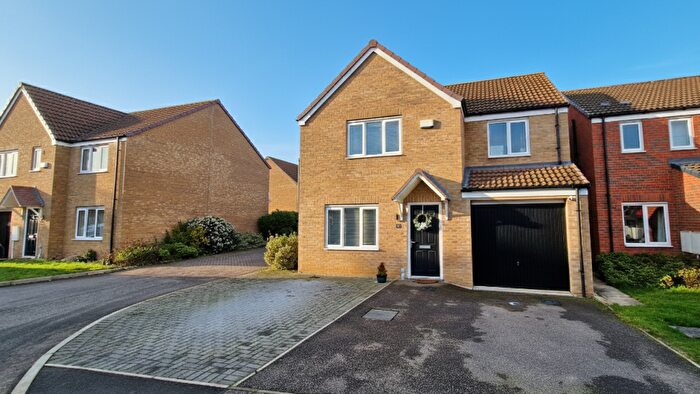
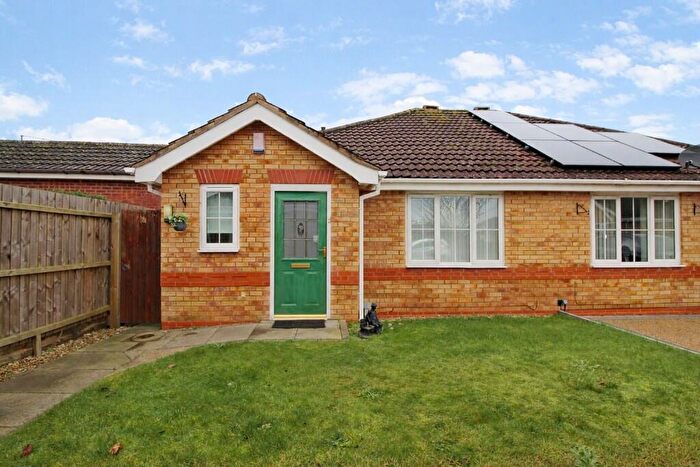
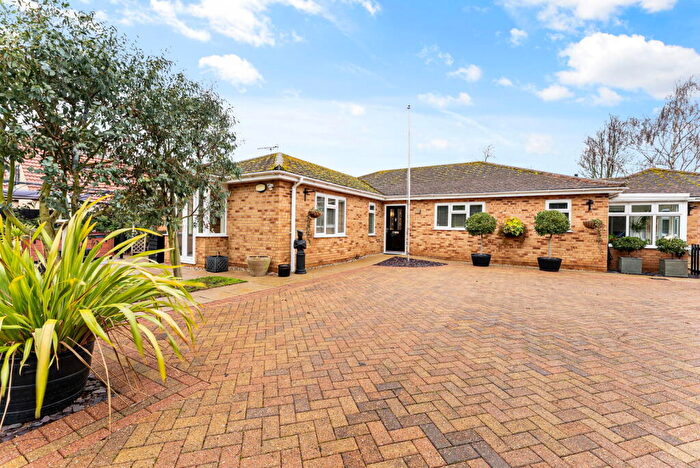
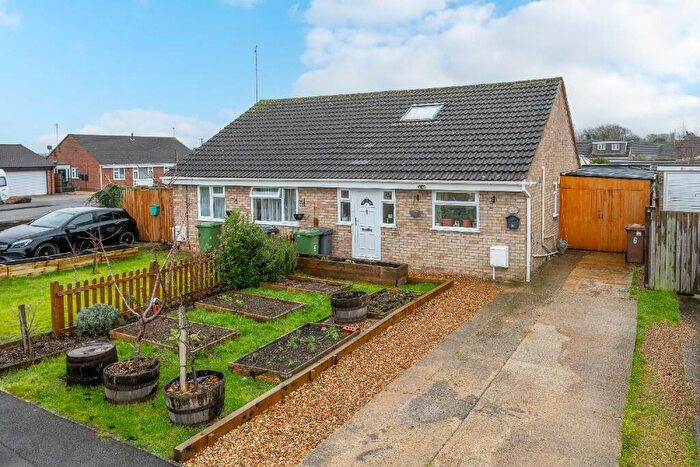
Properties in Northborough have an average house price of £406,924.00 and had 98 Property Transactions within the last 3 years¹.
Northborough is an area in Peterborough, City of Peterborough with 1,093 households², where the most expensive property was sold for £1,600,000.00.
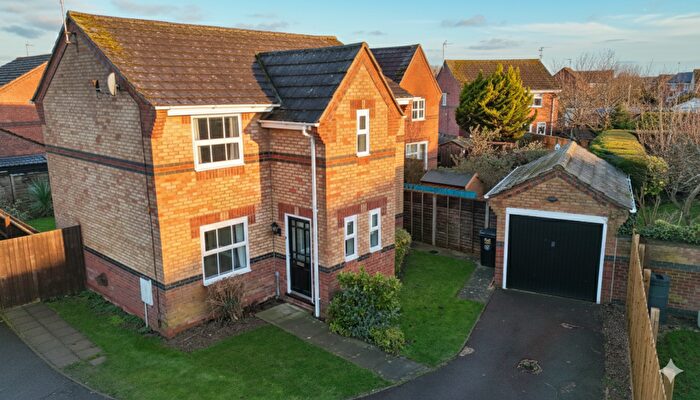
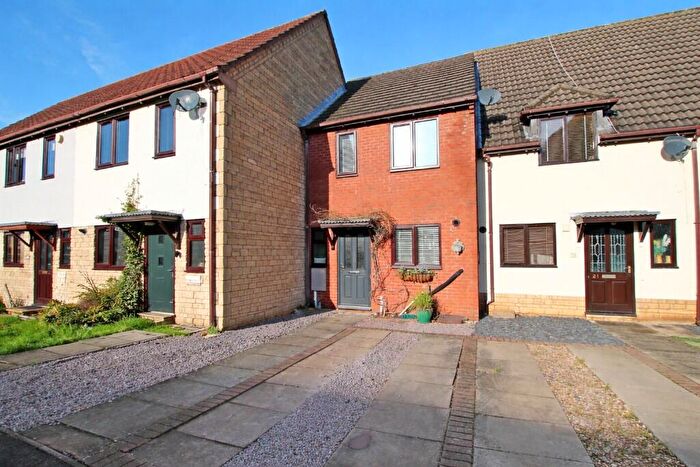
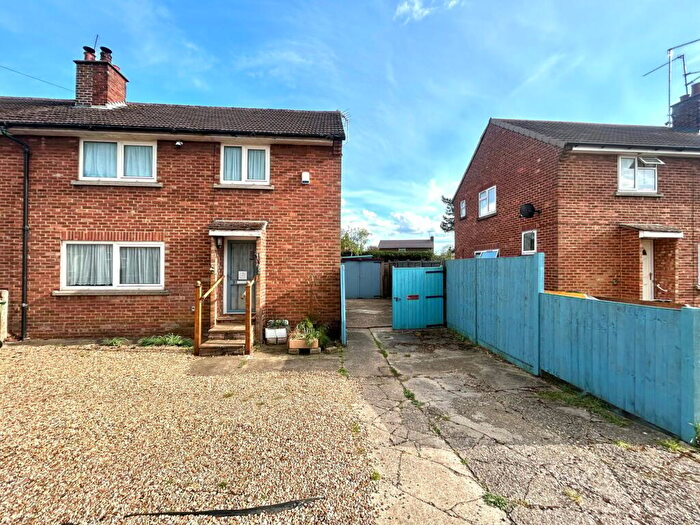
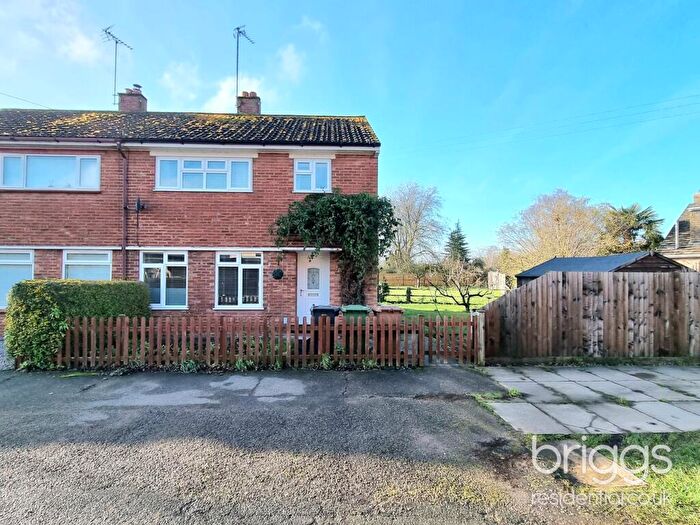
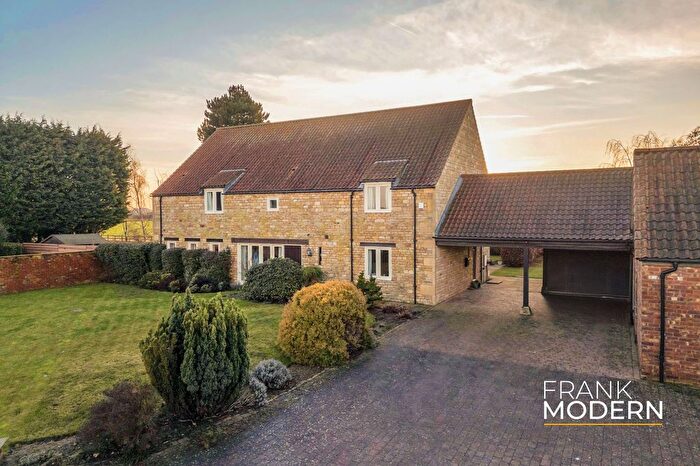
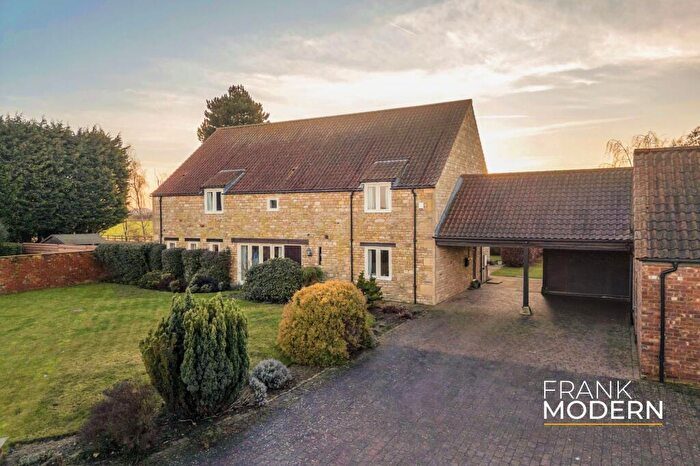
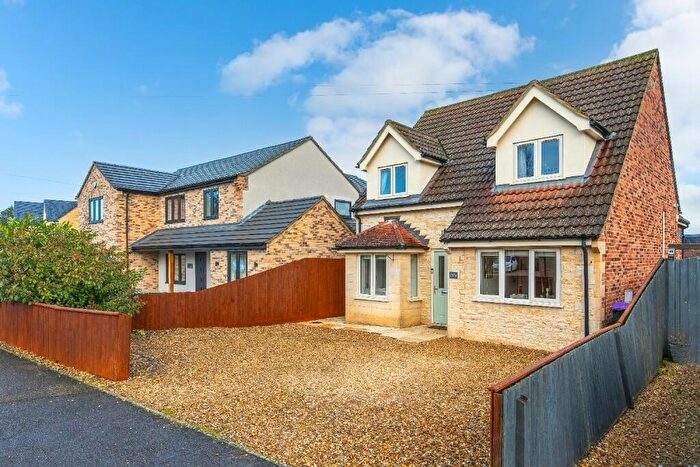
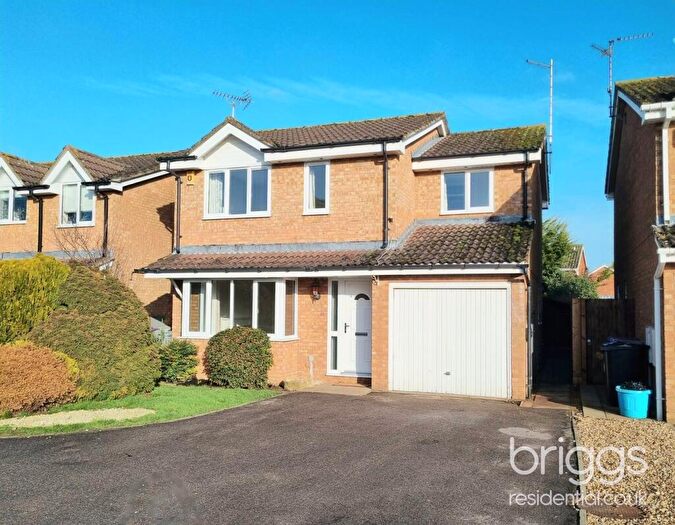
Properties for sale in Northborough
Roads and Postcodes in Northborough
Navigate through our locations to find the location of your next house in Northborough, Peterborough for sale or to rent.
| Streets | Postcodes |
|---|---|
| Arthurs Court | PE6 9HE |
| Ashfields | PE6 9AL |
| Barn Close | PE6 9EN |
| Castle Drive | PE6 9DG PE6 9DL |
| Castle End Road | PE6 9EP |
| Church Street | PE6 9BN |
| Church View | PE6 9DQ |
| Clare Road | PE6 9DN |
| Claypole Drive | PE6 9DW |
| Cromwell Close | PE6 9DP |
| Crowson Crescent | PE6 9DR |
| Deeping St James Road | PE6 9AF PE6 9AS PE6 9BG PE6 9BQ PE6 9BT |
| Edgson Villas | PE6 7DD |
| Fairfax Way | PE6 9AB |
| Garford Court | PE6 9ER |
| Granville Avenue | PE6 9DB PE6 9DE |
| Helpston Road | PE6 7DE |
| High Street | PE6 9EB PE6 9EE PE6 9EG PE6 9HN PE6 9HQ |
| Ladds Lane | PE6 9HD |
| Lincoln Road | PE6 9BA PE6 9BB PE6 9BH PE6 9BL |
| Main Road | PE6 7DA |
| Maxey Road | PE6 9BD |
| Maxey View | PE6 9BE |
| Maxhams Green Road | PE6 7HW |
| Mill Road | PE6 9EZ |
| Orchard Grove | PE6 9EY |
| Paradise Lane | PE6 9BS |
| Pasture Lane | PE6 9BP |
| Peakirk Road | PE6 9AD PE6 9AH |
| Perkins Lane | PE6 9HJ |
| Pingle Lane | PE6 9BW |
| Rectory Lane | PE6 7DB |
| Rippons Drove | PE6 9AG |
| Riverside | PE6 9AJ PE6 9AR |
| School Close | PE6 9EW |
| School Lane | PE6 9EL |
| St Andrews Road | PE6 9DJ |
| Suttons Lane | PE6 9AA |
| The Orchard | PE6 7FP |
| The Pingle | PE6 9BX |
| The Retreat | PE6 9ET |
| Torpel Way | PE6 9EQ |
| Tuckers Nook | PE6 9EH |
| West End Road | PE6 9EJ |
| Woodcroft | PE6 7HP |
| Woodgate Lane | PE6 9ED |
| PE6 9HF |
Transport near Northborough
- FAQ
- Price Paid By Year
- Property Type Price
Frequently asked questions about Northborough
What is the average price for a property for sale in Northborough?
The average price for a property for sale in Northborough is £406,924. This amount is 65% higher than the average price in Peterborough. There are 1,170 property listings for sale in Northborough.
What streets have the most expensive properties for sale in Northborough?
The streets with the most expensive properties for sale in Northborough are Pasture Lane at an average of £1,600,000, Garford Court at an average of £900,000 and Torpel Way at an average of £750,000.
What streets have the most affordable properties for sale in Northborough?
The streets with the most affordable properties for sale in Northborough are Crowson Crescent at an average of £212,000, Clare Road at an average of £255,000 and Granville Avenue at an average of £263,079.
Which train stations are available in or near Northborough?
Some of the train stations available in or near Northborough are Peterborough, Stamford and Spalding.
Property Price Paid in Northborough by Year
The average sold property price by year was:
| Year | Average Sold Price | Price Change |
Sold Properties
|
|---|---|---|---|
| 2025 | £380,772 | -20% |
22 Properties |
| 2024 | £456,346 | 25% |
48 Properties |
| 2023 | £342,750 | -41% |
28 Properties |
| 2022 | £483,651 | 23% |
33 Properties |
| 2021 | £370,295 | 9% |
59 Properties |
| 2020 | £337,513 | 1% |
36 Properties |
| 2019 | £334,089 | -6% |
46 Properties |
| 2018 | £353,178 | 7% |
42 Properties |
| 2017 | £327,990 | -1% |
54 Properties |
| 2016 | £331,385 | 15% |
31 Properties |
| 2015 | £283,063 | -2% |
41 Properties |
| 2014 | £289,844 | 22% |
55 Properties |
| 2013 | £226,297 | -11% |
38 Properties |
| 2012 | £250,869 | 3% |
39 Properties |
| 2011 | £244,476 | -14% |
41 Properties |
| 2010 | £278,697 | 8% |
25 Properties |
| 2009 | £257,425 | -14% |
30 Properties |
| 2008 | £292,523 | 12% |
21 Properties |
| 2007 | £257,278 | -6% |
48 Properties |
| 2006 | £272,295 | 25% |
53 Properties |
| 2005 | £204,621 | -15% |
45 Properties |
| 2004 | £235,626 | 26% |
59 Properties |
| 2003 | £173,594 | 8% |
62 Properties |
| 2002 | £159,497 | 19% |
51 Properties |
| 2001 | £129,371 | -3% |
50 Properties |
| 2000 | £133,158 | 29% |
52 Properties |
| 1999 | £94,193 | -4% |
67 Properties |
| 1998 | £97,823 | 8% |
49 Properties |
| 1997 | £89,656 | 1% |
75 Properties |
| 1996 | £89,108 | 22% |
56 Properties |
| 1995 | £69,468 | - |
35 Properties |
Property Price per Property Type in Northborough
Here you can find historic sold price data in order to help with your property search.
The average Property Paid Price for specific property types in the last three years are:
| Property Type | Average Sold Price | Sold Properties |
|---|---|---|
| Semi Detached House | £279,275.00 | 38 Semi Detached Houses |
| Detached House | £503,353.00 | 57 Detached Houses |
| Terraced House | £191,666.00 | 3 Terraced Houses |

