
Houses for sale & to rent in City of Plymouth, England
House Prices in City of Plymouth
Properties in City of Plymouth have
an average house price of
£235k
and had 11,425 Property Transactions
within the last 3 years.¹
City of Plymouth is a location in
England with
108,220 households², where the most expensive property was sold for £1.35M.
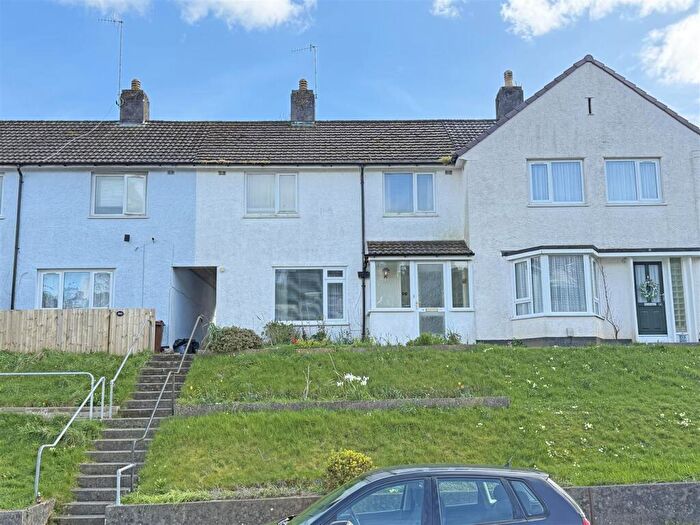
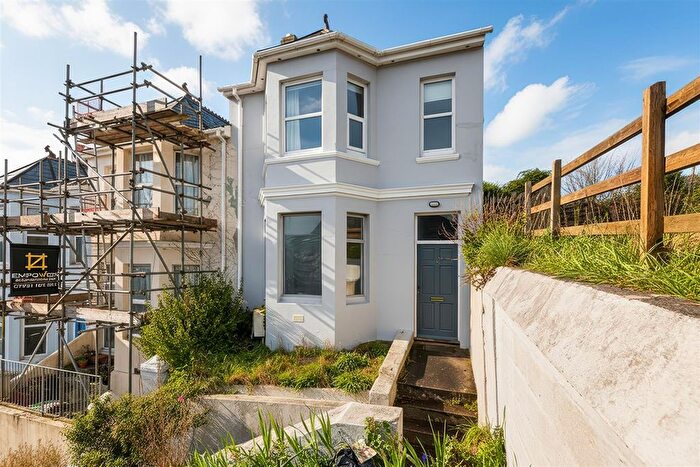
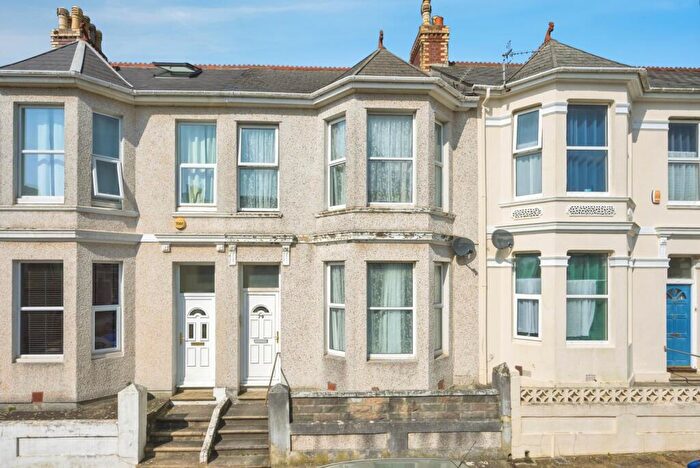
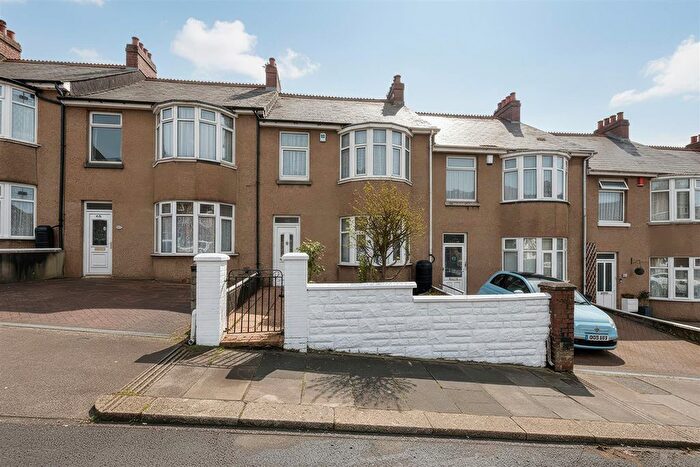
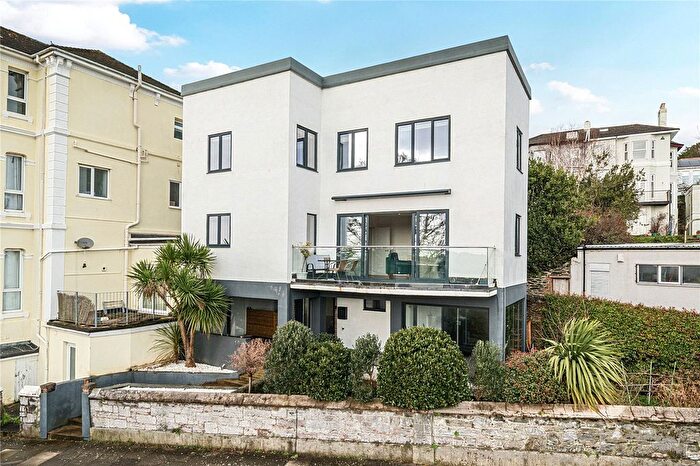
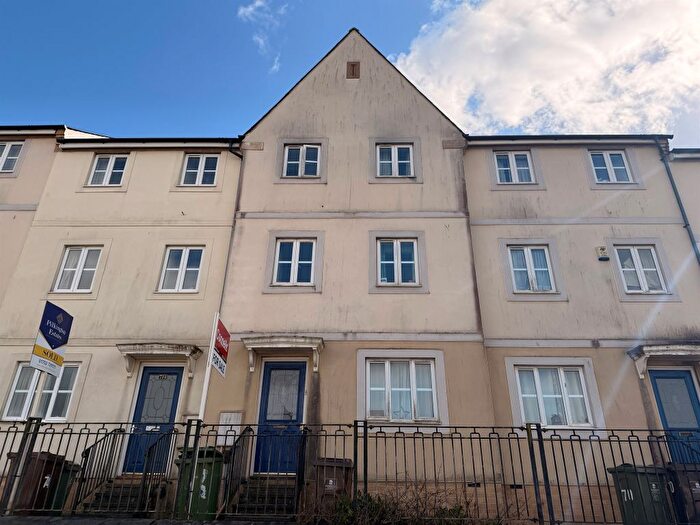
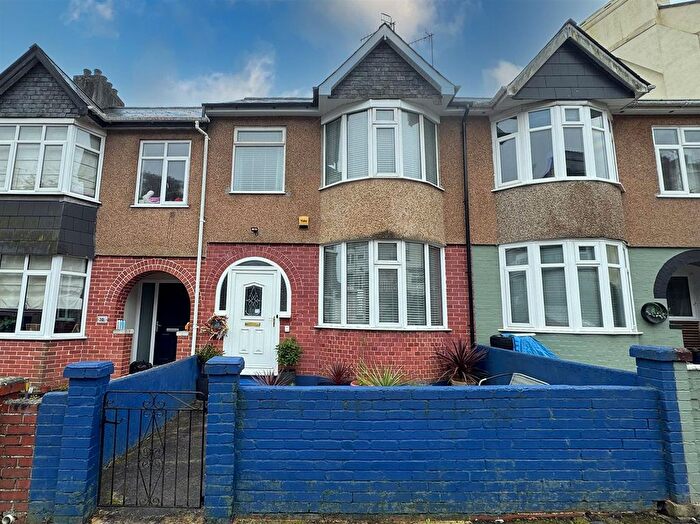
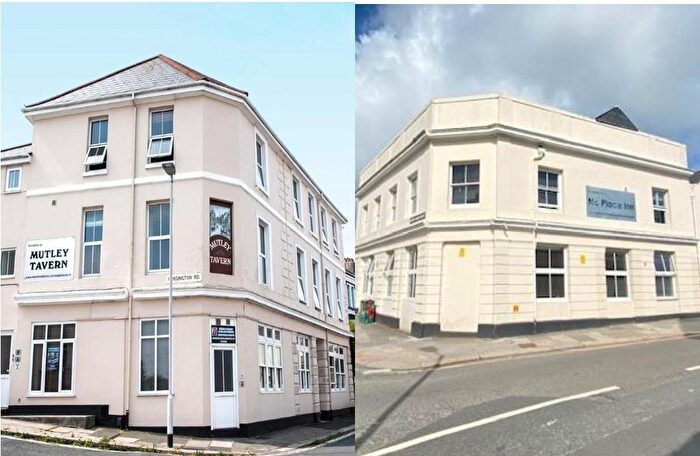
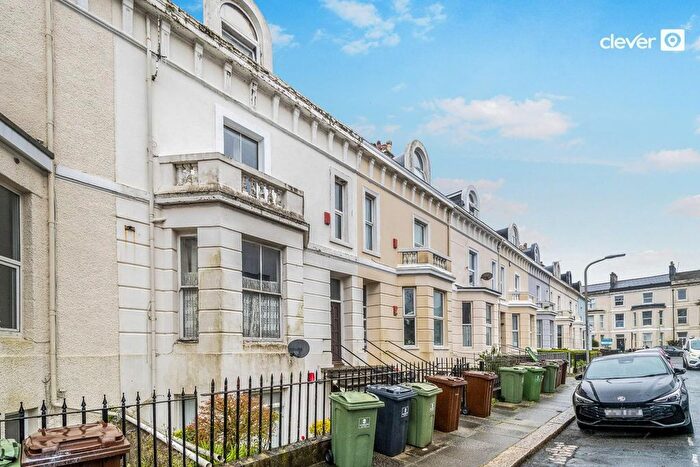
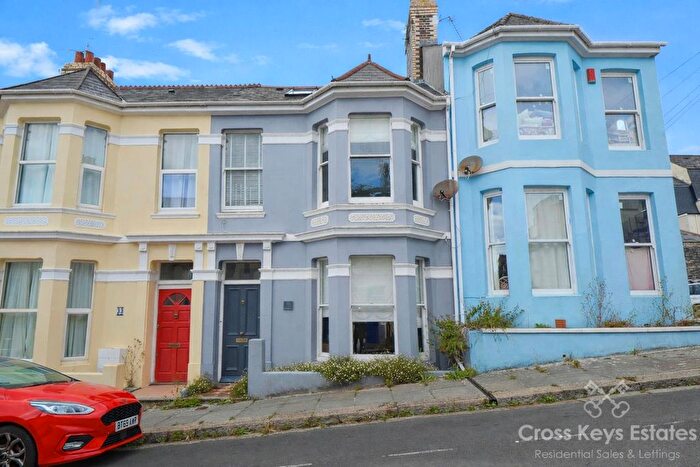
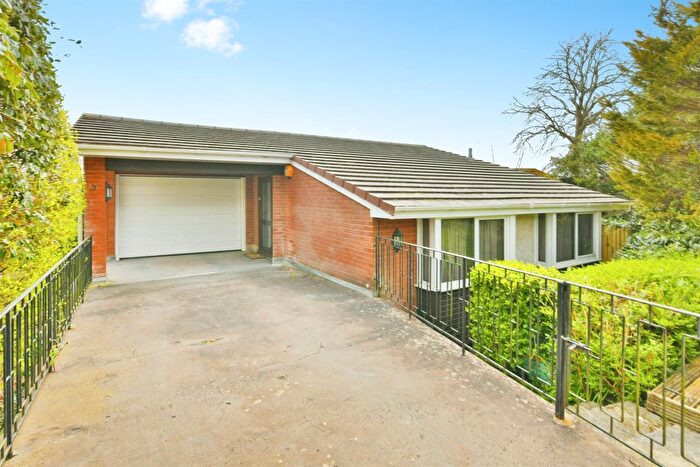
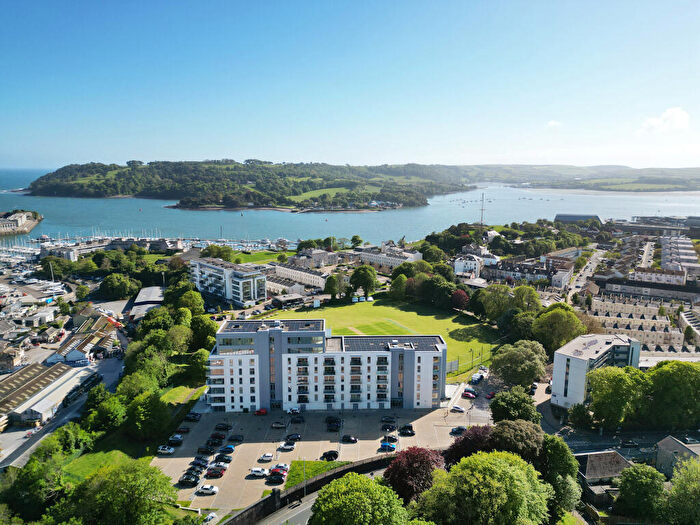
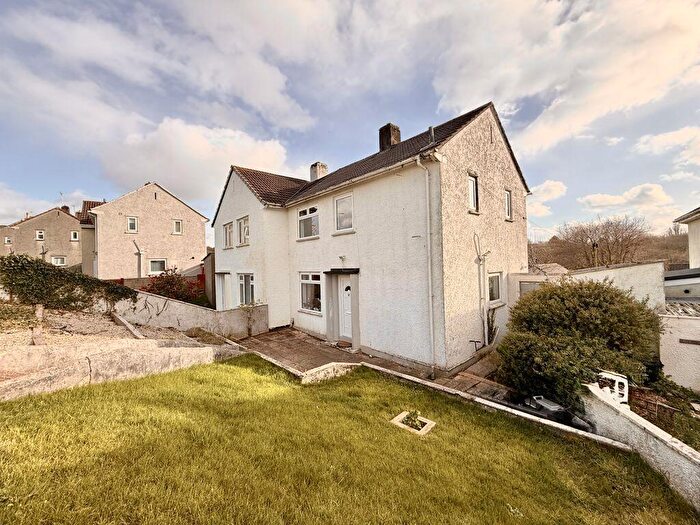
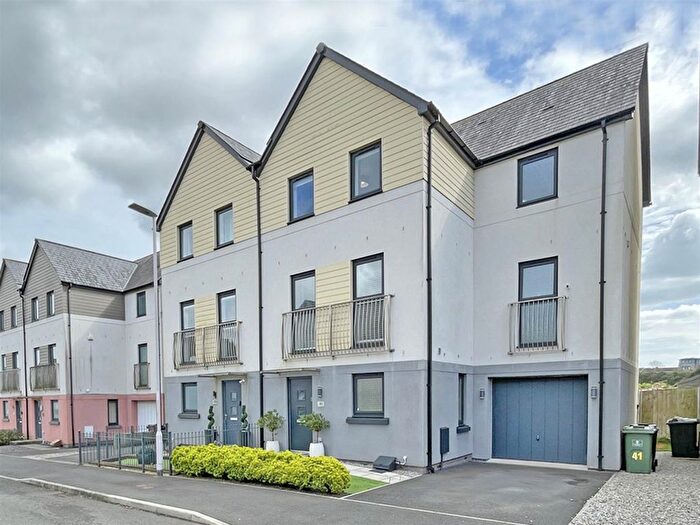
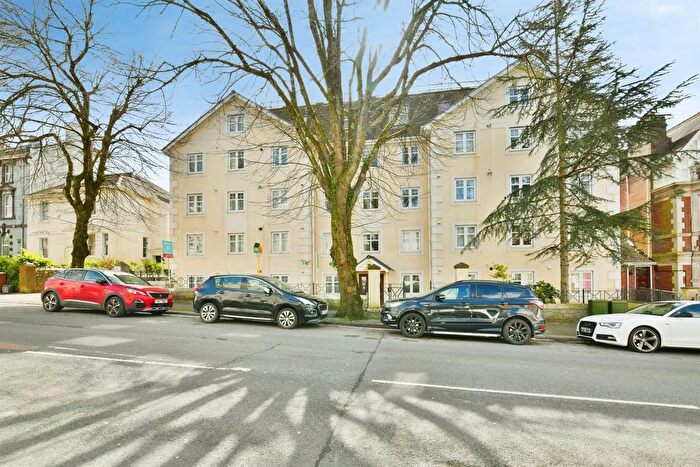
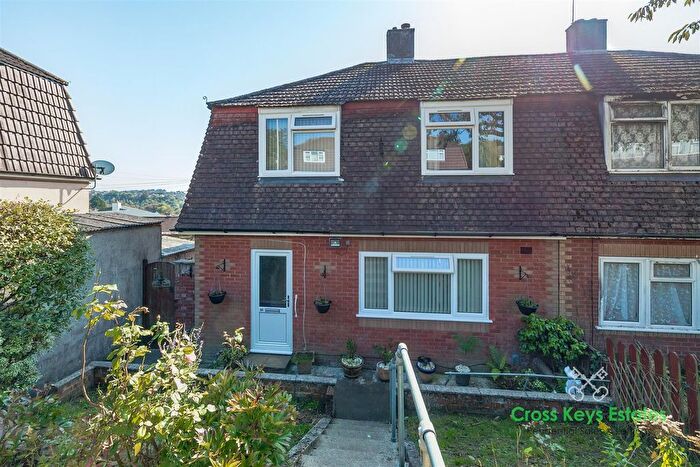
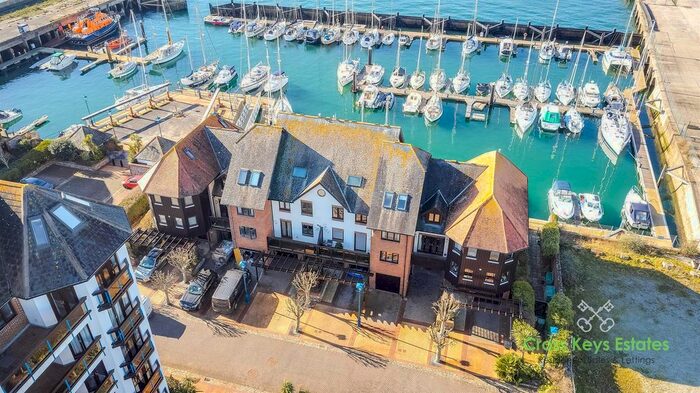
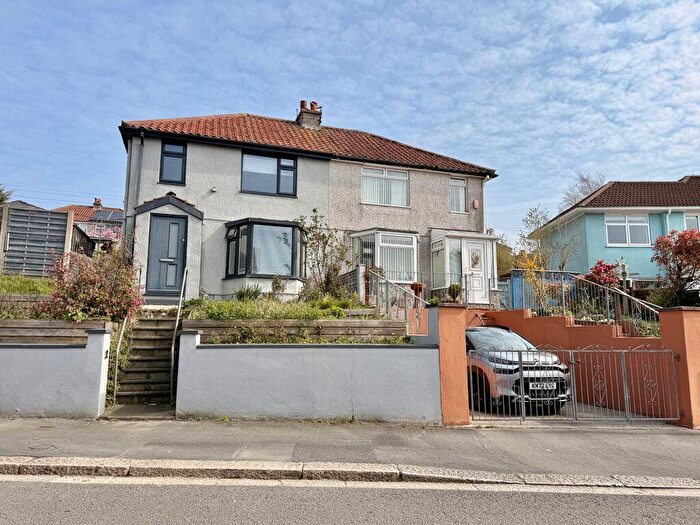
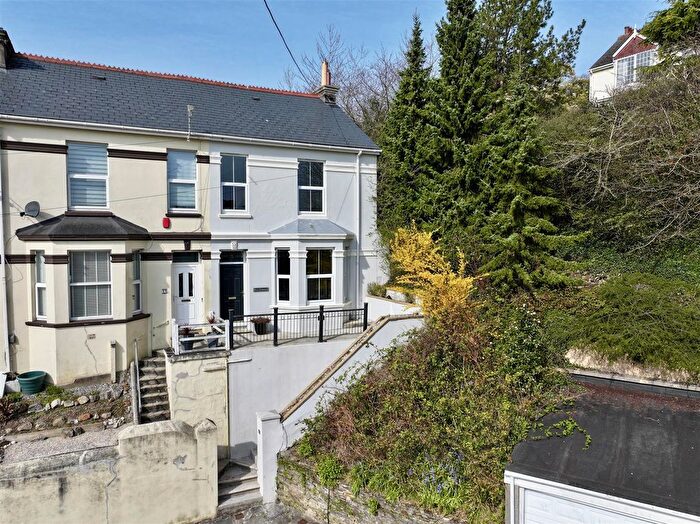
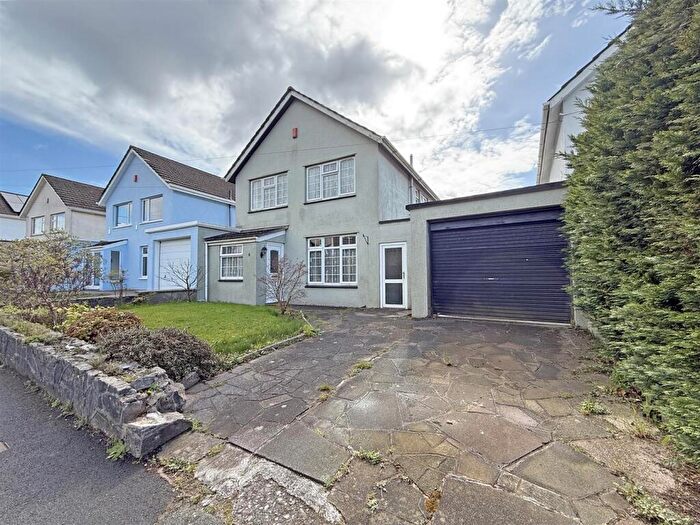
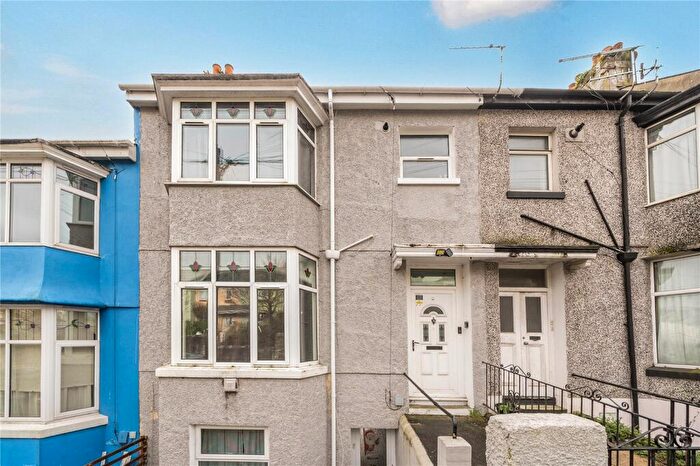
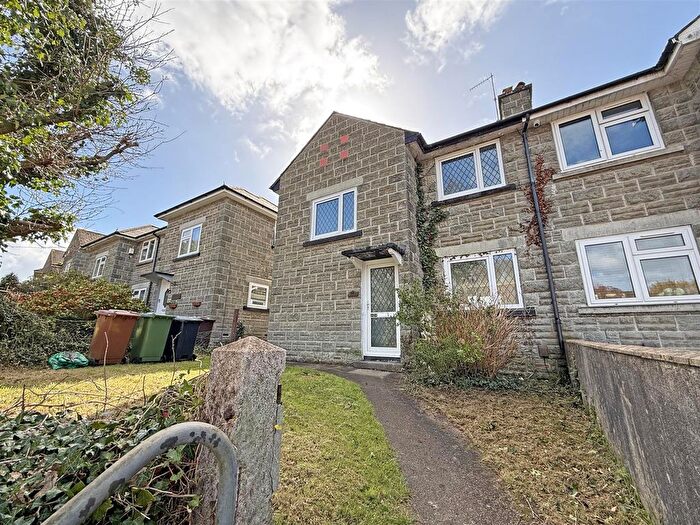
Properties for sale in City of Plymouth
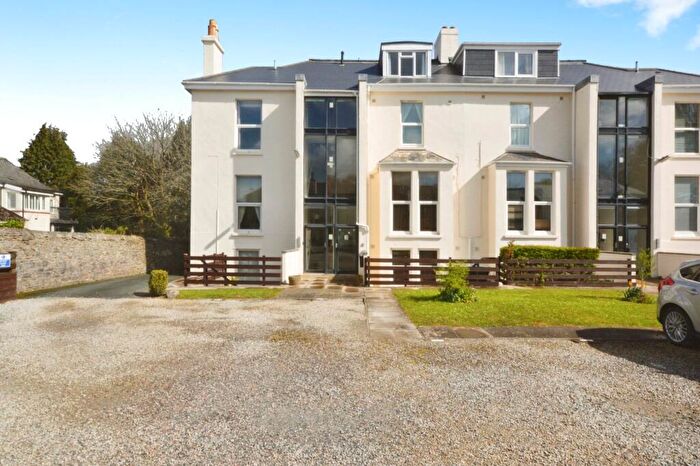
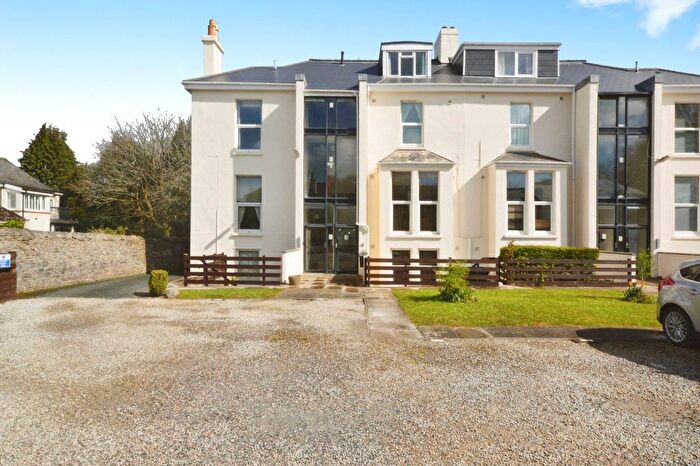
![]()
If you are looking to sell your house, let it out, or receive a property valuation, an expert can help you.
Click the button below to get started.
Towns in City of Plymouth
Navigate through our locations to find the location of your next house in City of Plymouth, England for sale or to rent.
Transport in City of Plymouth
Please see below transportation links in this area:
-
 Plymouth Station
 -
Devonport Station
-
Dockyard Station
-
Keyham Station
-
St.Budeaux Ferry Road Station
-
St.Budeaux Victoria Road Station
- FAQ
- Price Paid By Year
- Property Type Price
Frequently asked questions about City of Plymouth
What is the average price for a property for sale in City of Plymouth?
The average price for a property for sale in City of Plymouth is £234,980. This amount is 35% lower than the average price in England. There are more than 10,000 property listings for sale in City of Plymouth.
Which train stations are available in or near City of Plymouth?
Some of the train stations available in or near City of Plymouth are Plymouth, Devonport and Dockyard.
Property Price Paid in City of Plymouth by Year
The average sold property price by year was:
| Year | Average Sold Price | Price Change |
Sold Properties
|
|---|---|---|---|
| 2026 | £242,085 | 1% |
90 Properties |
| 2025 | £240,607 | 2% |
3,570 Properties |
| 2024 | £235,236 | 3% |
4,052 Properties |
| 2023 | £229,118 | -1% |
3,713 Properties |
| 2022 | £230,920 | 6% |
4,623 Properties |
| 2021 | £216,167 | 4% |
5,002 Properties |
| 2020 | £207,147 | 4% |
3,755 Properties |
| 2019 | £198,247 | 2% |
4,623 Properties |
| 2018 | £194,895 | 5% |
4,684 Properties |
| 2017 | £185,986 | 3% |
4,745 Properties |
| 2016 | £179,773 | 2% |
4,850 Properties |
| 2015 | £175,916 | 3% |
4,755 Properties |
| 2014 | £169,897 | 6% |
4,506 Properties |
| 2013 | £160,052 | 1% |
3,666 Properties |
| 2012 | £158,745 | 2% |
3,136 Properties |
| 2011 | £155,577 | -3% |
3,111 Properties |
| 2010 | £160,079 | 4% |
3,200 Properties |
| 2009 | £153,194 | -2% |
3,148 Properties |
| 2008 | £156,523 | -7% |
3,152 Properties |
| 2007 | £166,842 | 6% |
5,792 Properties |
| 2006 | £156,302 | 7% |
6,572 Properties |
| 2005 | £146,098 | 9% |
5,334 Properties |
| 2004 | £132,802 | 18% |
5,841 Properties |
| 2003 | £109,035 | 14% |
6,069 Properties |
| 2002 | £93,320 | 20% |
6,183 Properties |
| 2001 | £74,820 | 14% |
6,208 Properties |
| 2000 | £64,191 | 11% |
5,759 Properties |
| 1999 | £57,243 | 5% |
5,581 Properties |
| 1998 | £54,175 | 2% |
4,588 Properties |
| 1997 | £53,318 | 8% |
4,703 Properties |
| 1996 | £49,311 | 2% |
4,137 Properties |
| 1995 | £48,144 | - |
3,361 Properties |
Property Price per Property Type in City of Plymouth
Here you can find historic sold price data in order to help with your property search.
The average Property Paid Price for specific property types in the last three years are:
| Property Type | Average Sold Price | Sold Properties |
|---|---|---|
| Semi Detached House | £261,057.00 | 3,016 Semi Detached Houses |
| Terraced House | £219,598.00 | 4,960 Terraced Houses |
| Detached House | £405,102.00 | 1,179 Detached Houses |
| Flat | £145,585.00 | 2,270 Flats |