
Houses for sale in Torbay, England
House Prices in Torbay
Properties in Torbay have
an average house price of
£275k
and had 6,670 Property Transactions
within the last 3 years.¹
Torbay is a location in
England with
63,007 households², where the most expensive property was sold for £3.11M.
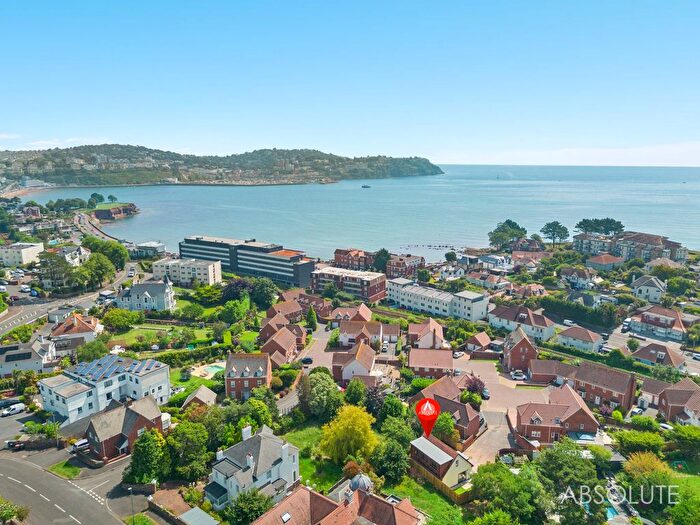
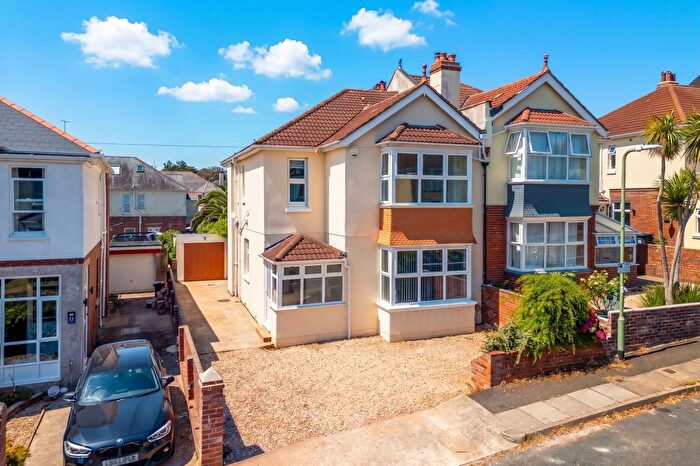
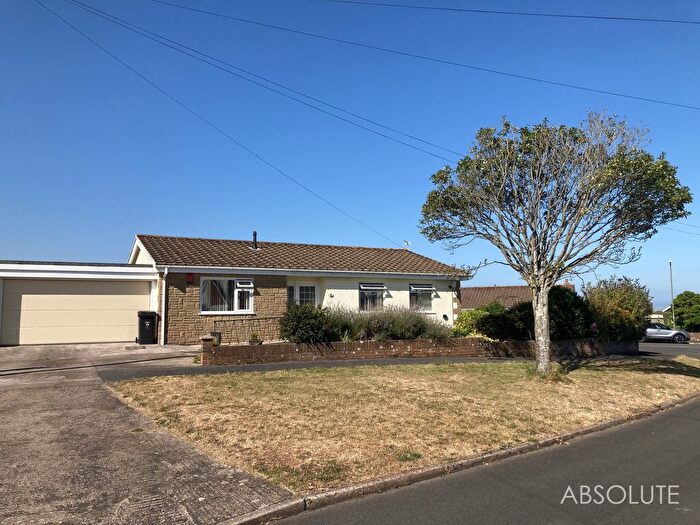
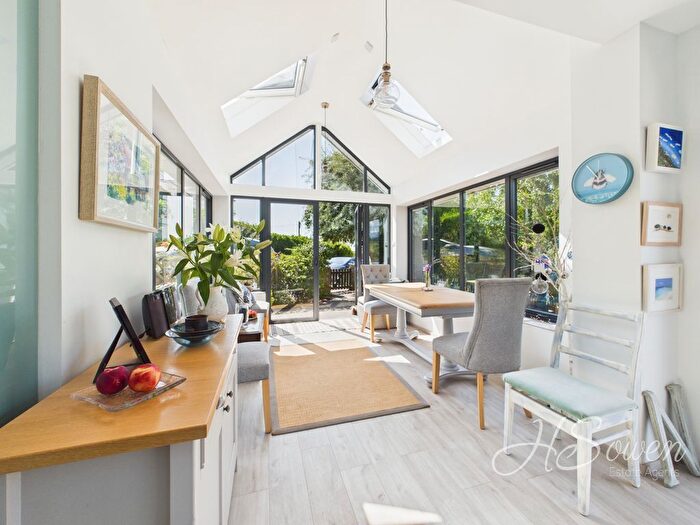
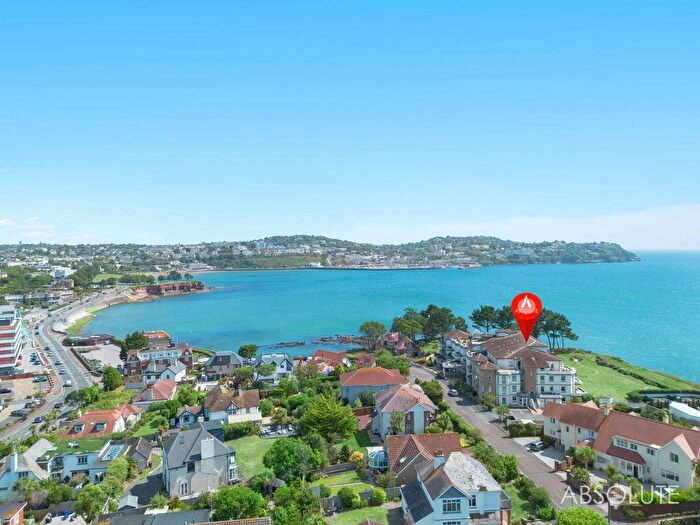
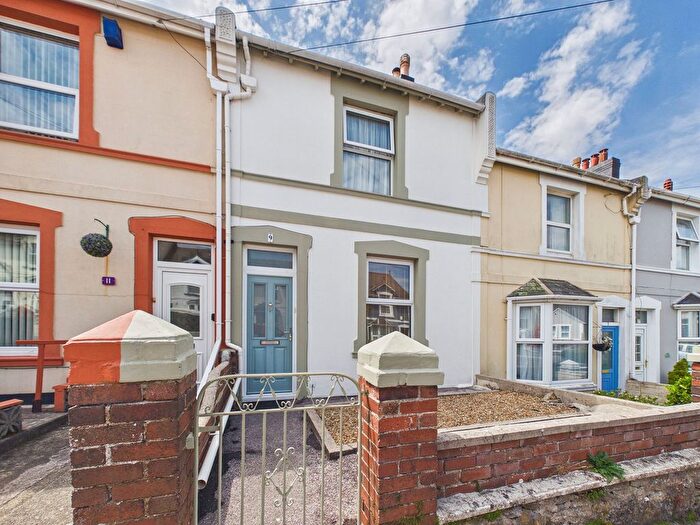
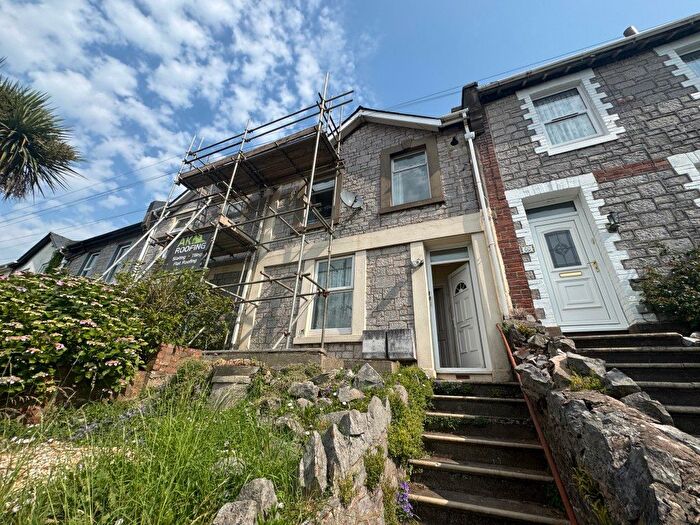
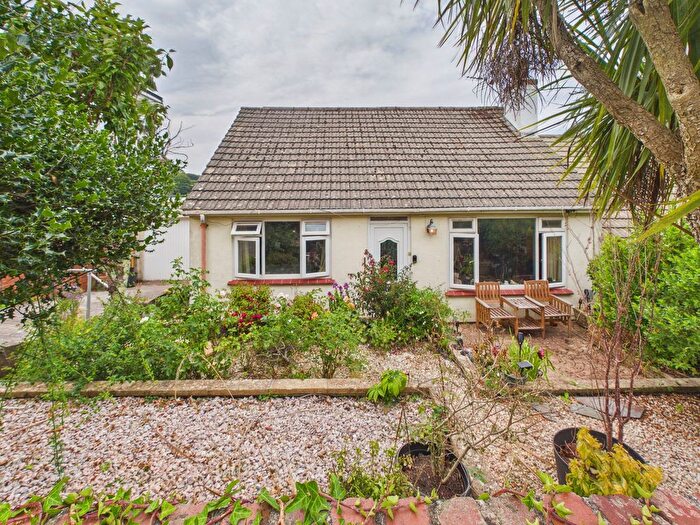
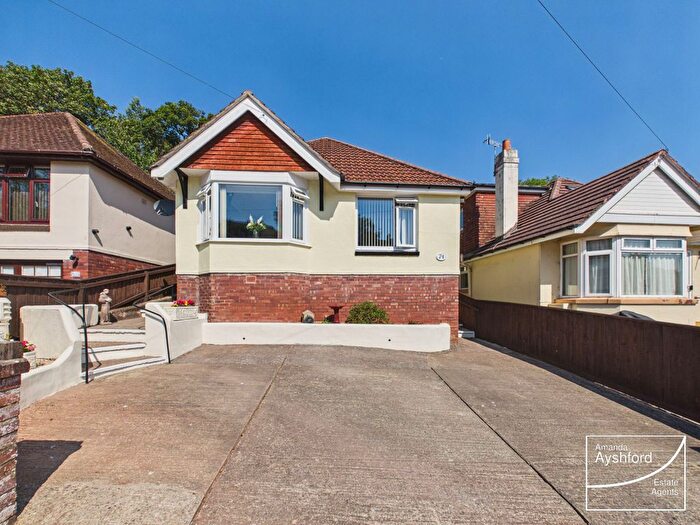
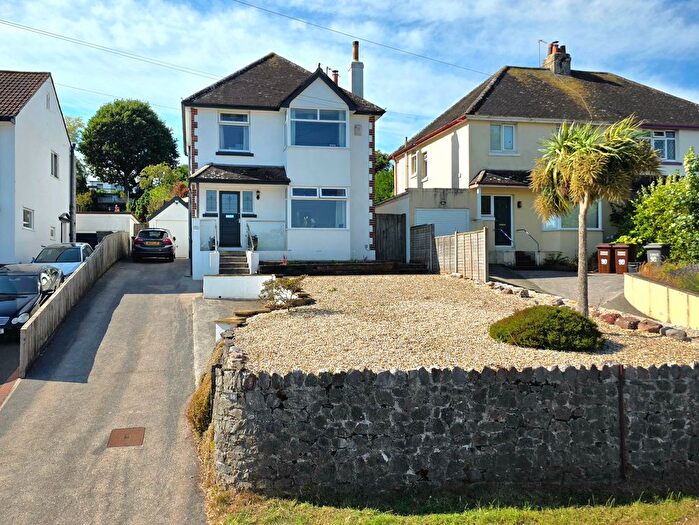
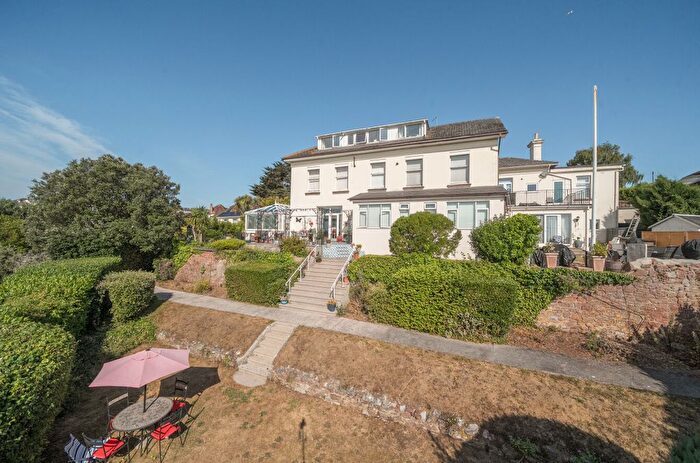
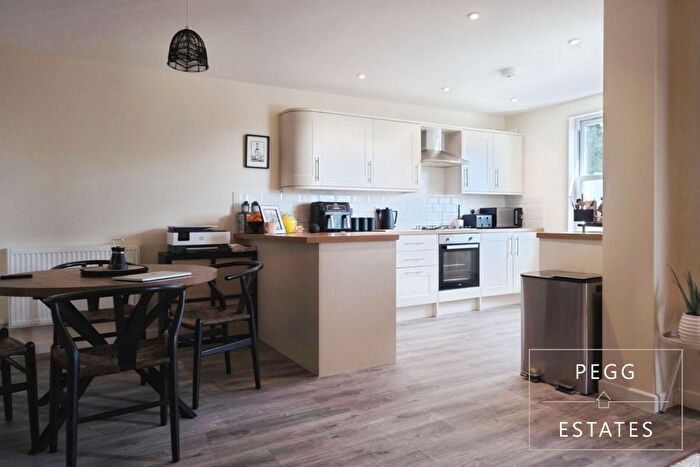
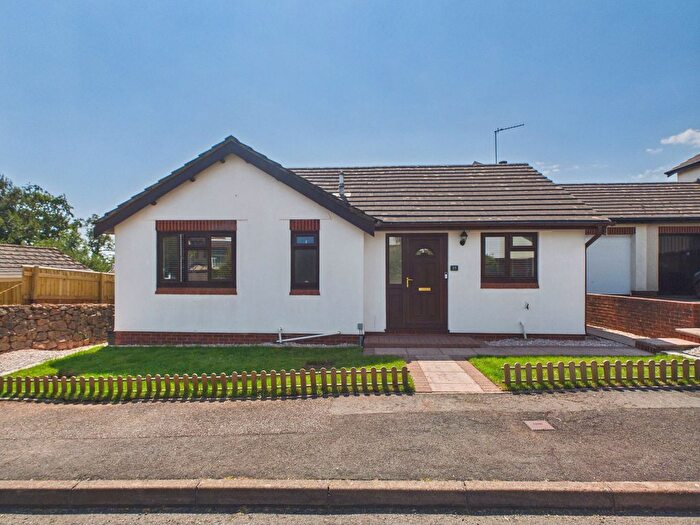
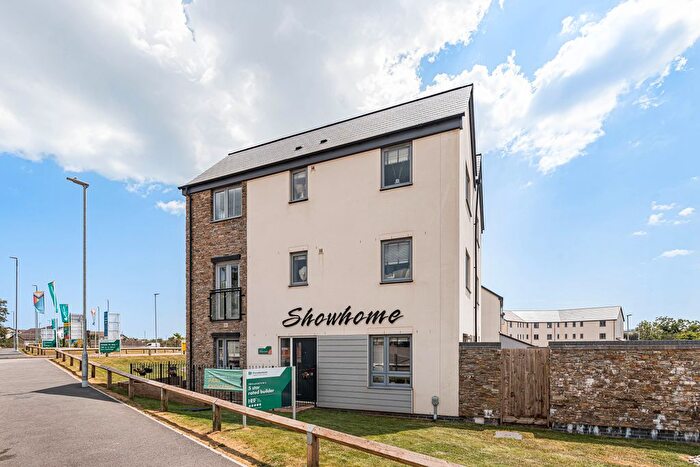
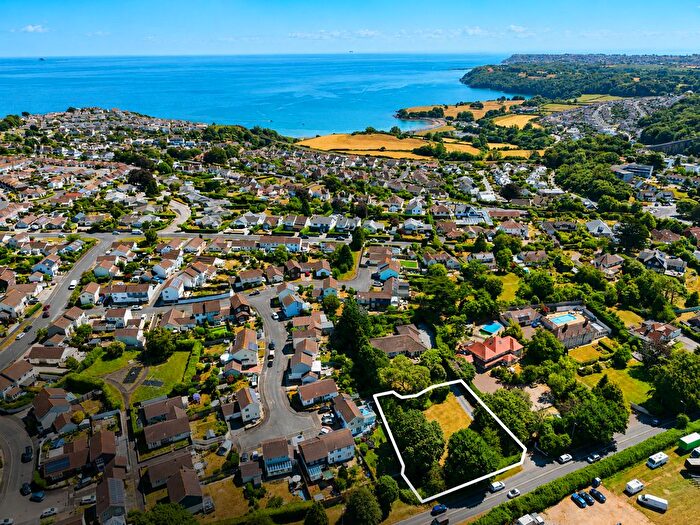
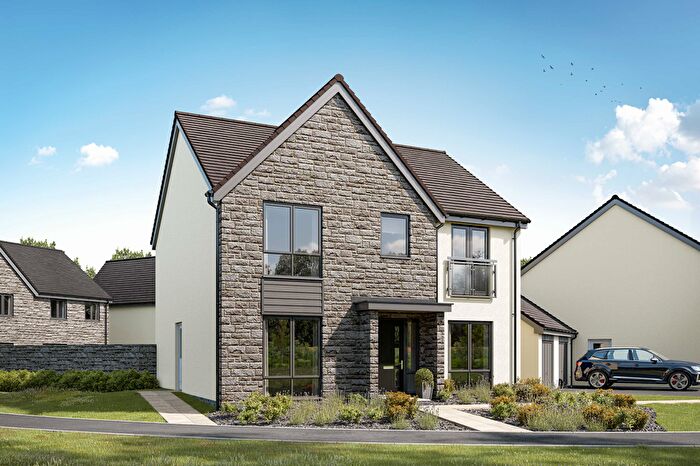
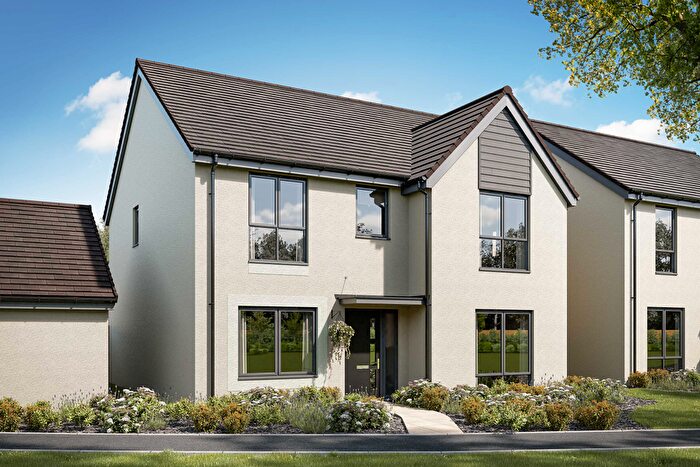
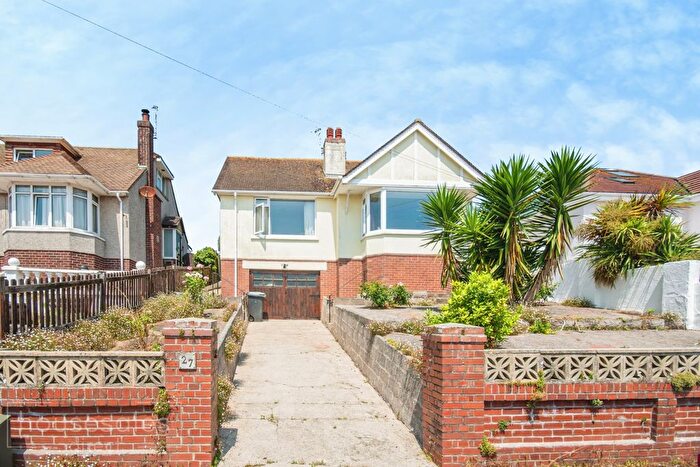
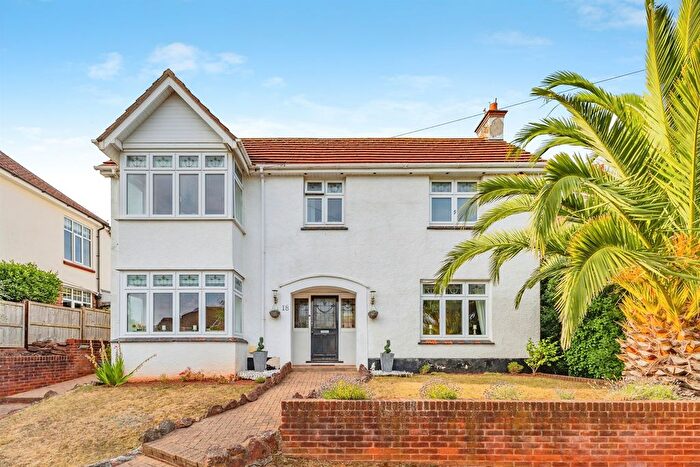
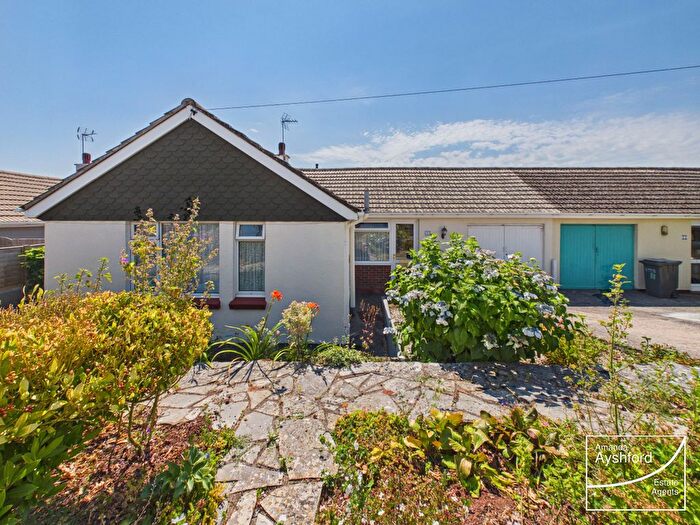
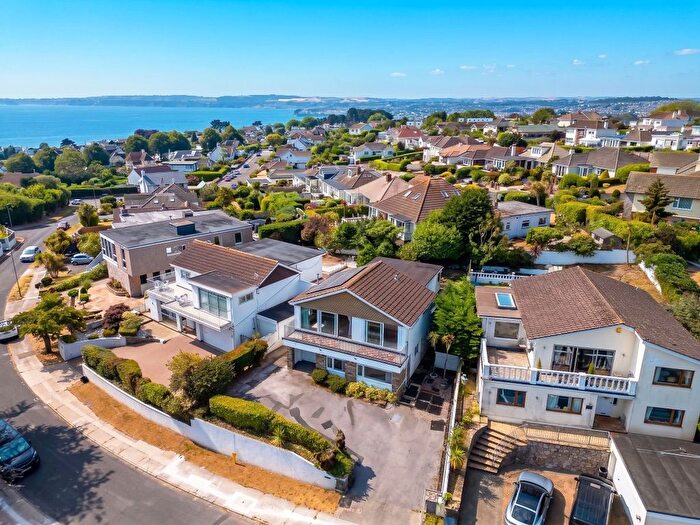
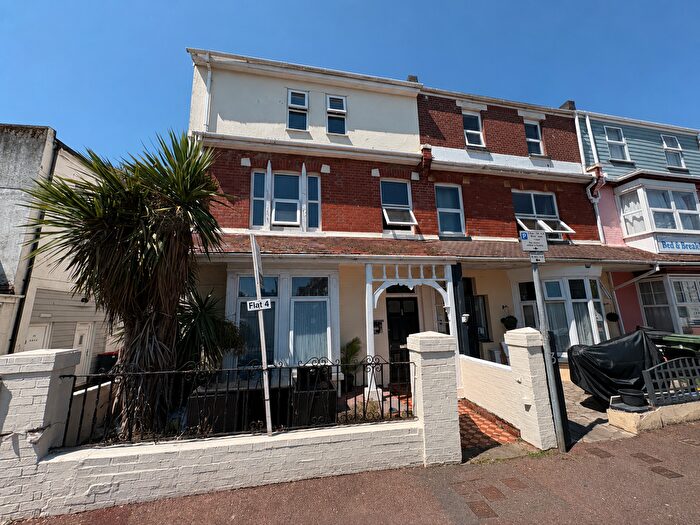
Properties for sale in Torbay
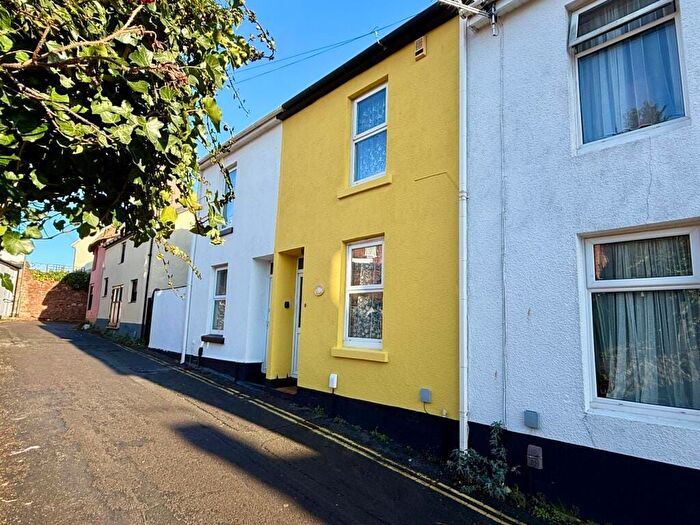
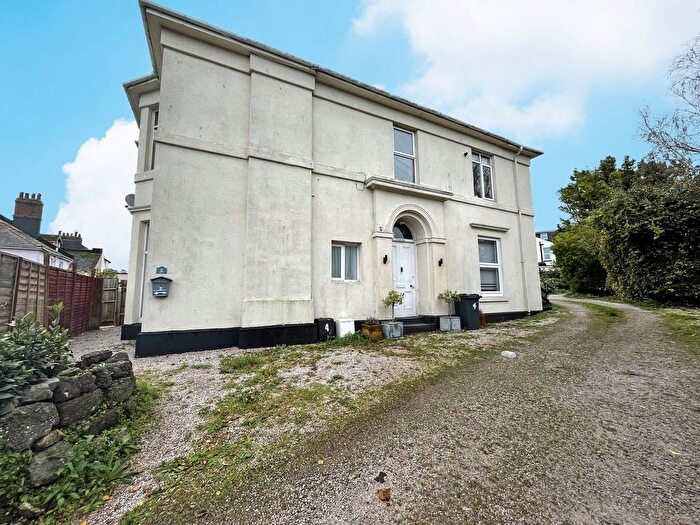
![]()
If you are looking to sell your house, let it out, or receive a property valuation, an expert can help you.
Click the button below to get started.
Towns in Torbay
Navigate through our locations to find the location of your next house in Torbay, England for sale or to rent.
Property price trends in Torbay
According to the latest Land Registry data, the average home in Torbay sold for £259,102 in 2026. That figure comes from a substantial record of 95,373 sales logged over the past 31 years.
Prices have fallen back over the last three years. Compared with 2023, when the typical sale came in around £281,139, that's a fall of roughly 7.8%.
Looking back five years, average prices are down about 2.3% since 2021, a drop of around £6,068 in cash terms.
Zoom out to the past decade for the fuller picture. Back in 2016, homes here averaged £207,569, so the typical sold price has climbed about 24.8% since then, roughly 2.2% a year. Stretch the view to fifteen years and that annual pace holds at about 2.4%.
Frequently asked questions about Torbay
What is the average price for a property for sale in Torbay?
The average price for a property for sale in Torbay is £275,161. This amount is 23% lower than the average price in England. There are more than 10,000 property listings for sale in Torbay.
What locations have the most expensive properties for sale in Torbay?
The locations with the most expensive properties for sale in Torbay are Brixham at an average of £328,128 and Paignton at an average of £267,868.
What locations have the most affordable properties for sale in Torbay?
The location with the most affordable properties for sale in Torbay is Torquay at an average of £266,279.
Which train stations are available in or near Torbay?
Some of the train stations available in or near Torbay are Torquay, Paignton and Torre.
Property Price Paid in Torbay by Year
The average sold property price by year was:
| Year | Average Sold Price | Price Change |
Sold Properties
|
|---|---|---|---|
| 2026 | £259,102 | -5% |
427 Properties |
| 2025 | £271,894 | -2% |
2,153 Properties |
| 2024 | £276,271 | -2% |
2,169 Properties |
| 2023 | £281,139 | -0,1% |
1,921 Properties |
| 2022 | £281,358 | 6% |
2,755 Properties |
| 2021 | £265,170 | 11% |
3,535 Properties |
| 2020 | £237,063 | 6% |
2,324 Properties |
| 2019 | £222,853 | 3% |
2,887 Properties |
| 2018 | £217,076 | 0,2% |
3,006 Properties |
| 2017 | £216,723 | 4% |
3,304 Properties |
Property Price per Property Type in Torbay
Here you can find historic sold price data in order to help with your property search.
The average Property Paid Price for specific property types in the last three years are:
| Property Type | Average Sold Price | Sold Properties |
|---|---|---|
| Semi Detached House | £286,271.00 | 1,462 Semi Detached Houses |
| Terraced House | £234,219.00 | 1,977 Terraced Houses |
| Detached House | £455,325.00 | 1,429 Detached Houses |
| Flat | £168,195.00 | 1,802 Flats |
Transport in Torbay
Please see below transportation links in this area:
