
Houses for sale & to rent in PL5 4LF, Coombe Lane, Southway, Plymouth
House Prices in PL5 4LF, Coombe Lane, Southway
Properties in PL5 4LF have no sales history available within the last 3 years. PL5 4LF is a postcode in Coombe Lane located in Southway, an area in Plymouth, City of Plymouth, with 4 households².
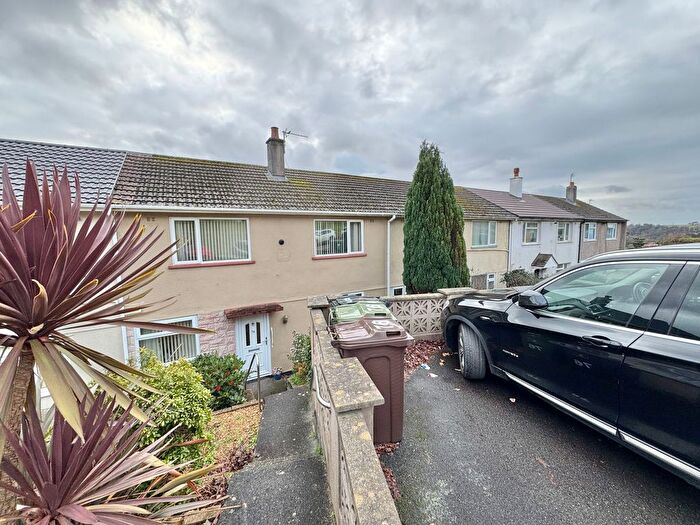
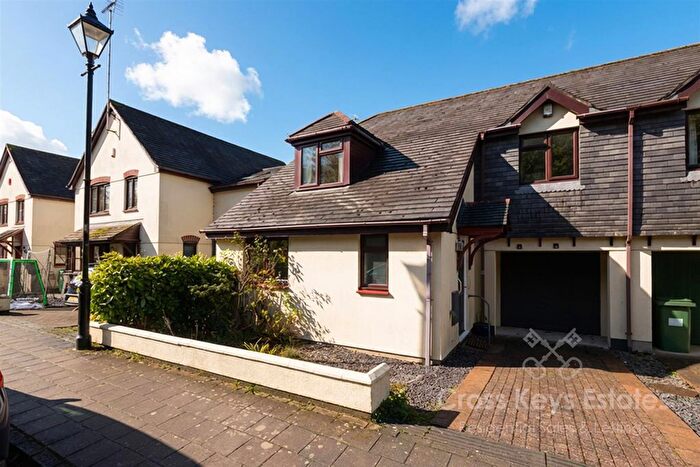
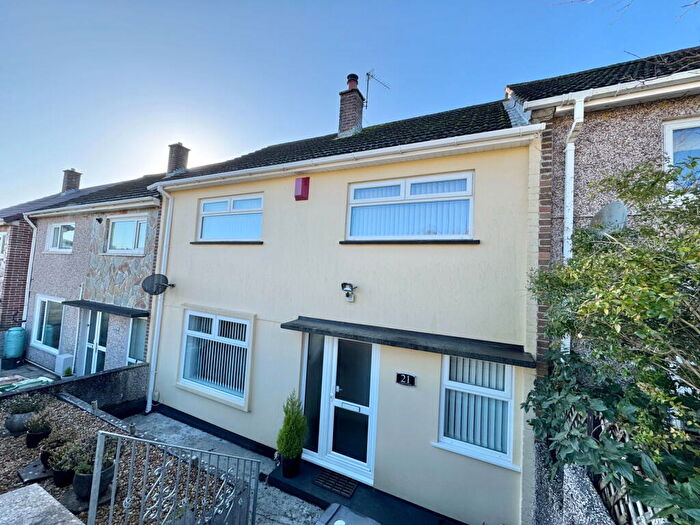
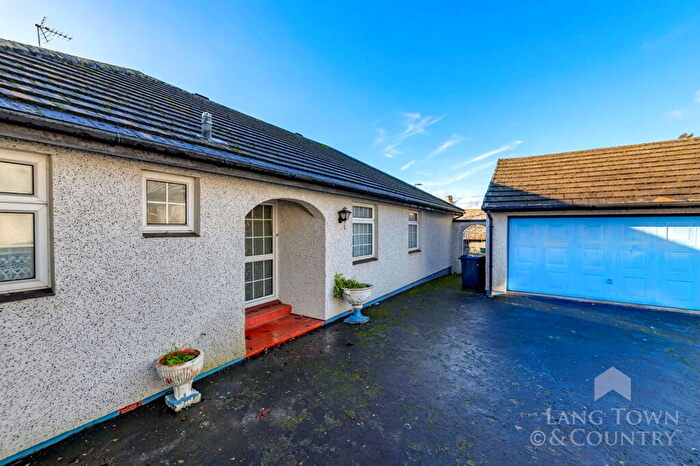
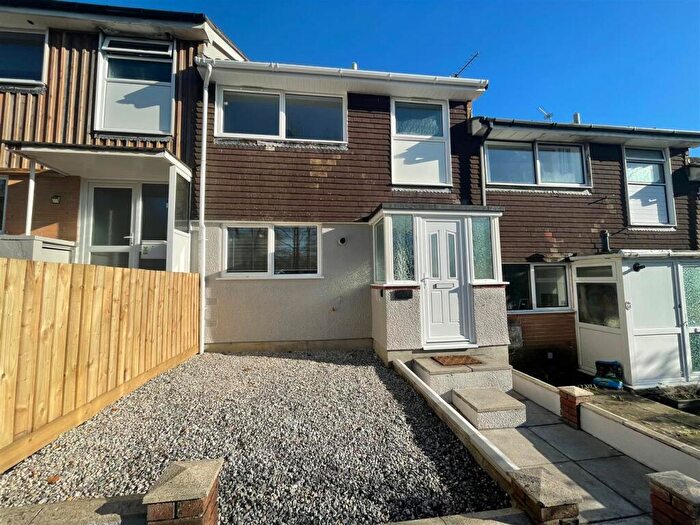
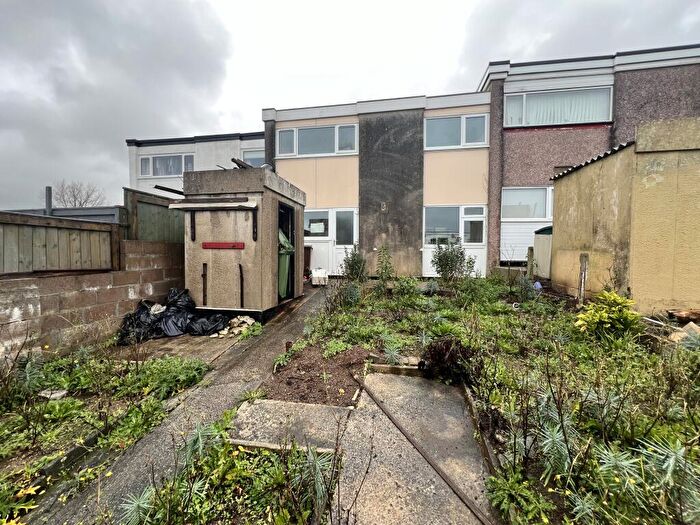
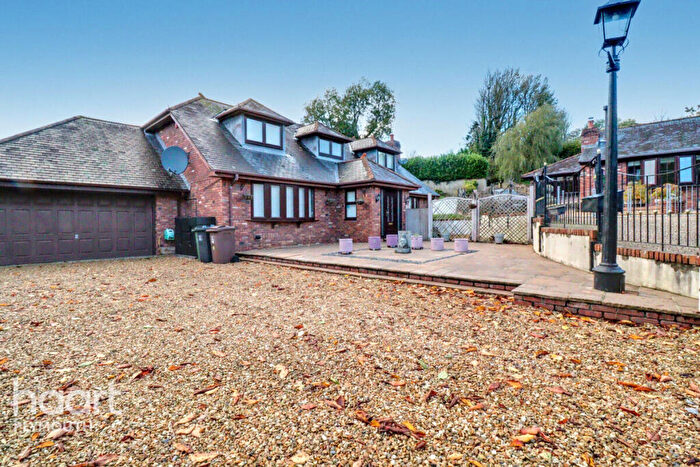
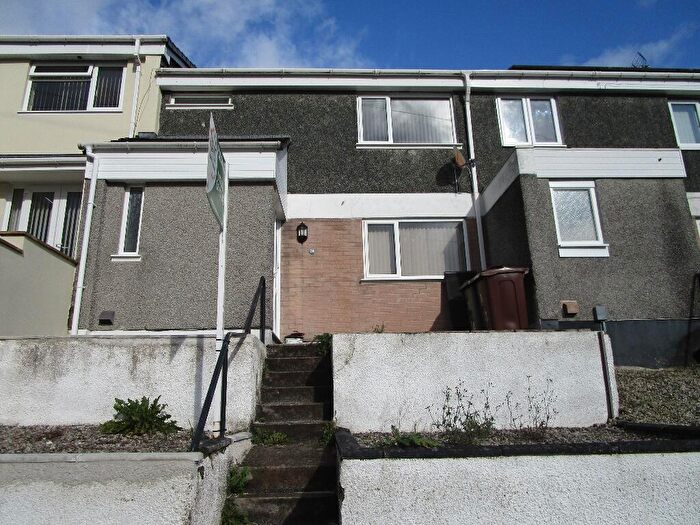
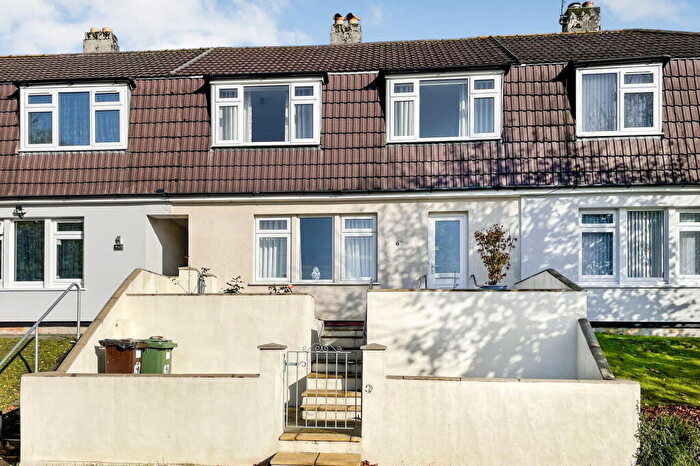
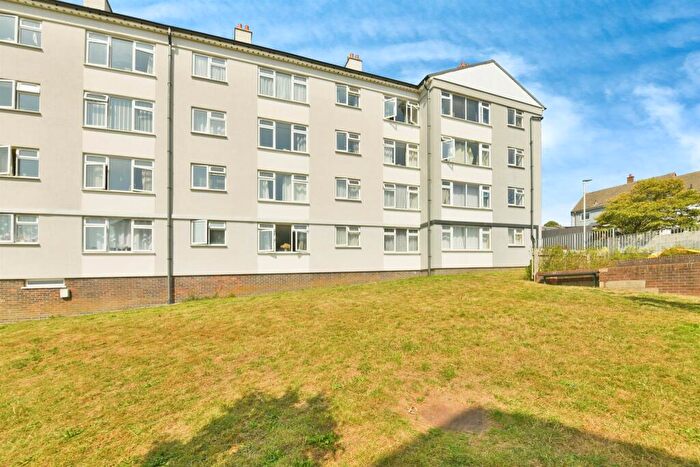
Properties for sale near PL5 4LF, Coombe Lane
![]()
If you are looking to sell your house, let it out, or receive a property valuation, an expert can help you.
Click the button below to get started.
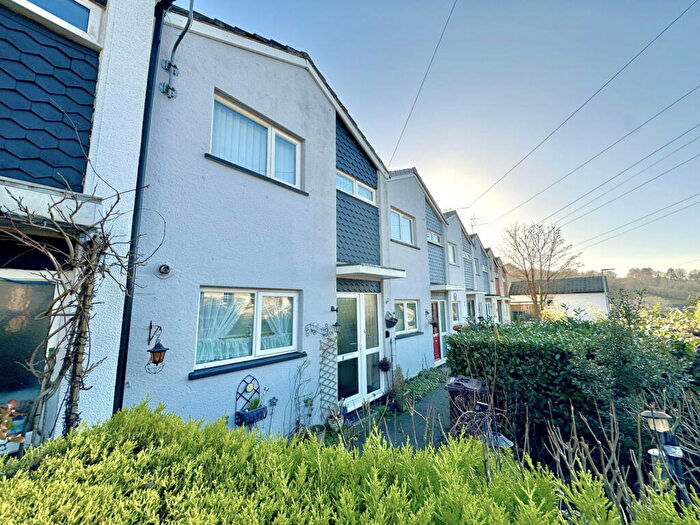
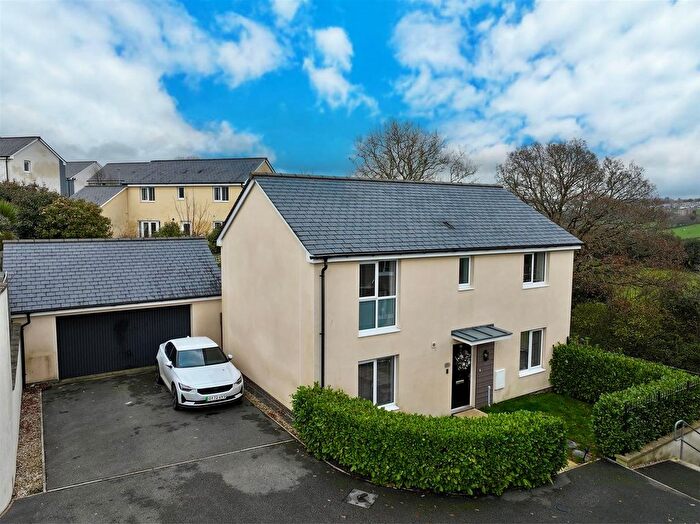
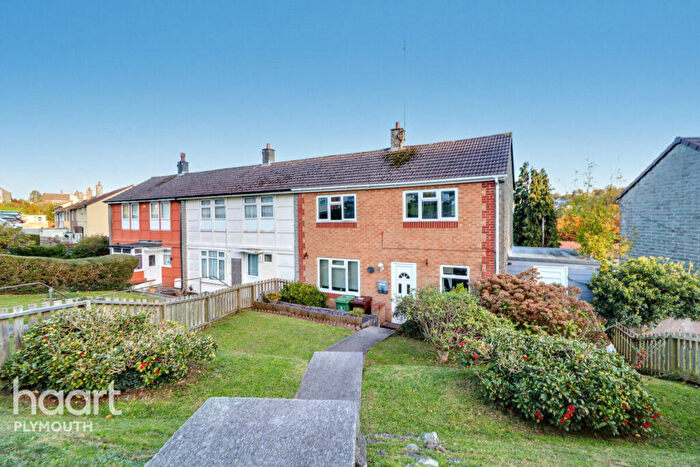

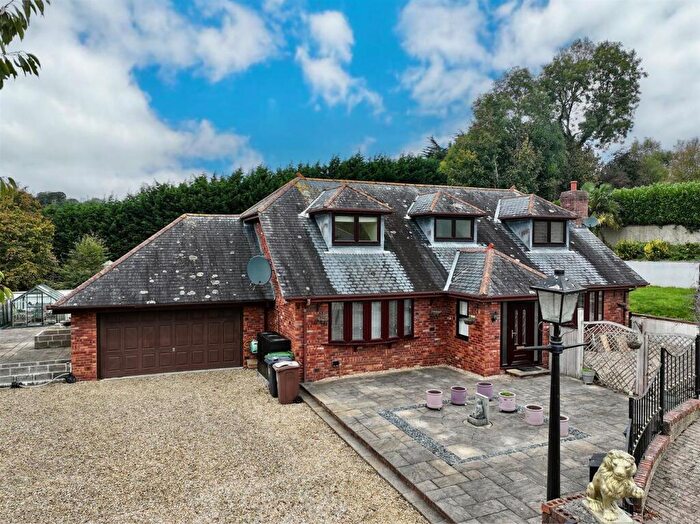
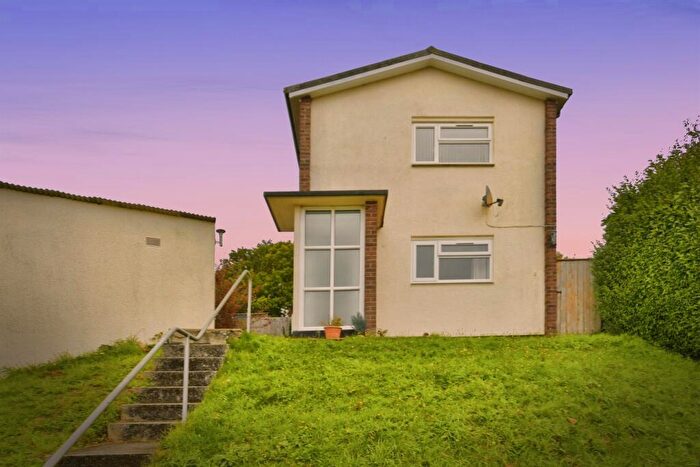
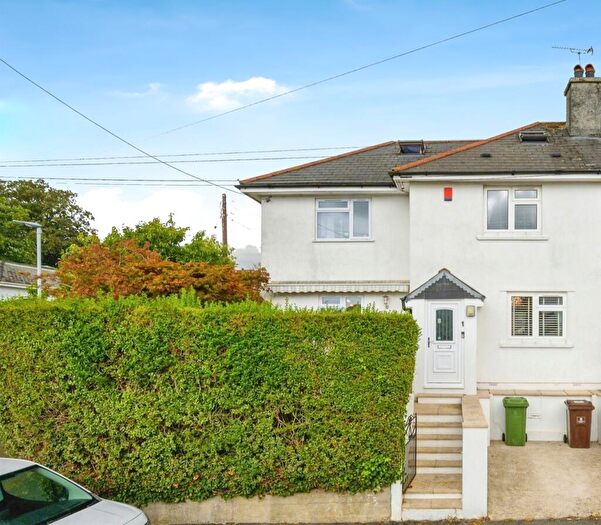
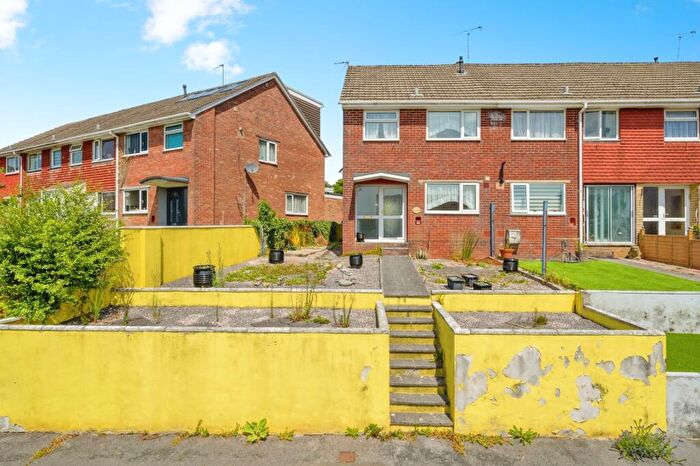
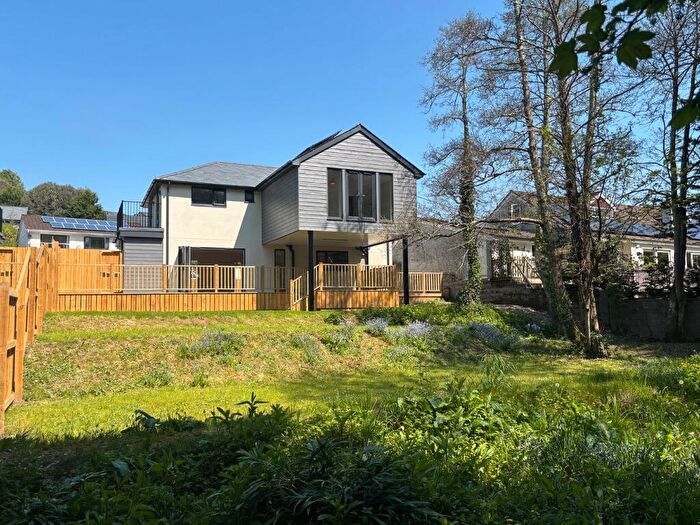
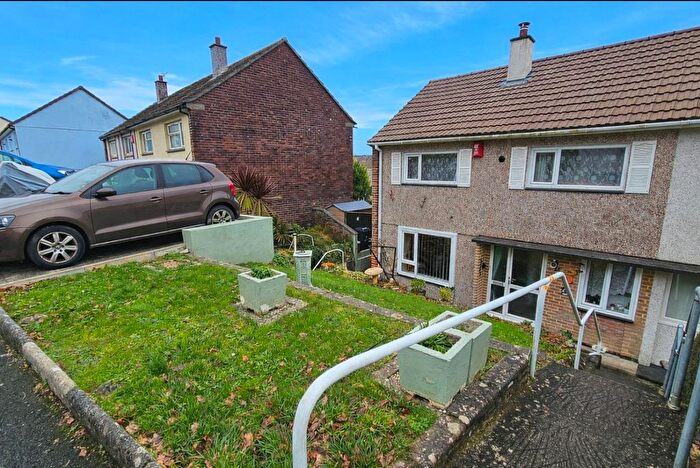
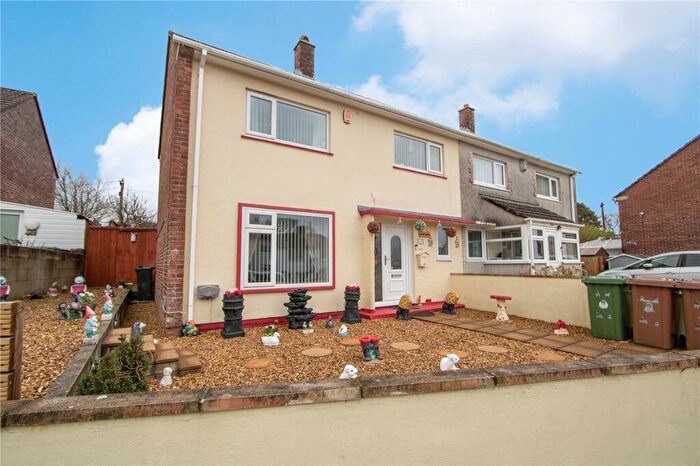
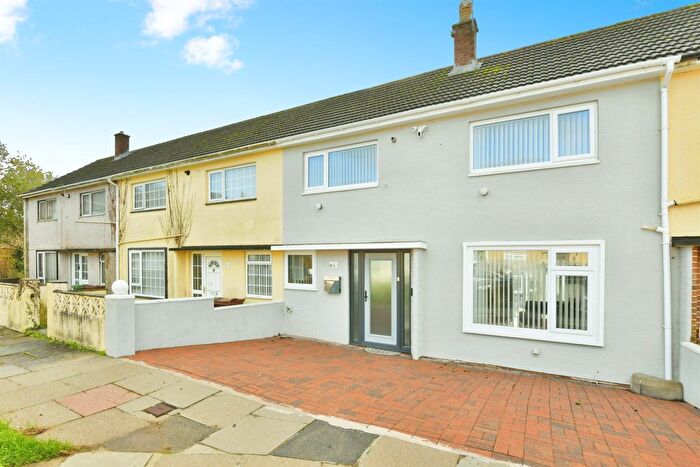
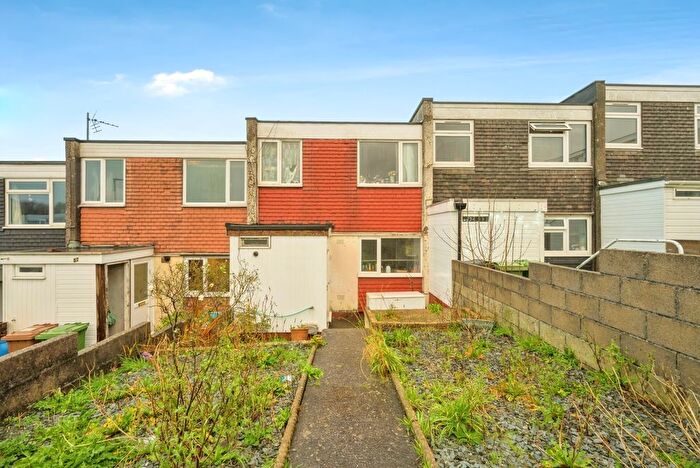
Previously listed properties near PL5 4LF, Coombe Lane
Price Paid in Coombe Lane, PL5 4LF, Southway
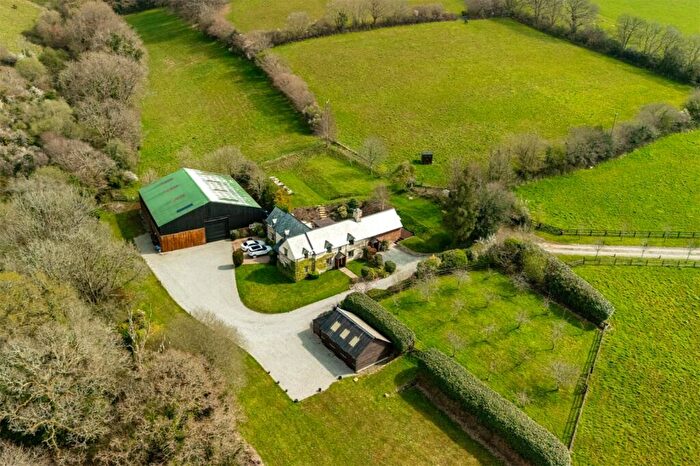
100 Coombe Lane, PL5 4LF, Southway Plymouth
Property 100 has been sold 1 time. The last time it was sold was in 08/06/2018 and the sold price was £550,000.00.
This detached house, sold as a freehold on 08/06/2018, is a 189 sqm detached house with an EPC rating of D.
| Date | Price | Property Type | Tenure | Classification |
|---|---|---|---|---|
| 08/06/2018 | £550,000.00 | Detached House | freehold | Established Building |
CLITTAFORD COTTAGE Coombe Lane, PL5 4LF, Southway Plymouth
Property CLITTAFORD COTTAGE has been sold 1 time. The last time it was sold was in 09/07/2008 and the sold price was £325,000.00.
This is a Detached House which was sold as a freehold in 09/07/2008
| Date | Price | Property Type | Tenure | Classification |
|---|---|---|---|---|
| 09/07/2008 | £325,000.00 | Detached House | freehold | Established Building |
COOMBE COTTAGE Coombe Lane, PL5 4LF, Southway Plymouth
Property COOMBE COTTAGE has been sold 2 times. The last time it was sold was in 06/07/2001 and the sold price was £340,000.00.
This detached house, sold as a freehold on 06/07/2001, is a 220 sqm detached house with an EPC rating of D.
| Date | Price | Property Type | Tenure | Classification |
|---|---|---|---|---|
| 06/07/2001 | £340,000.00 | Detached House | freehold | Established Building |
| 02/12/1997 | £210,000.00 | Detached House | freehold | Established Building |
Transport near PL5 4LF, Coombe Lane

House price paid reports for PL5 4LF, Coombe Lane
Click on the buttons below to see price paid reports by year or property price:
- Price Paid By Year
Property Price Paid in PL5 4LF, Coombe Lane by Year
The average sold property price by year was:
| Year | Average Sold Price | Price Change |
Sold Properties
|
|---|---|---|---|
| 2018 | £550,000 | 41% |
1 Property |
| 2008 | £325,000 | -5% |
1 Property |
| 2001 | £340,000 | 38% |
1 Property |
| 1997 | £210,000 | - |
1 Property |