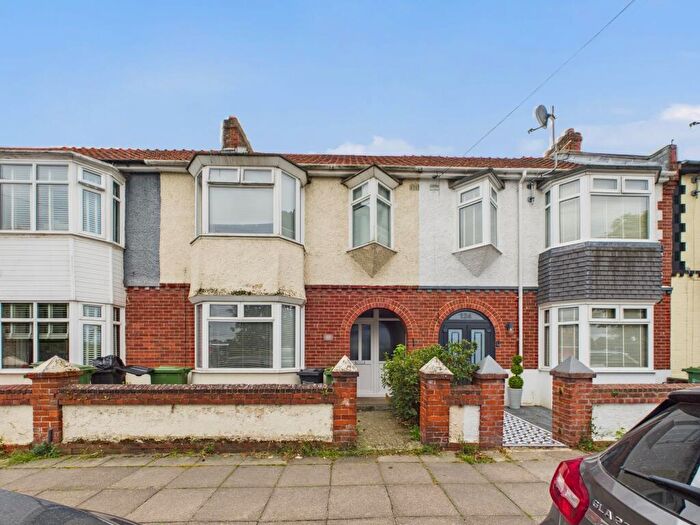
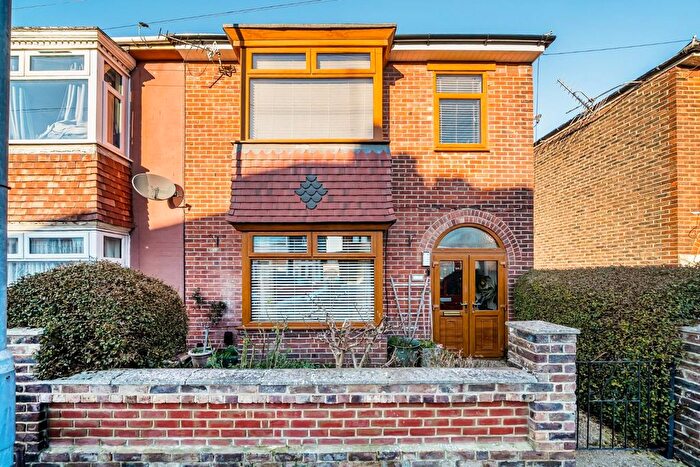
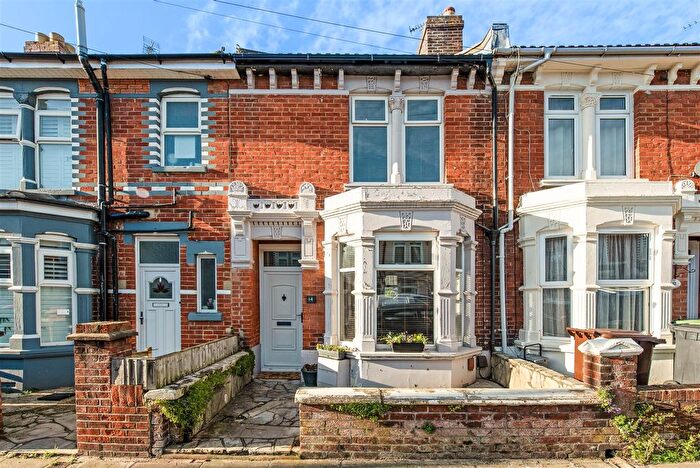
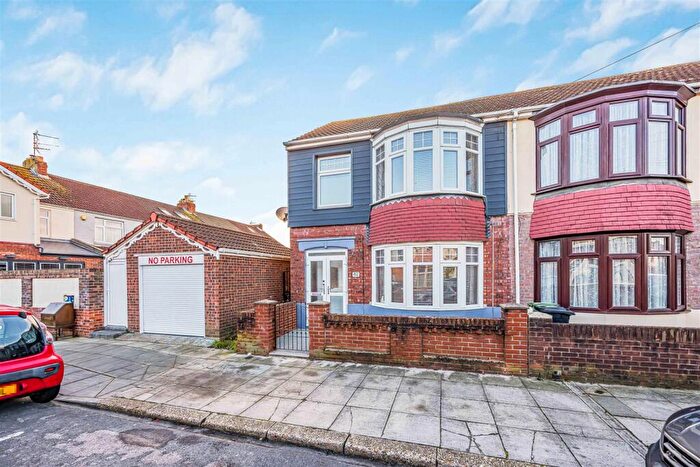
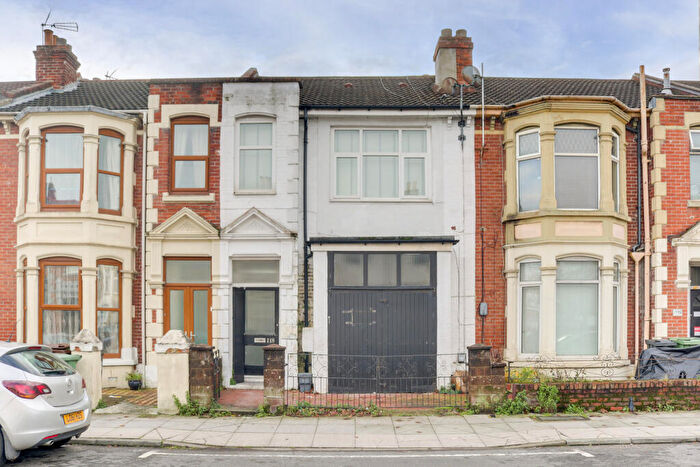
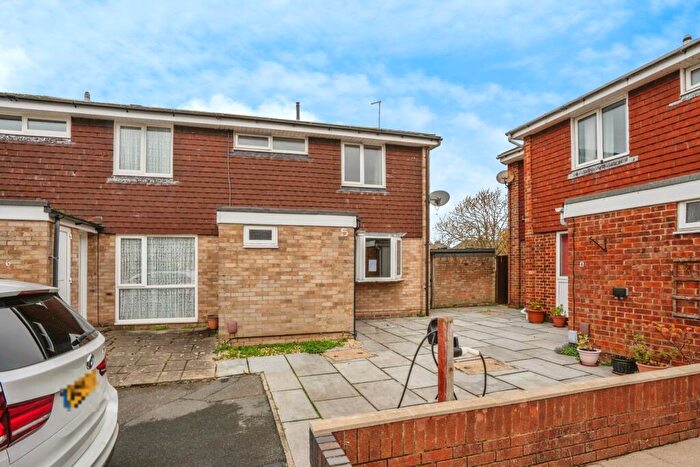
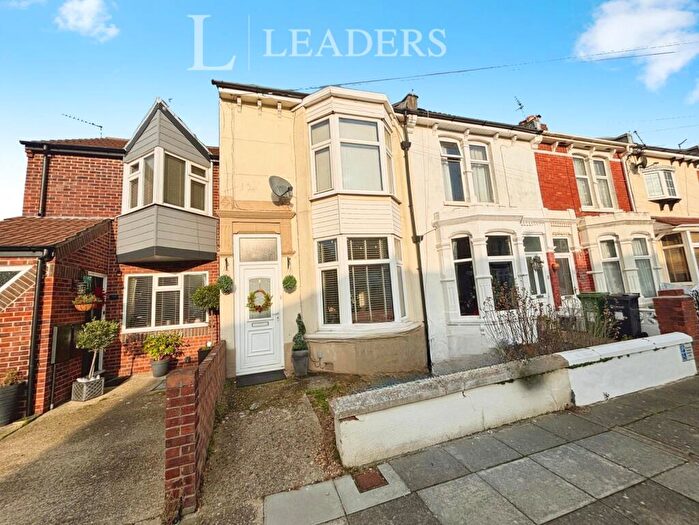
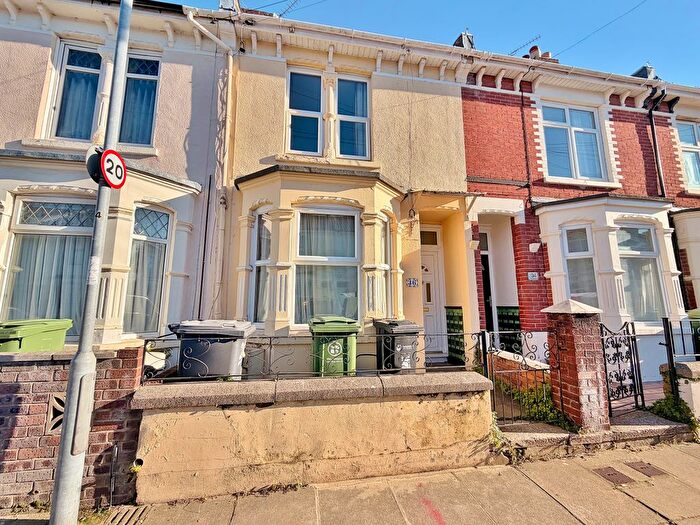
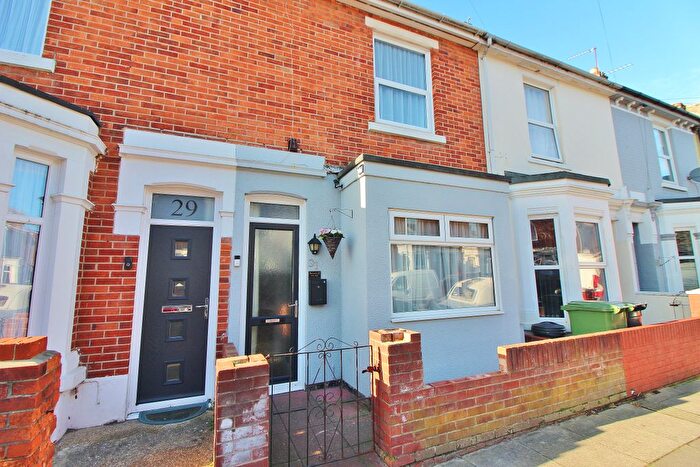
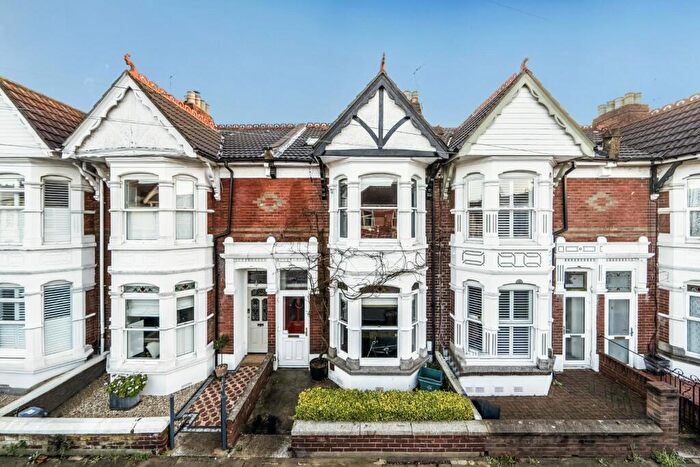
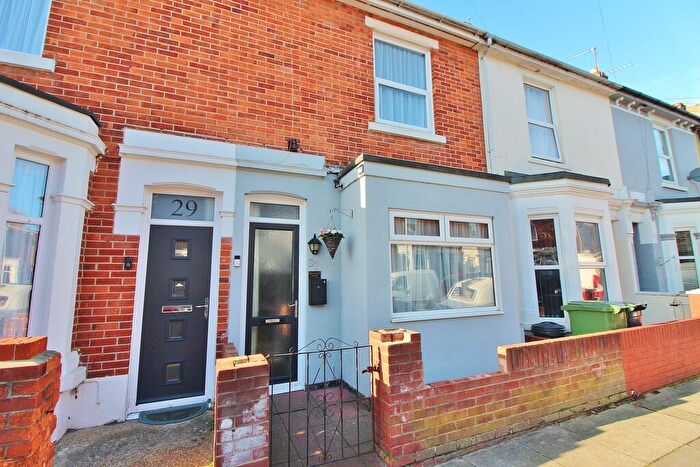
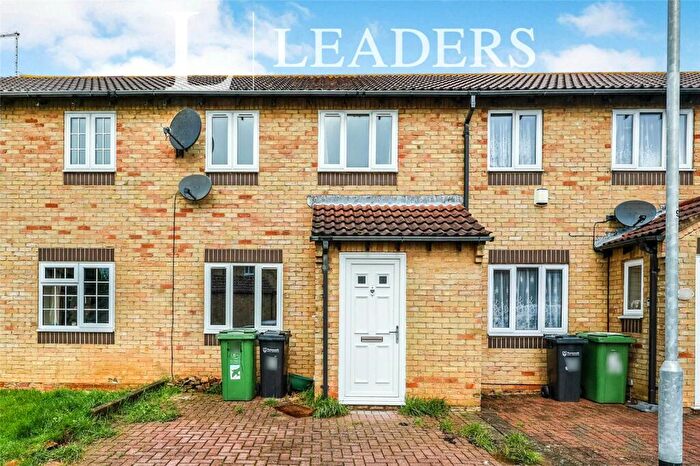
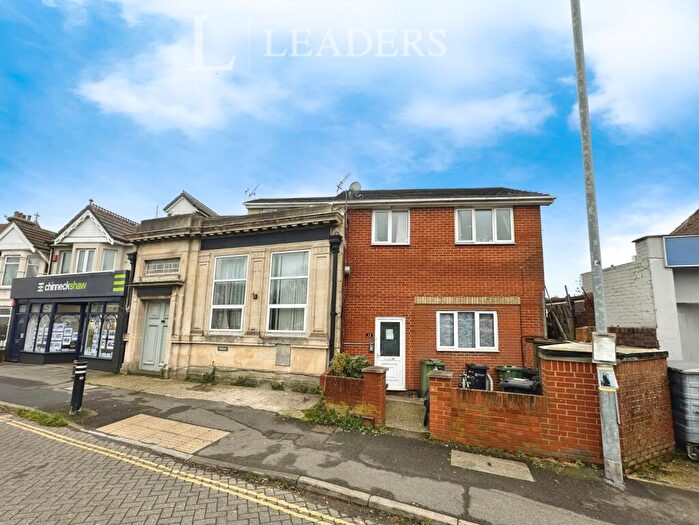
Houses for sale & to rent in Copnor, Portsmouth
House Prices in Copnor
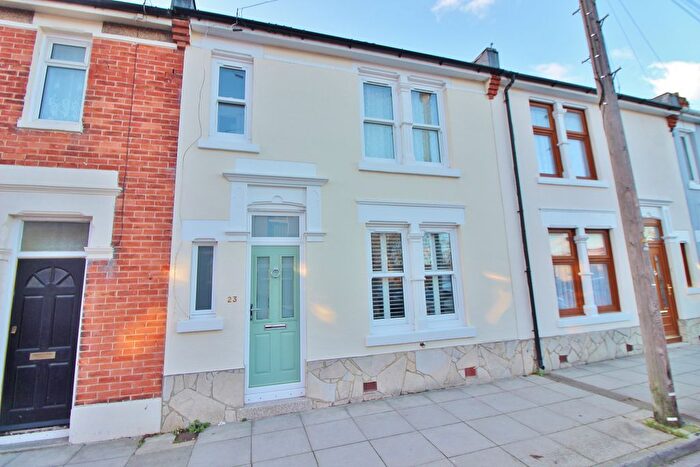
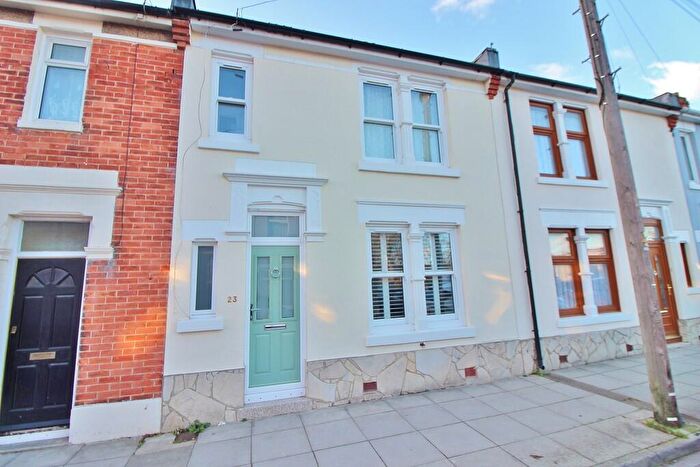
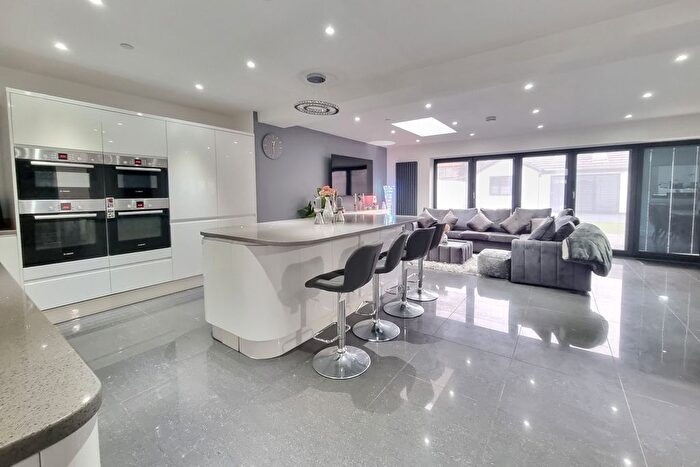
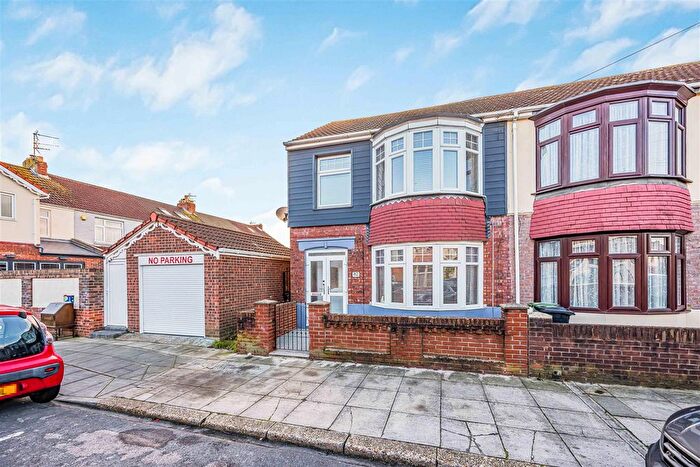
Properties in Copnor have an average house price of £270,262.00 and had 710 Property Transactions within the last 3 years¹.
Copnor is an area in Portsmouth, City of Portsmouth with 5,277 households², where the most expensive property was sold for £630,000.00.
Properties for sale in Copnor
Roads and Postcodes in Copnor
Navigate through our locations to find the location of your next house in Copnor, Portsmouth for sale or to rent.
| Streets | Postcodes |
|---|---|
| Ackworth Road | PO3 5GB |
| Adstone Lane | PO3 5TE |
| Airport Service Road | PO3 5FU PO3 5GE PO3 5PB PO3 5PE PO3 5PF PO3 5PJ PO3 5PQ PO3 5RA PO3 5TU PO3 5XR PO3 5PD |
| Airspeed Road | PO3 5PW PO3 5RF |
| Alchorne Place | PO3 5PA PO3 5QL PO3 5QS |
| Allcot Road | PO3 5DE PO3 5DF |
| Althorpe Drive | PO3 5TF PO3 5TP PO3 5TQ PO3 5XA PO3 5XB PO3 5UP |
| Anchorage Road | PO3 5FB PO3 5PU PO3 5UH |
| Aylen Road | PO3 5HB PO3 5HD PO3 5HE |
| Balfour Road | PO2 0DJ |
| Barton Grove | PO3 5TY |
| Battenburg Avenue | PO2 0SW PO2 0TA |
| Beaulieu Road | PO2 0DN |
| Bedhampton Road | PO2 7JX PO2 7JY |
| Belgravia Road | PO2 0DX |
| Bilton Way | PO3 5FE PO3 5FF PO3 5FH |
| Blakesley Lane | PO3 5UG |
| Bolde Close | PO3 5RD |
| Bosham Road | PO2 7LG PO2 7LQ |
| Boughton Court | PO3 5UZ |
| Brampton Lane | PO3 5TB |
| Buckby Lane | PO3 5UY |
| Burcote Drive | PO3 5UD |
| Burlington Road | PO2 0DP |
| Burrfields Road | PO3 5DP PO3 5NA PO3 5NB PO3 5NN |
| Challenge Enterprise Centre | PO3 5RJ |
| Chelmsford Road | PO2 0JY PO2 0QE |
| Chichester Road | PO2 0AH PO2 0AJ PO2 0AL PO2 0AN PO2 0AQ PO2 0AS PO2 0AU PO2 0AW PO2 0AX PO2 0AP |
| Claybank Road | PO3 5NH PO3 5NQ |
| Copnor Road | PO3 5AG PO3 5BS PO3 5BT PO3 5BY PO3 5DB PO3 5DD PO3 5EE PO3 5EF PO3 5EG PO3 5EL PO3 5EN PO3 5EW PO3 5AF PO3 5AW PO3 5GA |
| Copythorn Road | PO2 0DZ PO2 0EB |
| Corby Crescent | PO3 5UN PO3 5UR PO3 5UU PO3 5UX |
| Crofton Road | PO2 0NP PO2 0NR PO2 0NS PO2 0NT PO2 0LB |
| Dartmouth Road | PO3 5DT PO3 5DU |
| Daventry Lane | PO3 5UL |
| Devon Road | PO3 5ET |
| Domum Road | PO2 0QZ |
| Drayton Road | PO2 7HW |
| Dundas Close | PO3 5RB |
| Dundas Lane | PO3 5BL PO3 5ND PO3 5NR PO3 5SD PO3 5XT |
| Dundas Spur | PO3 5NL PO3 5NX PO3 5NY PO3 5QA PO3 5RN PO3 5RW |
| Eastern Road | PO3 5LY |
| Ecton Lane | PO3 5TA |
| Epworth Road | PO2 0HD |
| Everdon Lane | PO3 5UA |
| Fairway Business Centre | PO3 5NU |
| Farlington Road | PO2 0DS PO2 7HS PO2 7HT PO2 7HU |
| Foxley Drive | PO3 5TG |
| Funtington Road | PO2 7LE PO2 7LF |
| Gatcombe Avenue | PO3 5HG |
| Glenthorne Road | PO3 5DL PO3 5DN |
| Green Lane | PO3 5EY PO3 5EZ |
| Hartwell Road | PO3 5TN |
| Heathcote Road | PO2 0JT |
| Hewett Road | PO2 0QS PO2 0QT |
| Holcot Lane | PO3 5TR PO3 5UE PO3 5UQ |
| Holdenby Court | PO3 5US |
| Interchange Park | PO3 5QD |
| Kensington Road | PO2 0DY PO2 0EA PO2 0EZ PO2 0HA PO2 0JP PO2 0JR PO2 0JX PO2 0QD PO2 0QU PO2 0QY PO2 0RB PO2 0JS |
| Kenyon Road | PO2 0JZ PO2 0RG |
| Kirby Road | PO2 0PN PO2 0PP PO2 0PR PO2 0PS PO2 0PT PO2 0PW PO2 0PX PO2 0PY PO2 0PZ PO2 0QA PO2 0QB |
| Laburnum Grove | PO2 0ES PO2 0ET PO2 0EU PO2 0EX PO2 0EY PO2 0HE PO2 0HF |
| Land And Building On The South Side Of | PO3 5QQ |
| Latimer Court | PO3 5UW |
| Locarno Road | PO3 5DG |
| Lovett Road | PO3 5EU PO3 5EX |
| Lyndhurst Road | PO2 0DT PO2 0ED PO2 0EE PO2 0LA PO2 0RJ |
| Maidford Grove | PO3 5TJ |
| Marston Lane | PO3 5TW |
| Mayfield Road | PO2 0RA PO2 0RD PO2 0RF PO2 0RH PO2 0RL PO2 0RN |
| Mitchell Way | PO3 5PR |
| Monckton Road | PO3 5DH |
| Nevil Shute Road | PO3 5RU PO3 5RX PO3 5SL |
| Ninian Park Road | PO3 5DJ |
| O Jays Industrial Park | PO3 5SX |
| Ocean Park | PO3 5NP |
| Paddington Road | PO2 0DU |
| Painter Close | PO3 5RS |
| Paulsgrove Road | PO2 7HP PO2 7HR |
| Plumpton Gardens | PO3 5TZ |
| Portchester Road | PO2 7HZ PO2 7JA PO2 7JB |
| Portfield Road | PO3 5FJ PO3 5GP PO3 5GQ PO3 5RR PO3 5SF |
| Portsmouth Enterprise Centre | PO3 5QT |
| Powerscourt Road | PO2 7AW PO2 7JG PO2 7JH PO2 7JJ PO2 7JL PO2 7JQ PO2 7JR PO2 7JS |
| Preston Road | PO2 7JT PO2 7JU |
| Quartremaine Road | PO3 5QG PO3 5QH PO3 5QP |
| Queens Road | PO2 7LX PO2 7LY |
| Randolph Road | PO2 0NN PO2 0PL PO2 0QN |
| Robinson Way | PO3 5SA PO3 5TH |
| Sharps Close | PO3 5PL PO3 5PS |
| St Chads Avenue | PO2 0SD |
| St Swithuns Road | PO2 0QX |
| Stubbington Avenue | PO2 0JA PO2 0JE PO2 0JF PO2 0JG PO2 0JH PO2 0JJ PO2 0JL PO2 0JN PO2 0JQ PO2 0JW |
| Sutton Close | PO3 5UT PO3 5XS |
| Sywell Crescent | PO3 5TS PO3 5UJ PO3 5XU PO3 5YB PO3 5TL PO3 5UB PO3 5XX |
| The Admiral Park | PO3 5NJ PO3 5RQ |
| The Approach | PO3 5LL |
| The Pyramid Centre | PO3 5SH |
| Thornby Court | PO3 5TX |
| Tiffield Close | PO3 5XD |
| Vernon Road | PO3 5DR PO3 5DS |
| Victory Trading Estate | PO3 5LP |
| Voyager Park | PO3 5FL PO3 5FN |
| Voyager Park North | PO3 5FX |
| Voyager Park South | PO3 5GF |
| Wallace Road | PO2 7JZ PO2 7LA |
| Wallington Road | PO2 0HB |
| Wesley Grove | PO3 5ER PO3 5ES |
| Westbourne Road | PO2 7LB PO2 7LD |
| Wilby Lane | PO3 5UF |
| Williams Road | PO3 5FP PO3 5SP |
| Winton Road | PO2 0JU |
| Wykeham Avenue | PO2 0EH |
| Wykeham Road | PO2 0EG PO2 0EQ |
| Wymering Road | PO2 7HX PO2 7HY |
| Yardley Close | PO3 5TT |
Transport near Copnor
-
Hilsea Station
-
Cosham Station
-
Fratton Station
-
Portsmouth and Southsea Station
-
Portsmouth Harbour Station
- FAQ
- Price Paid By Year
- Property Type Price
Frequently asked questions about Copnor
What is the average price for a property for sale in Copnor?
The average price for a property for sale in Copnor is £270,262. This amount is 0.55% lower than the average price in Portsmouth. There are 2,916 property listings for sale in Copnor.
What streets have the most expensive properties for sale in Copnor?
The streets with the most expensive properties for sale in Copnor are Holdenby Court at an average of £421,000, Claybank Road at an average of £415,150 and Hewett Road at an average of £365,428.
What streets have the most affordable properties for sale in Copnor?
The streets with the most affordable properties for sale in Copnor are Corby Crescent at an average of £184,967, Hartwell Road at an average of £210,000 and Sutton Close at an average of £210,875.
Which train stations are available in or near Copnor?
Some of the train stations available in or near Copnor are Hilsea, Cosham and Fratton.
Property Price Paid in Copnor by Year
The average sold property price by year was:
| Year | Average Sold Price | Price Change |
Sold Properties
|
|---|---|---|---|
| 2025 | £273,432 | 2% |
133 Properties |
| 2024 | £267,612 | -0,3% |
190 Properties |
| 2023 | £268,425 | -1% |
175 Properties |
| 2022 | £272,164 | 8% |
212 Properties |
| 2021 | £249,739 | 5% |
269 Properties |
| 2020 | £238,140 | 8% |
185 Properties |
| 2019 | £218,862 | -0,1% |
184 Properties |
| 2018 | £218,989 | 4% |
229 Properties |
| 2017 | £211,151 | 6% |
260 Properties |
| 2016 | £198,540 | 9% |
263 Properties |
| 2015 | £181,370 | 5% |
273 Properties |
| 2014 | £172,167 | 5% |
251 Properties |
| 2013 | £164,304 | 4% |
207 Properties |
| 2012 | £158,182 | -3% |
196 Properties |
| 2011 | £162,224 | 5% |
147 Properties |
| 2010 | £154,118 | 2% |
163 Properties |
| 2009 | £151,210 | -5% |
162 Properties |
| 2008 | £159,134 | -2% |
146 Properties |
| 2007 | £162,743 | 5% |
308 Properties |
| 2006 | £155,407 | 3% |
348 Properties |
| 2005 | £150,878 | 4% |
251 Properties |
| 2004 | £145,274 | 7% |
332 Properties |
| 2003 | £135,403 | 15% |
314 Properties |
| 2002 | £114,842 | 20% |
384 Properties |
| 2001 | £91,691 | 12% |
354 Properties |
| 2000 | £80,255 | 17% |
376 Properties |
| 1999 | £66,690 | 7% |
412 Properties |
| 1998 | £61,765 | 7% |
356 Properties |
| 1997 | £57,368 | 8% |
380 Properties |
| 1996 | £53,015 | -2% |
336 Properties |
| 1995 | £54,252 | - |
272 Properties |
Property Price per Property Type in Copnor
Here you can find historic sold price data in order to help with your property search.
The average Property Paid Price for specific property types in the last three years are:
| Property Type | Average Sold Price | Sold Properties |
|---|---|---|
| Flat | £158,663.00 | 74 Flats |
| Semi Detached House | £306,105.00 | 87 Semi Detached Houses |
| Detached House | £409,786.00 | 25 Detached Houses |
| Terraced House | £273,415.00 | 524 Terraced Houses |


