
Houses for sale & to rent in City of Portsmouth, England
House Prices in City of Portsmouth
Properties in City of Portsmouth have
an average house price of
£277k
and had 7,506 Property Transactions
within the last 3 years.¹
City of Portsmouth is a location in
England with
85,442 households², where the most expensive property was sold for £22.5M.
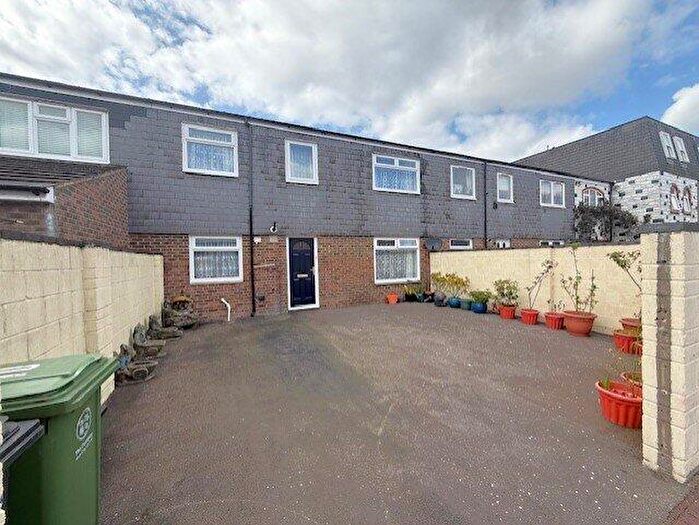
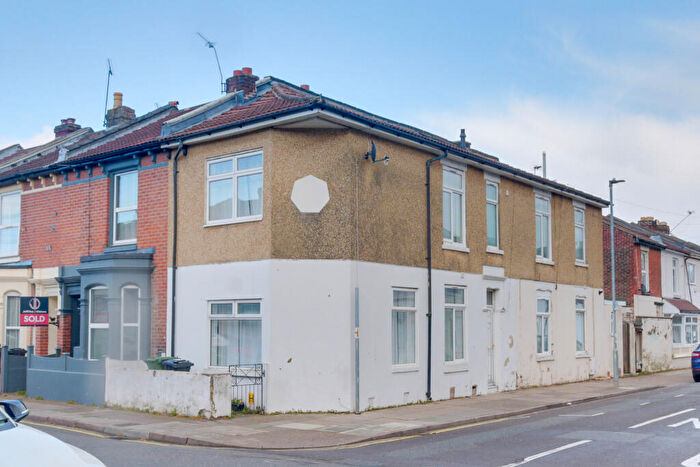
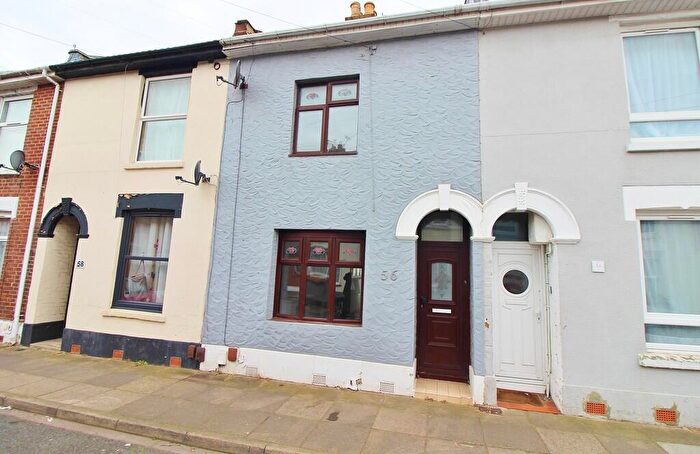
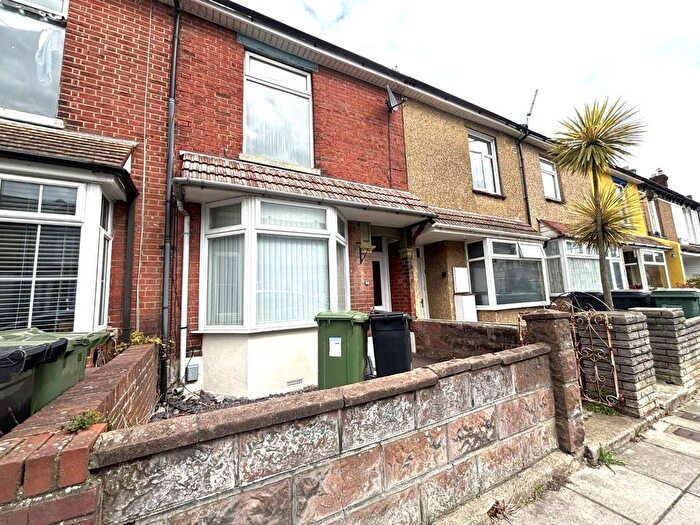
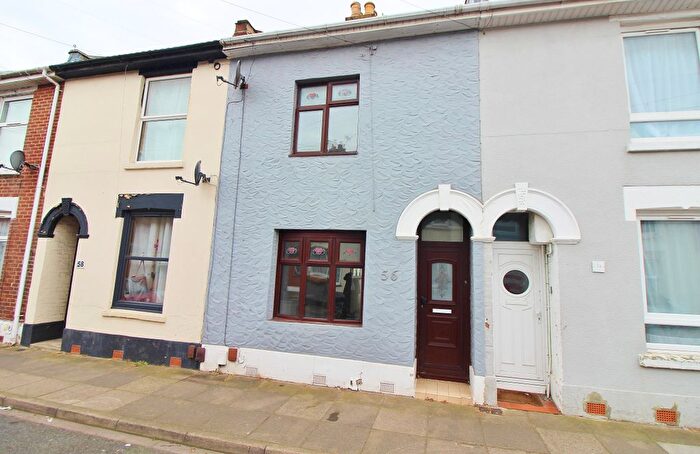
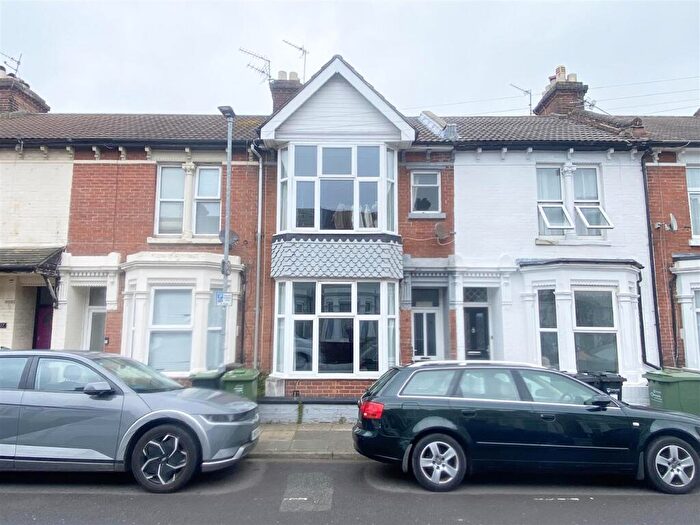
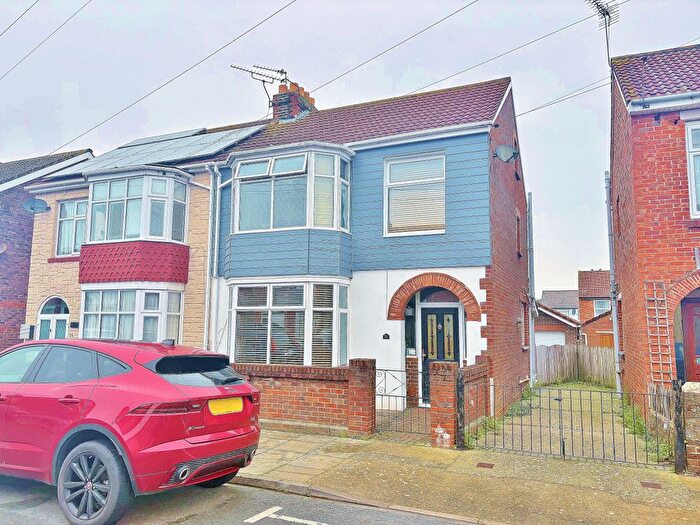
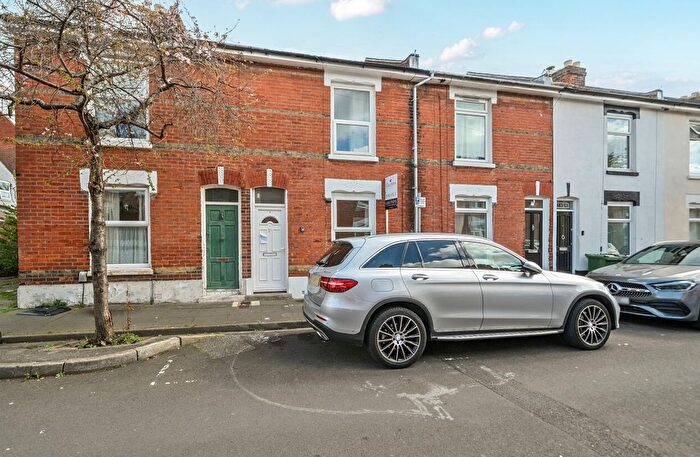
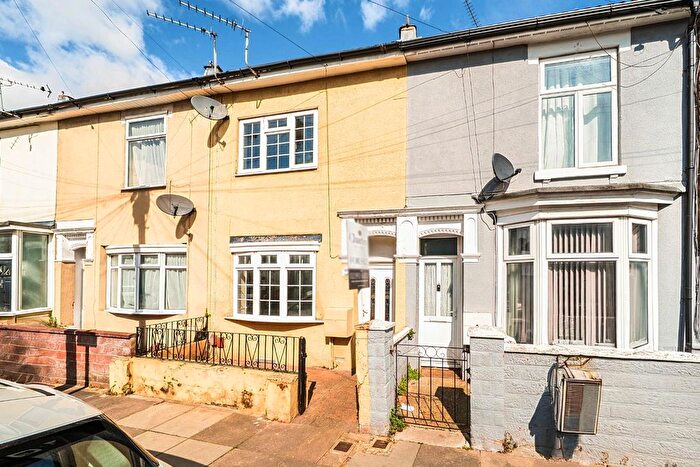
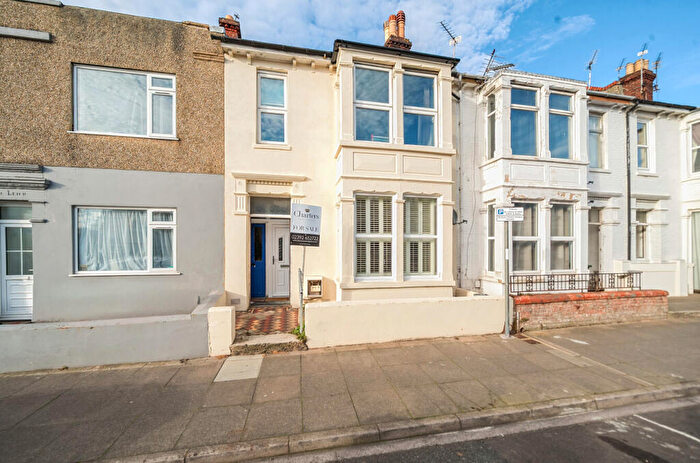
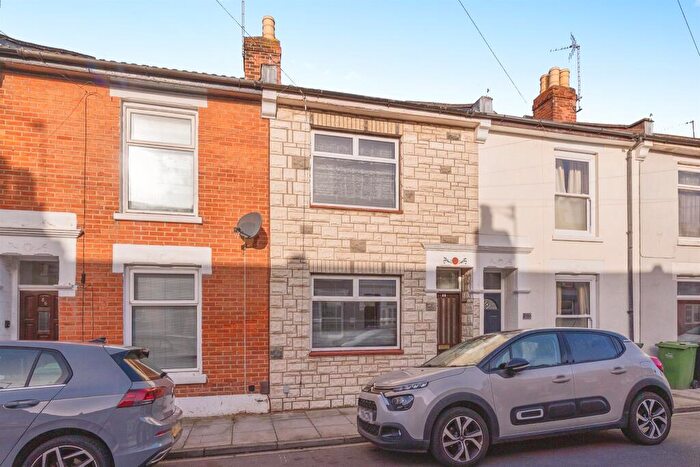
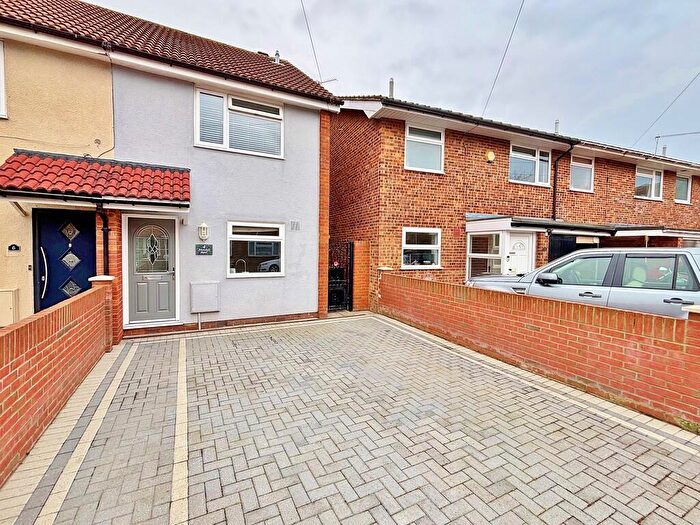
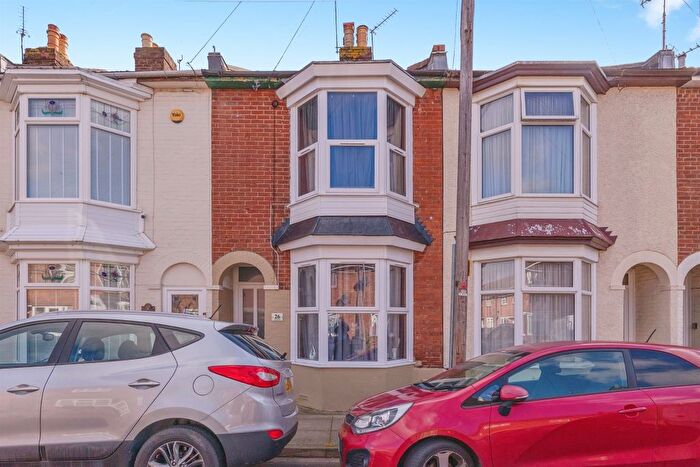
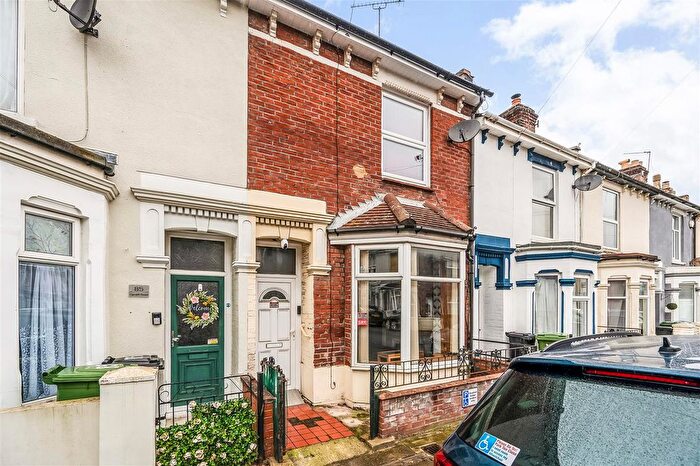
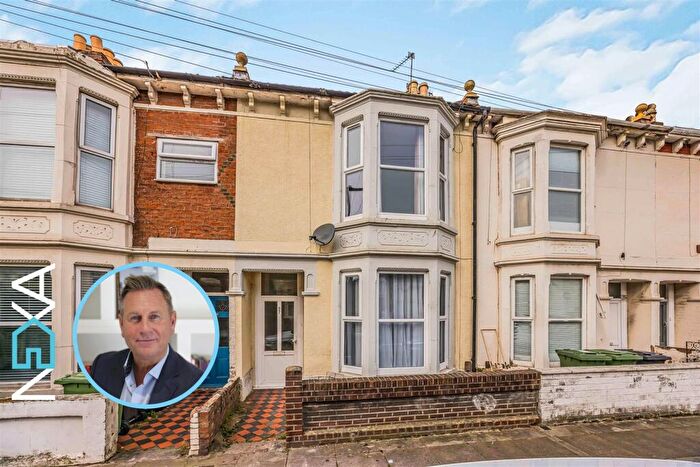
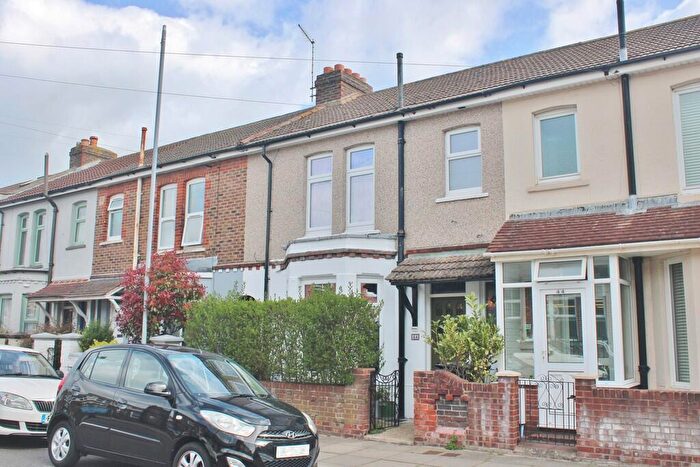
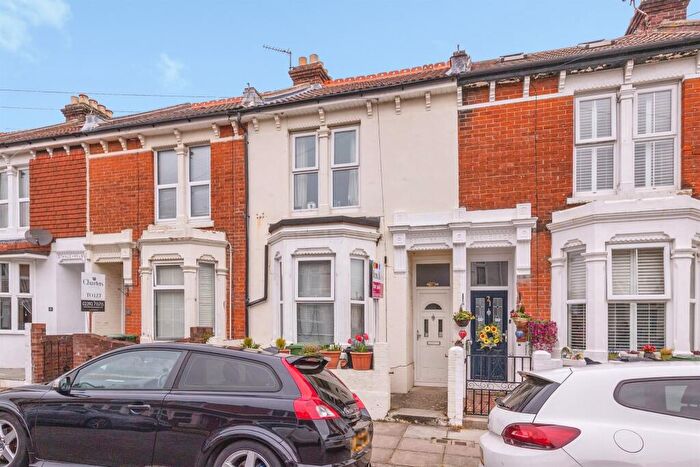
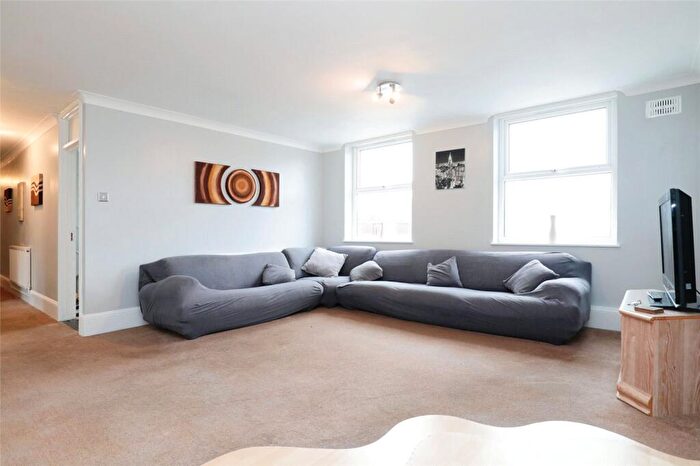
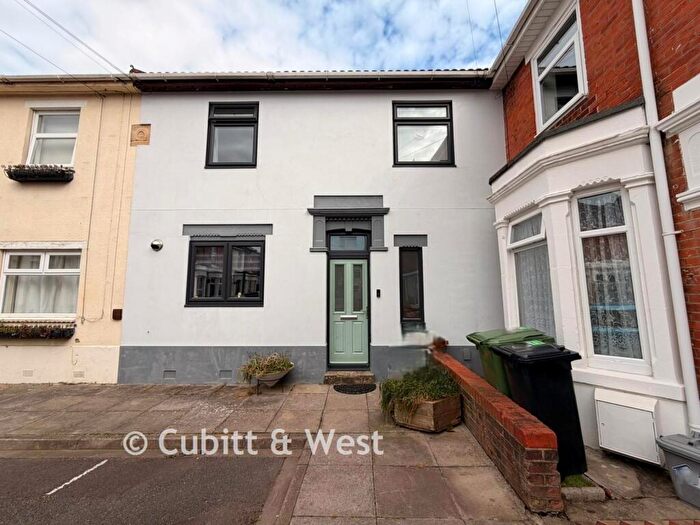
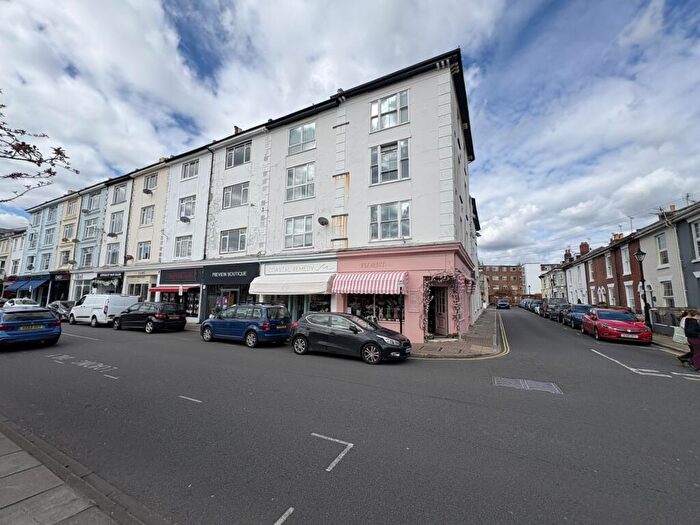
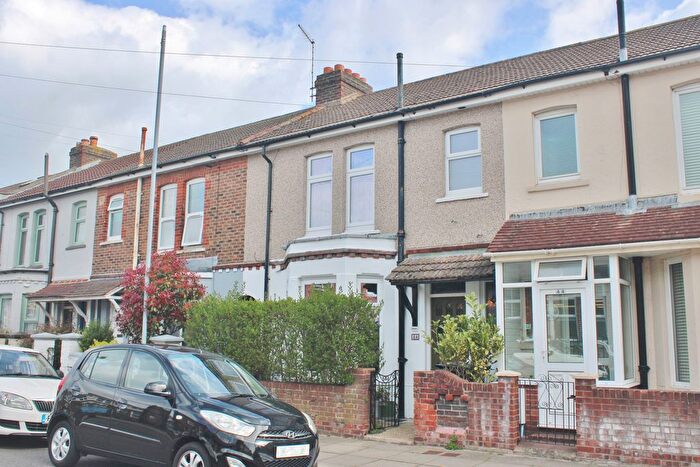
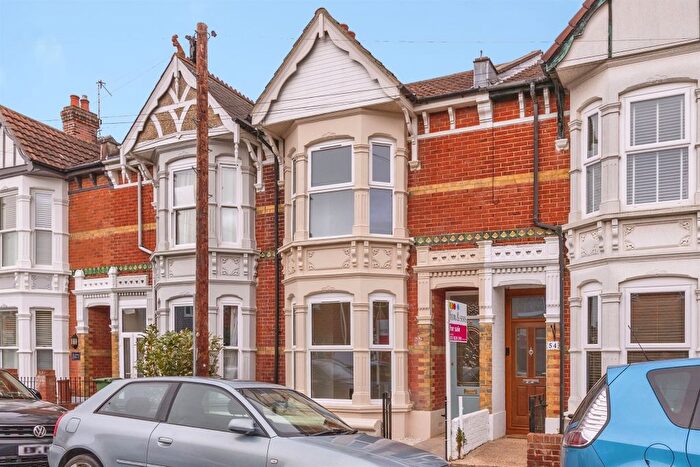
Properties for sale in City of Portsmouth
![]()
If you are looking to sell your house, let it out, or receive a property valuation, an expert can help you.
Click the button below to get started.

Towns in City of Portsmouth
Navigate through our locations to find the location of your next house in City of Portsmouth, England for sale or to rent.
Transport in City of Portsmouth
Please see below transportation links in this area:
-
 Fratton Station
 -
Portsmouth and Southsea Station
-
Hilsea Station
-
Portsmouth Harbour Station
-
Cosham Station
- FAQ
- Price Paid By Year
- Property Type Price
Frequently asked questions about City of Portsmouth
What is the average price for a property for sale in City of Portsmouth?
The average price for a property for sale in City of Portsmouth is £276,799. This amount is 23% lower than the average price in England. There are more than 10,000 property listings for sale in City of Portsmouth.
What locations have the most expensive properties for sale in City of Portsmouth?
The locations with the most expensive properties for sale in City of Portsmouth are Waterlooville at an average of £393,875 and Southsea at an average of £278,578.
What locations have the most affordable properties for sale in City of Portsmouth?
The location with the most affordable properties for sale in City of Portsmouth is Portsmouth at an average of £275,347.
Which train stations are available in or near City of Portsmouth?
Some of the train stations available in or near City of Portsmouth are Fratton, Portsmouth and Southsea and Hilsea.
Property Price Paid in City of Portsmouth by Year
The average sold property price by year was:
| Year | Average Sold Price | Price Change |
Sold Properties
|
|---|---|---|---|
| 2026 | £271,233 | -5% |
49 Properties |
| 2025 | £284,148 | 4% |
2,433 Properties |
| 2024 | £272,817 | -0,4% |
2,705 Properties |
| 2023 | £273,851 | -2% |
2,319 Properties |
| 2022 | £278,402 | 8% |
3,272 Properties |
| 2021 | £257,097 | 5% |
3,959 Properties |
| 2020 | £245,490 | 6% |
2,734 Properties |
| 2019 | £231,412 | -1% |
3,061 Properties |
| 2018 | £234,156 | 5% |
3,453 Properties |
| 2017 | £223,539 | 7% |
3,592 Properties |
| 2016 | £206,946 | 6% |
3,937 Properties |
| 2015 | £193,548 | 5% |
3,865 Properties |
| 2014 | £183,590 | 6% |
3,671 Properties |
| 2013 | £172,197 | 2% |
2,908 Properties |
| 2012 | £168,485 | 1% |
2,402 Properties |
| 2011 | £167,485 | -3% |
2,275 Properties |
| 2010 | £172,753 | 7% |
2,385 Properties |
| 2009 | £160,883 | -5% |
2,564 Properties |
| 2008 | £168,600 | -3% |
2,589 Properties |
| 2007 | £172,961 | 6% |
5,337 Properties |
| 2006 | £162,436 | 5% |
5,347 Properties |
| 2005 | £154,503 | 2% |
3,949 Properties |
| 2004 | £152,118 | 10% |
4,740 Properties |
| 2003 | £137,093 | 13% |
4,769 Properties |
| 2002 | £118,857 | 20% |
5,652 Properties |
| 2001 | £95,555 | 11% |
5,036 Properties |
| 2000 | £85,344 | 17% |
4,981 Properties |
| 1999 | £71,033 | 7% |
5,190 Properties |
| 1998 | £66,270 | 9% |
4,574 Properties |
| 1997 | £60,568 | 10% |
4,936 Properties |
| 1996 | £54,716 | 3% |
4,027 Properties |
| 1995 | £52,852 | - |
3,315 Properties |
Property Price per Property Type in City of Portsmouth
Here you can find historic sold price data in order to help with your property search.
The average Property Paid Price for specific property types in the last three years are:
| Property Type | Average Sold Price | Sold Properties |
|---|---|---|
| Semi Detached House | £365,256.00 | 859 Semi Detached Houses |
| Terraced House | £284,186.00 | 4,401 Terraced Houses |
| Detached House | £555,168.00 | 250 Detached Houses |
| Flat | £187,576.00 | 1,996 Flats |