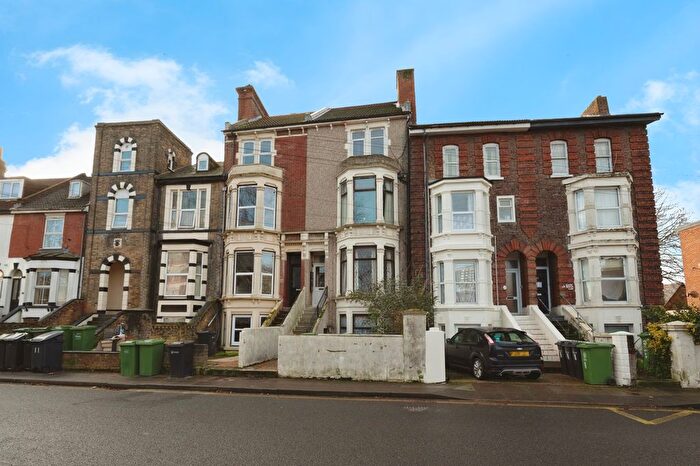
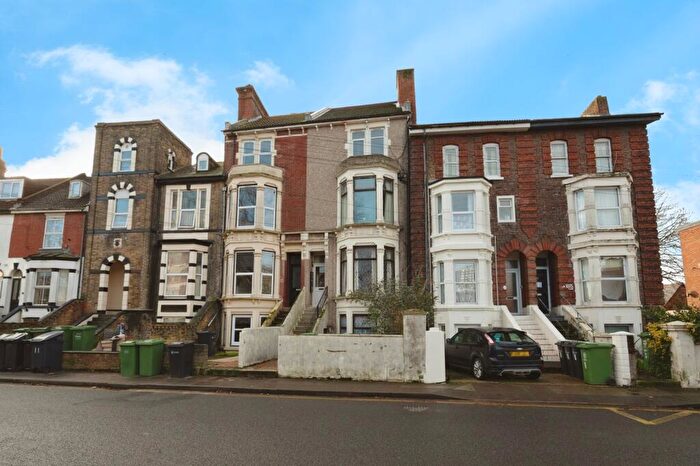
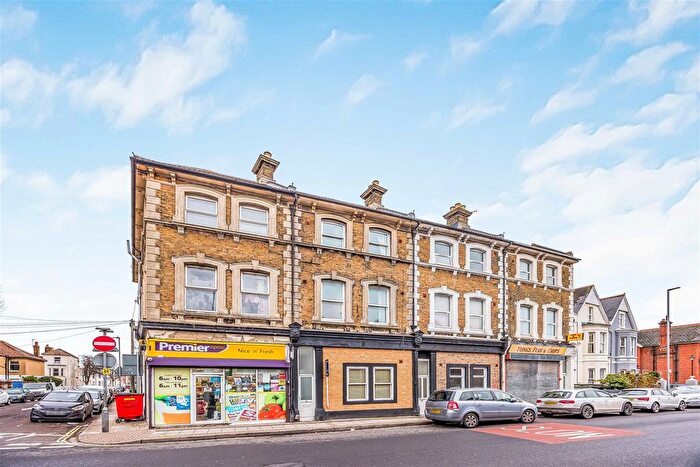
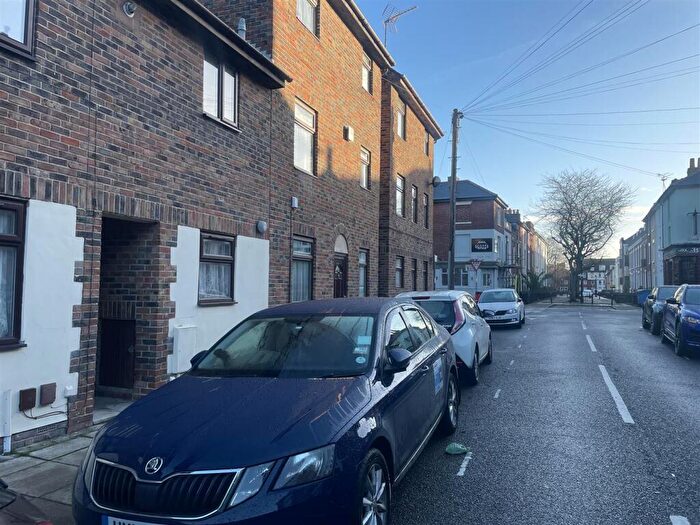
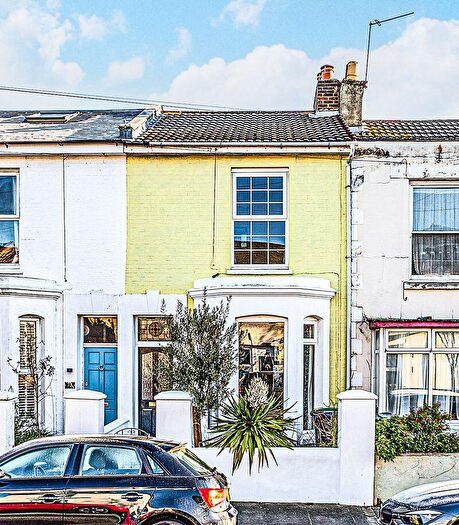
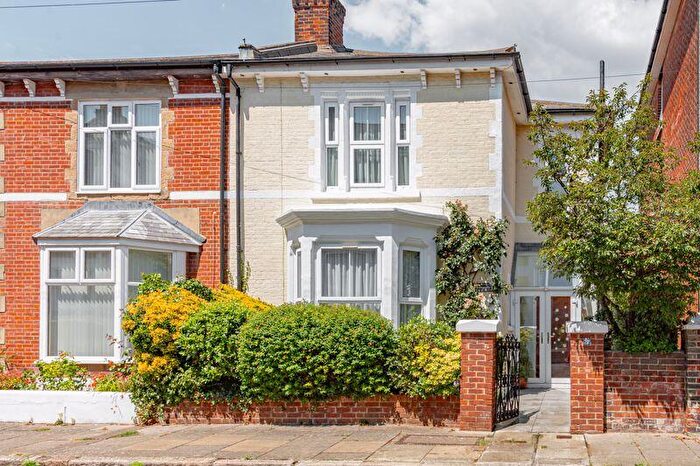
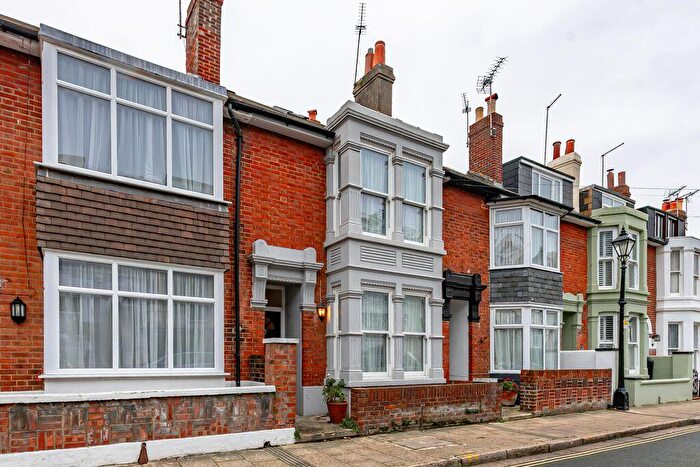
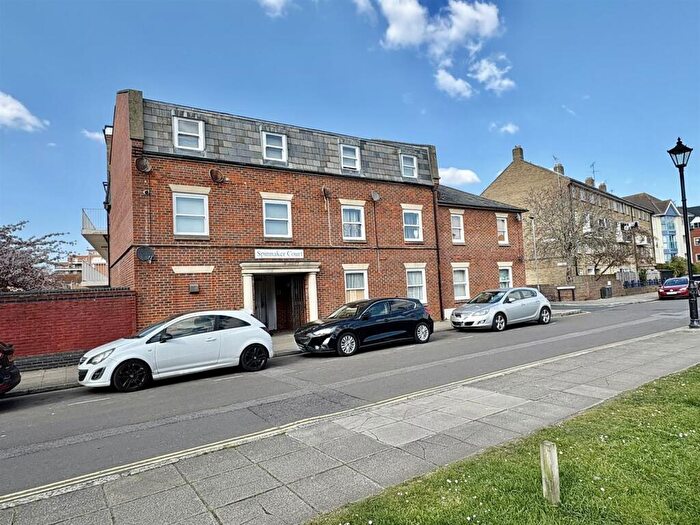
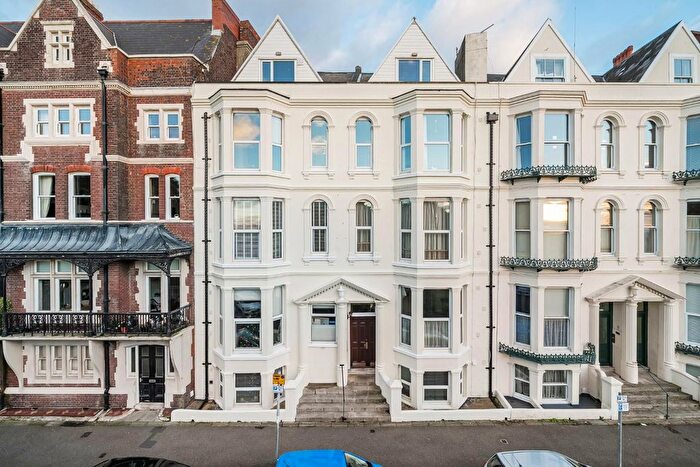
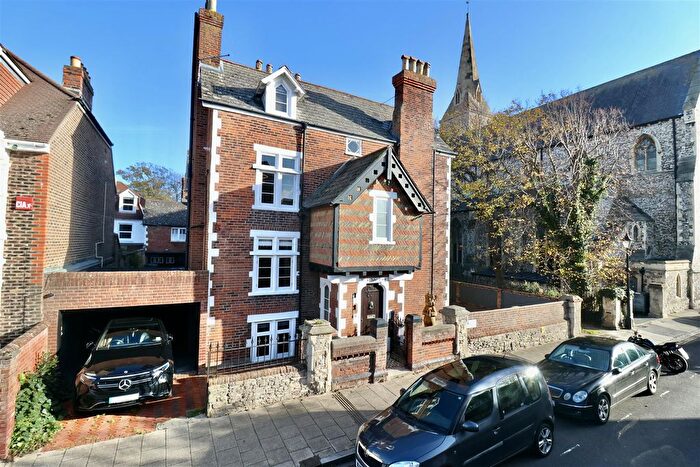
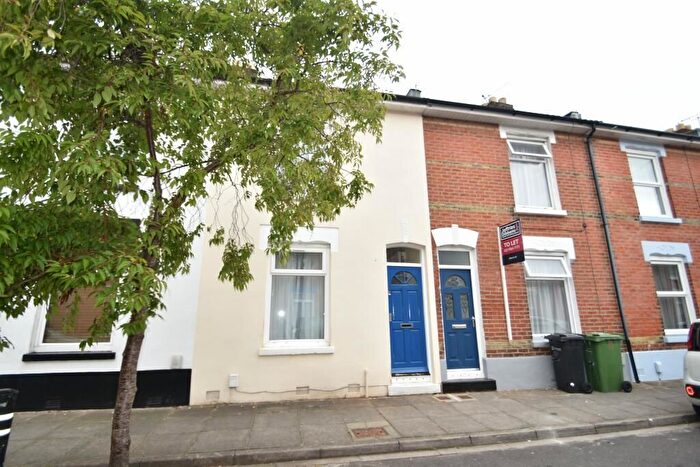
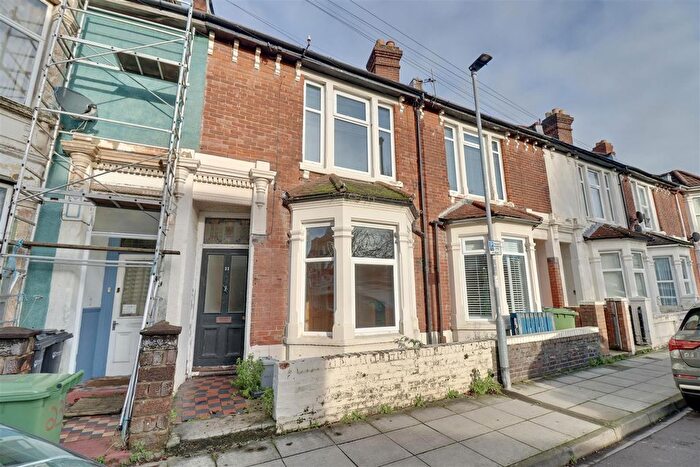
Houses for sale & to rent in St Thomas, Southsea
House Prices in St Thomas
Properties in St Thomas have an average house price of £264,186.00 and had 379 Property Transactions within the last 3 years¹.
St Thomas is an area in Southsea, City of Portsmouth with 4,908 households², where the most expensive property was sold for £1,500,000.00.
Properties for sale in St Thomas
Roads and Postcodes in St Thomas
Navigate through our locations to find the location of your next house in St Thomas, Southsea for sale or to rent.
| Streets | Postcodes |
|---|---|
| Astley Street | PO5 4BZ PO5 4FJ |
| Baileys Road | PO5 1EA |
| Barrington Terrace | PO5 4ES |
| Bedford Street | PO5 4BT |
| Bellevue Terrace | PO5 3AT |
| Belmont Place | PO5 1NB |
| Belmont Street | PO5 1ND PO5 1NA |
| Bradford Road | PO5 1AA PO5 1AD |
| Brougham Road | PO5 4PA |
| Brunswick Street | PO5 4BY |
| Bush Street East | PO5 3BL |
| Bush Street West | PO5 3RX |
| Castle Close | PO5 3EB |
| Castle Road | PO5 3AY PO5 3AZ PO5 3DE PO5 3DF |
| Cecil Grove | PO5 3BT |
| Cecil Place | PO5 3BU PO5 3DL PO5 3DN PO5 3DW |
| Chapel Street | PO5 3RR |
| Chivers Close | PO5 1HG |
| Clarence Esplanade | PO5 3AA |
| Copper Street | PO5 3BJ PO5 3RT |
| Cottage Grove | PO5 1AH PO5 1AL PO5 1DU PO5 1EH PO5 1EJ PO5 1EL PO5 1EN PO5 1EW |
| Crabbe Court | PO5 4QE PO5 4QF |
| Cross Street | PO5 4PP |
| Dartmouth Mews | PO5 3DA |
| Dufose Terrace | PO5 1DX |
| Dunsmore Close | PO5 4JE |
| Earlsdon Street | PO5 4DH PO5 4DA PO5 4DB PO5 4DD |
| Eldon Street | PO5 4BS PO5 4BH |
| Elm Grove | PO5 1AQ PO5 1JE PO5 1JF PO5 1JG PO5 1JH PO5 1JQ PO5 1JY PO5 1LH PO5 1LJ PO5 1LU PO5 1HR PO5 1JA PO5 1JZ PO5 1LX |
| Flint Street | PO5 3BH |
| Fraser Road | PO5 1EE |
| Garden Lane | PO5 3DP |
| Gloucester Mews | PO5 4ED |
| Gloucester Place | PO5 4EP |
| Gloucester Terrace | PO5 4DT |
| Gloucester View | PO5 4EB |
| Great Southsea Street | PO5 3BY |
| Green Road | PO5 4DG PO5 4DQ PO5 4DU PO5 4DX PO5 4DZ PO5 4DY |
| Grosvenor Street | PO5 4JG PO5 4JQ PO5 4JR |
| Grove Road North | PO5 1HN PO5 1HW PO5 1JJ PO5 1JL PO5 1JN PO5 1JW |
| Hambrook Street | PO5 3BE PO5 3BS PO5 3SA |
| Hudson Road | PO5 1HB PO5 1HD |
| Jubilee Terrace | PO5 3AS |
| King Street | PO5 4EA PO5 4EG PO5 4EH PO5 4EQ PO5 4EU |
| Kings Road | PO5 3AH PO5 3BB PO5 4DJ PO5 4DL PO5 4DN PO5 4DW PO5 4EF |
| Kings Terrace | PO5 3AL PO5 3AR |
| Landport Street | PO5 4EX PO5 4AX |
| Lansdowne Street | PO5 4BA PO5 4FA |
| Little Southsea Street | PO5 3DD PO5 3RS |
| Long Curtain Road | PO5 3AX PO5 3XX |
| Lower Forbury Road | PO5 4QJ |
| Margate Road | PO5 1EY PO5 1EZ |
| Meriden Road | PO5 4AP PO5 4DE PO5 4AJ PO5 4AL PO5 4AN |
| Middle Street | PO5 4BW PO5 4AY PO5 4BG PO5 4BP |
| Montgomerie Road | PO5 1AR PO5 1EB PO5 1ED |
| Mosaic Lane | PO5 1AU |
| Norfolk Street | PO5 4DR PO5 4DS |
| Ockenden Close | PO5 4EN |
| Pains Road | PO5 1AS PO5 1HE |
| Peel Place | PO5 4JF |
| Pelham Road | PO5 3DG |
| Pelham Road Passage | PO5 3DS |
| Playfair Road | PO5 1EQ |
| Radnor Street | PO5 4JH |
| Regent Place | PO5 3BA |
| Rivers Street | PO5 4PL PO5 4PN |
| Sackville Street | PO5 4AR PO5 4BX PO5 4BU PO5 4HA |
| Sedgley Close | PO5 4PG PO5 4PJ PO5 4FD PO5 4PH PO5 4PQ |
| Silver Street | PO5 3BW |
| Somers Road | PO5 4PR PO5 4PS PO5 4PU PO5 4PX PO5 4PY PO5 4QD PO5 4NT PO5 4QA |
| South Street | PO5 4DP |
| Southsea Terrace | PO5 3AU PO5 3AP |
| St Andrews Road | PO5 1EP PO5 1ER PO5 1ES PO5 1ET PO5 1EU PO5 1EX |
| St Davids Road | PO5 1QH PO5 1QJ PO5 1QN |
| St Edwards Road | PO5 3DH PO5 3DJ |
| St James's Road | PO5 4HU PO5 4HX PO5 4HZ PO5 4JA PO5 4JB PO5 4JD |
| St Josephs Mews | PO5 1HS |
| St Pauls Road | PO5 4AA PO5 4AB PO5 4AE PO5 4AF PO5 4AG PO5 4AQ PO5 4EW PO5 4AD |
| St Pauls Square | PO5 4AT |
| St Peters Grove | PO5 1LS |
| St Ursula Grove | PO5 1LT |
| Stone Street | PO5 3BN |
| Sussex Place | PO5 3EZ |
| Sussex Road | PO5 3EX PO5 3EY |
| Sussex Terrace | PO5 3HA |
| Victoria Road North | PO5 1PL PO5 1PP PO5 1PS PO5 1PW PO5 1PH |
| Waltham Street | PO5 4BE |
| Warwick Crescent | PO5 4PB PO5 4BF PO5 4PD PO5 4PE PO5 4PF |
| Waterloo Street | PO5 4HR PO5 4HS |
| Wellington Street | PO5 4HT |
| Wilberforce Road | PO5 3DR |
| Wiltshire Street | PO5 4AH |
| Windsor Lane | PO5 1HF PO5 1HJ PO5 1HQ |
| Worcester Close | PO5 4QH |
| Worsley Road | PO5 3DY |
| Yarborough Road | PO5 3DZ PO5 3EA PO5 3FB |
| Yorke Street | PO5 4EJ PO5 4EL |
Transport near St Thomas
- FAQ
- Price Paid By Year
- Property Type Price
Frequently asked questions about St Thomas
What is the average price for a property for sale in St Thomas?
The average price for a property for sale in St Thomas is £264,186. This amount is 6% lower than the average price in Southsea. There are 3,188 property listings for sale in St Thomas.
What streets have the most expensive properties for sale in St Thomas?
The streets with the most expensive properties for sale in St Thomas are St Davids Road at an average of £590,714, St Edwards Road at an average of £554,791 and Wilberforce Road at an average of £532,400.
What streets have the most affordable properties for sale in St Thomas?
The streets with the most affordable properties for sale in St Thomas are Grove Road North at an average of £92,694, Little Southsea Street at an average of £111,333 and Elm Grove at an average of £124,064.
Which train stations are available in or near St Thomas?
Some of the train stations available in or near St Thomas are Portsmouth and Southsea, Fratton and Portsmouth Harbour.
Property Price Paid in St Thomas by Year
The average sold property price by year was:
| Year | Average Sold Price | Price Change |
Sold Properties
|
|---|---|---|---|
| 2025 | £259,973 | 8% |
70 Properties |
| 2024 | £239,846 | -8% |
79 Properties |
| 2023 | £258,427 | -11% |
107 Properties |
| 2022 | £287,228 | 17% |
123 Properties |
| 2021 | £237,408 | 10% |
137 Properties |
| 2020 | £214,137 | -2% |
121 Properties |
| 2019 | £217,803 | -2% |
118 Properties |
| 2018 | £221,088 | 9% |
126 Properties |
| 2017 | £201,620 | 3% |
144 Properties |
| 2016 | £195,246 | 0,1% |
159 Properties |
| 2015 | £195,093 | 15% |
149 Properties |
| 2014 | £166,348 | 1% |
133 Properties |
| 2013 | £164,474 | 6% |
110 Properties |
| 2012 | £154,777 | -3% |
73 Properties |
| 2011 | £159,218 | -9% |
69 Properties |
| 2010 | £173,303 | 13% |
85 Properties |
| 2009 | £150,243 | -4% |
91 Properties |
| 2008 | £155,649 | -4% |
112 Properties |
| 2007 | £161,691 | 12% |
216 Properties |
| 2006 | £142,598 | -1% |
233 Properties |
| 2005 | £144,478 | 0,2% |
187 Properties |
| 2004 | £144,232 | 10% |
209 Properties |
| 2003 | £129,499 | 15% |
210 Properties |
| 2002 | £110,335 | 18% |
272 Properties |
| 2001 | £90,537 | 12% |
241 Properties |
| 2000 | £79,571 | 15% |
236 Properties |
| 1999 | £67,861 | 10% |
260 Properties |
| 1998 | £61,129 | 7% |
233 Properties |
| 1997 | £56,674 | 13% |
208 Properties |
| 1996 | £49,579 | -0,4% |
173 Properties |
| 1995 | £49,756 | - |
151 Properties |
Property Price per Property Type in St Thomas
Here you can find historic sold price data in order to help with your property search.
The average Property Paid Price for specific property types in the last three years are:
| Property Type | Average Sold Price | Sold Properties |
|---|---|---|
| Flat | £152,989.00 | 220 Flats |
| Semi Detached House | £602,740.00 | 20 Semi Detached Houses |
| Detached House | £754,200.00 | 10 Detached Houses |
| Terraced House | £363,351.00 | 129 Terraced Houses |

