
Houses for sale & to rent in SO19 0QA, Montague Avenue, Bitterne, Southampton
House Prices in SO19 0QA, Montague Avenue, Bitterne
Properties in SO19 0QA have no sales history available within the last 3 years. SO19 0QA is a postcode in Montague Avenue located in Bitterne, an area in Southampton, City of Southampton, with 20 households².
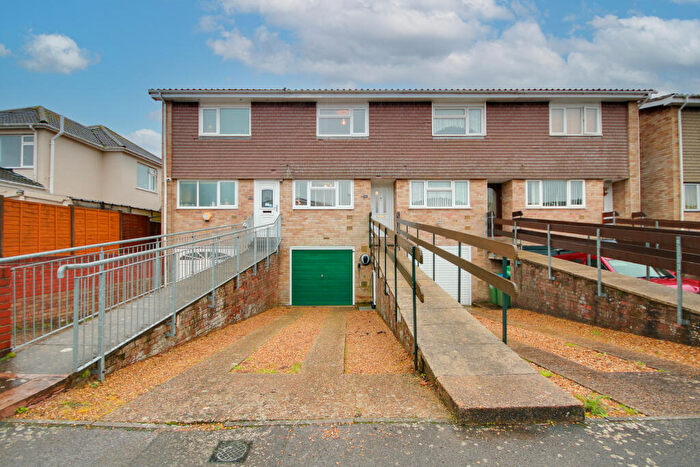
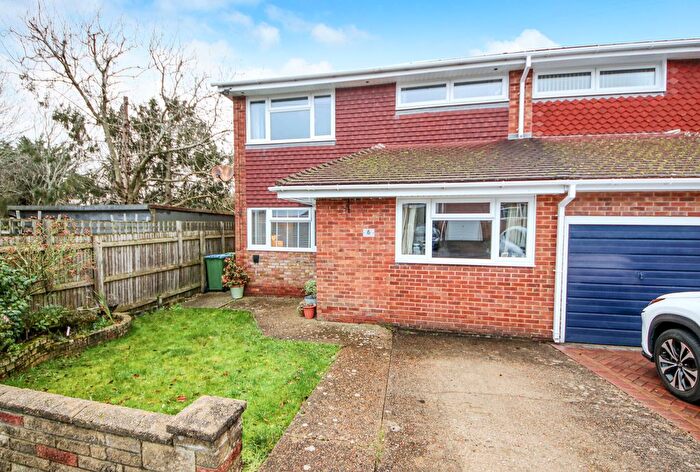
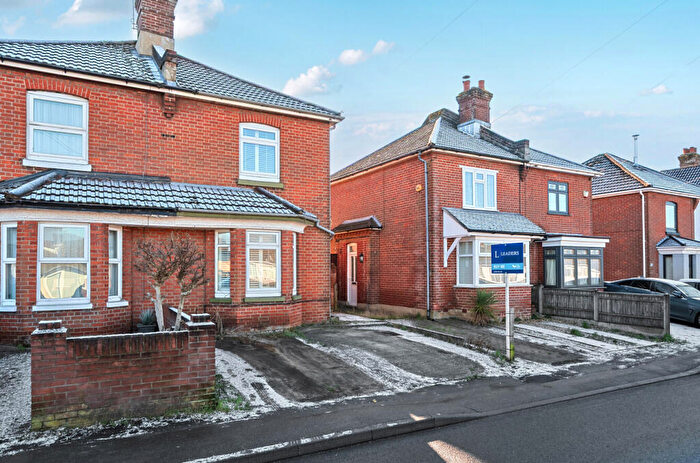
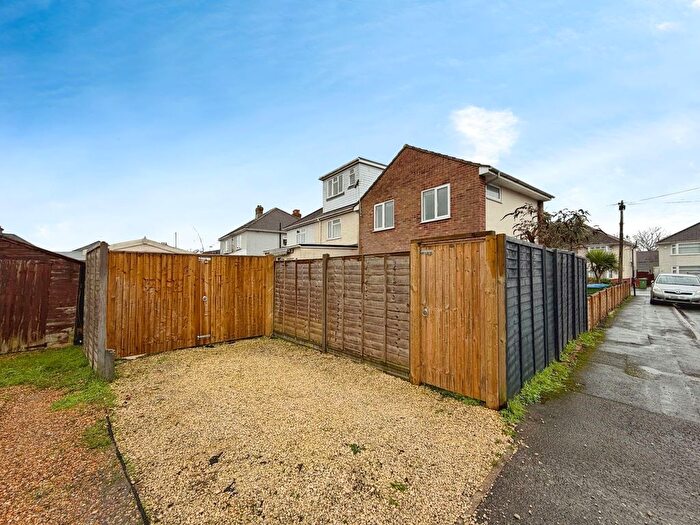
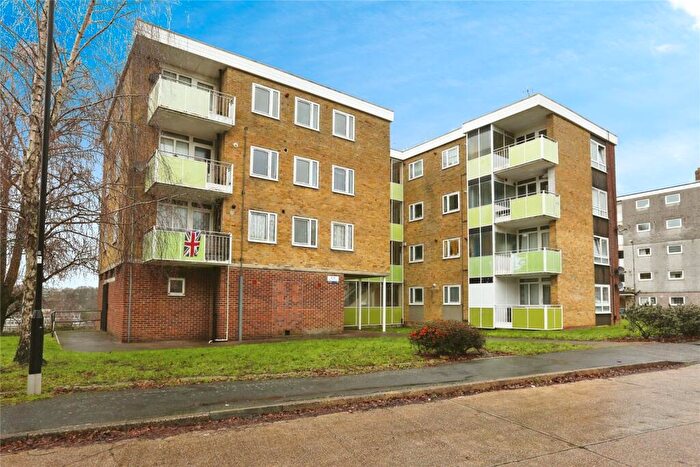
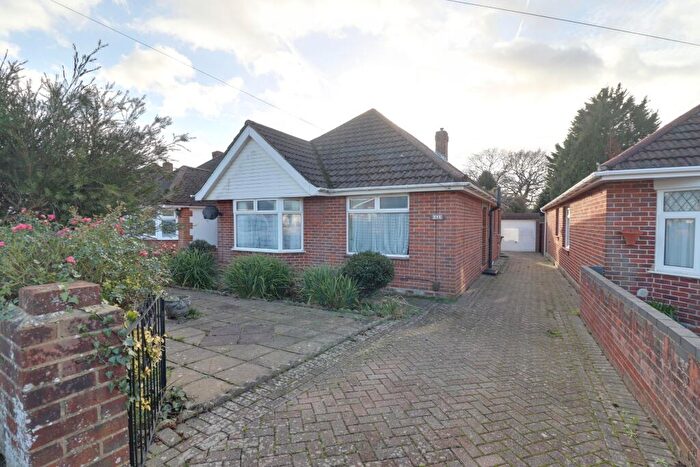
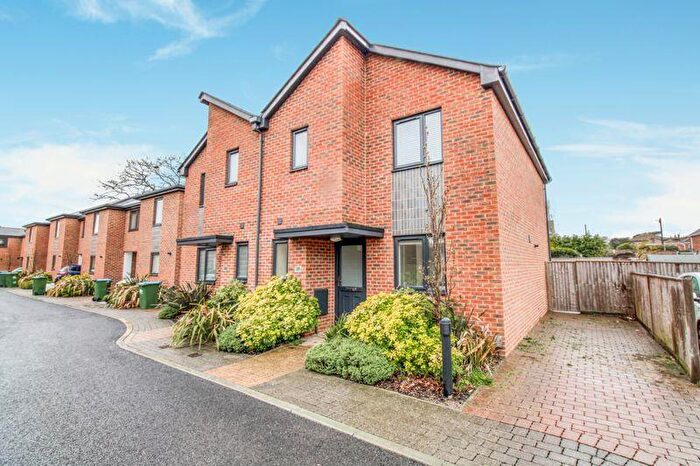
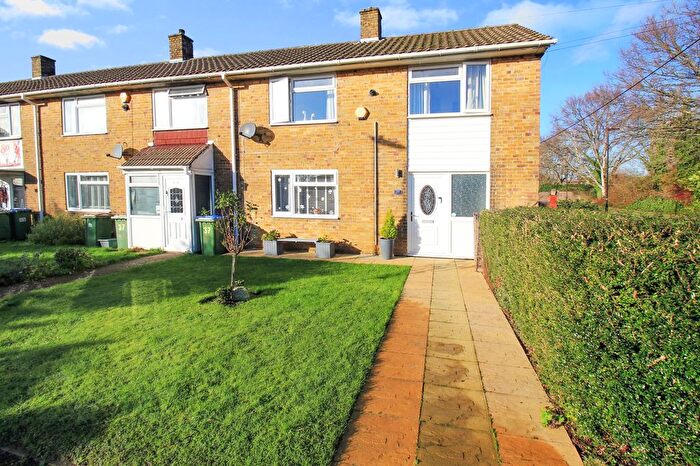
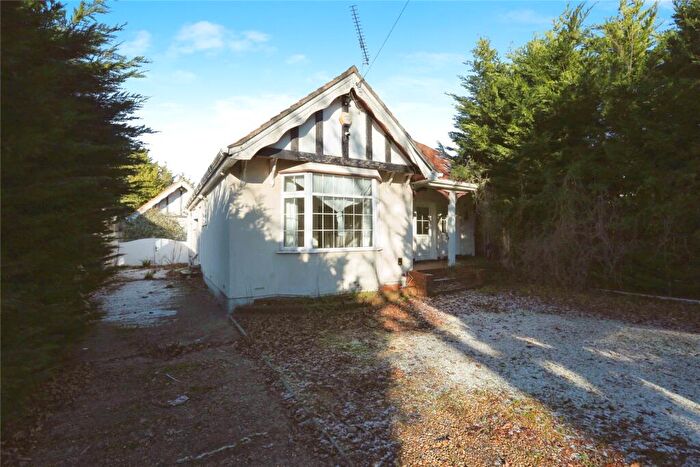
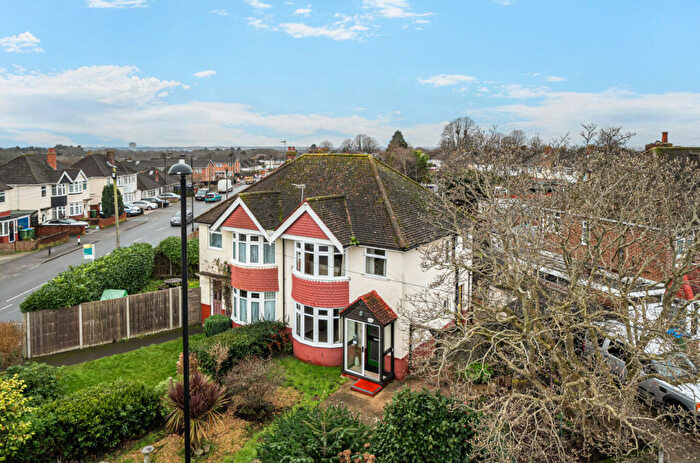
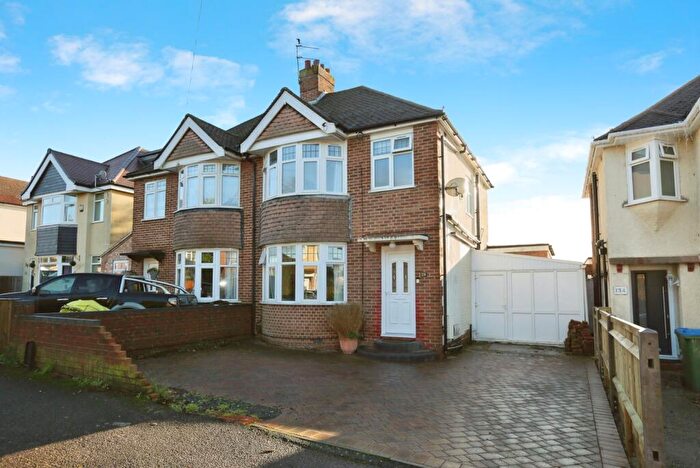
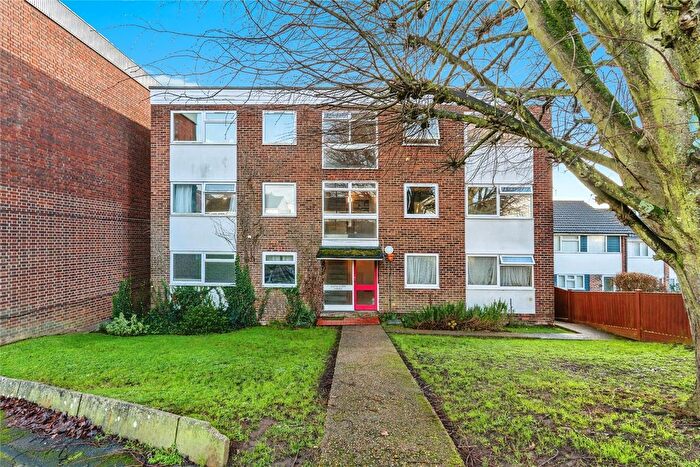
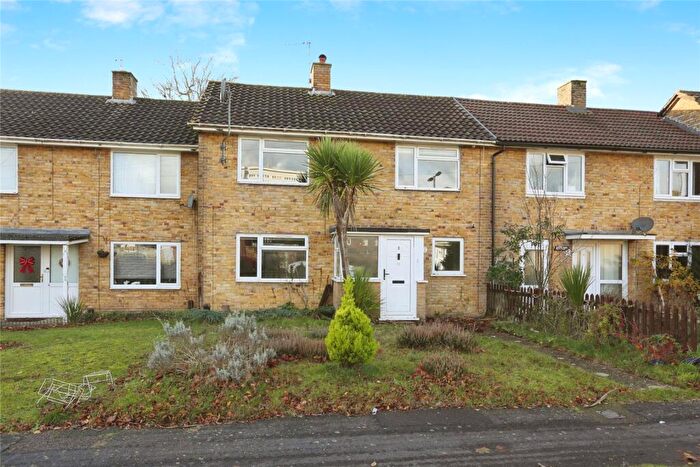
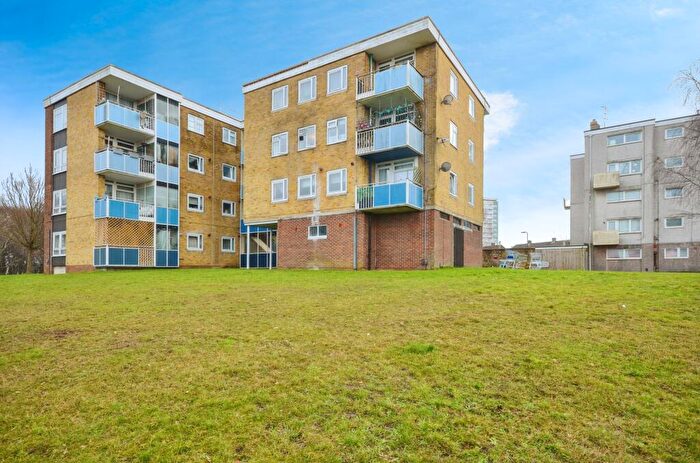
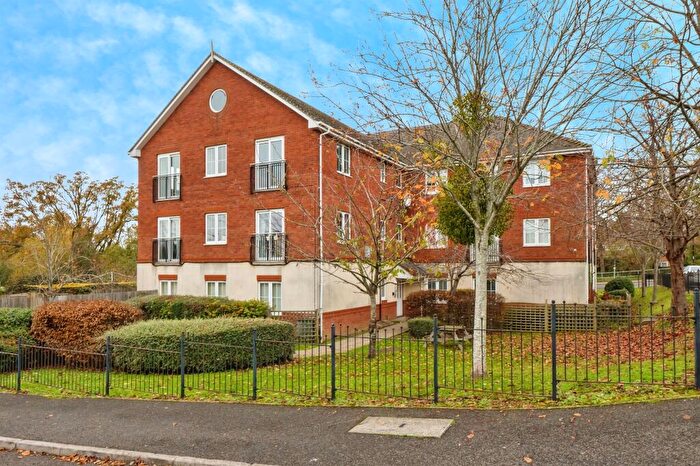
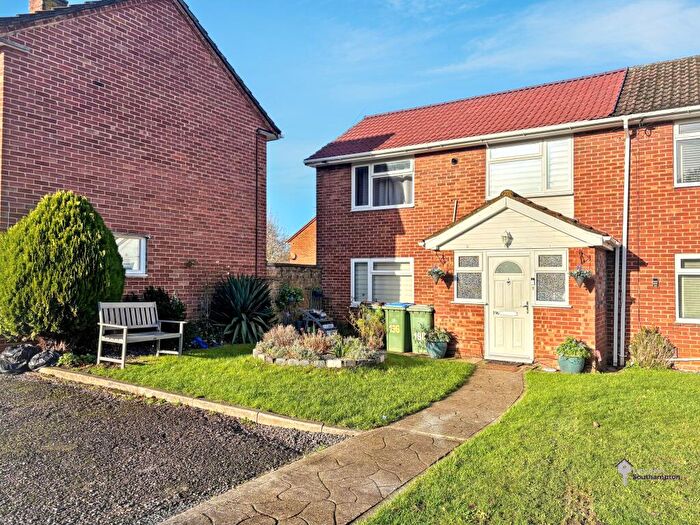
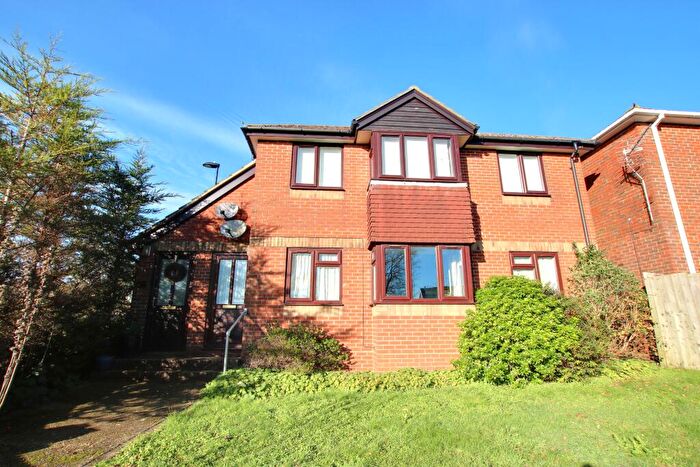
Properties for sale near SO19 0QA, Montague Avenue

![]()
If you are looking to sell your house, let it out, or receive a property valuation, an expert can help you.
Click the button below to get started.
Price Paid in Montague Avenue, SO19 0QA, Bitterne
60 Montague Avenue, SO19 0QA, Bitterne Southampton
Property 60 has been sold 4 times. The last time it was sold was in 09/01/2017 and the sold price was £115,000.00.
This flat, sold as a leasehold on 09/01/2017, is a 61 sqm mid-floor maisonette with an EPC rating of C.
| Date | Price | Property Type | Tenure | Classification |
|---|---|---|---|---|
| 09/01/2017 | £115,000.00 | Flat | leasehold | Established Building |
| 27/07/2007 | £110,000.00 | Flat | leasehold | Established Building |
| 05/05/2006 | £96,000.00 | Flat | leasehold | Established Building |
| 22/07/2005 | £87,000.00 | Flat | leasehold | Established Building |
58 Montague Avenue, SO19 0QA, Bitterne Southampton
Property 58 has been sold 1 time. The last time it was sold was in 10/07/1998 and the sold price was £22,000.00.
This flat, sold as a leasehold on 10/07/1998, is a 60 sqm mid-floor flat with an EPC rating of E.
| Date | Price | Property Type | Tenure | Classification |
|---|---|---|---|---|
| 10/07/1998 | £22,000.00 | Flat | leasehold | Established Building |
84 Montague Avenue, SO19 0QA, Bitterne Southampton
This is a 61 square meter Mid-floor Maisonette with an EPC rating of C. Currently, there is no transaction history available for this property.
64 MONTAGUE AVENUE SOUTHAMPTON, SO19 0QA, Bitterne Southampton
This is a 61 square meter Top-floor Maisonette with an EPC rating of D. Currently, there is no transaction history available for this property.
92 MONTAGUE AVENUE, SO19 0QA, Bitterne Southampton
This is a 60 square meter Top-floor Maisonette with an EPC rating of C. Currently, there is no transaction history available for this property.
Postcodes in Montague Avenue, Bitterne
Navigate through other locations in Montague Avenue, Bitterne, Southampton to see more property listings for sale or to rent.
Transport near SO19 0QA, Montague Avenue
-
 Sholing Station
 -
Woolston Station
-
Netley Station
-
Bursledon Station
-
Hamble Station
-
Bitterne Station
-
St.Denys Station
-
Hedge End Station
House price paid reports for SO19 0QA, Montague Avenue
Click on the buttons below to see price paid reports by year or property price:
- Price Paid By Year
Property Price Paid in SO19 0QA, Montague Avenue by Year
The average sold property price by year was:
| Year | Average Sold Price | Price Change |
Sold Properties
|
|---|---|---|---|
| 2017 | £115,000 | 4% |
1 Property |
| 2007 | £110,000 | 13% |
1 Property |
| 2006 | £96,000 | 9% |
1 Property |
| 2005 | £87,000 | 75% |
1 Property |
| 1998 | £22,000 | - |
1 Property |