
Houses for sale & to rent in SO16 9JY, Boniface Crescent, Redbridge, Southampton
House Prices in SO16 9JY, Boniface Crescent, Redbridge
Properties in SO16 9JY have no sales history available within the last 3 years. SO16 9JY is a postcode in Boniface Crescent located in Redbridge, an area in Southampton, City of Southampton, with 15 households².
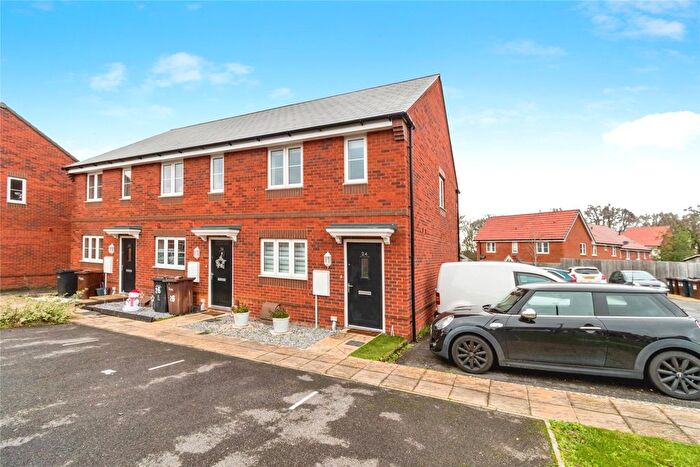
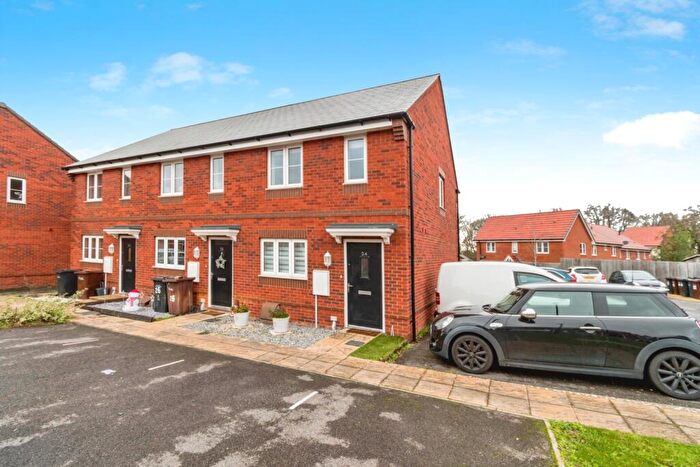
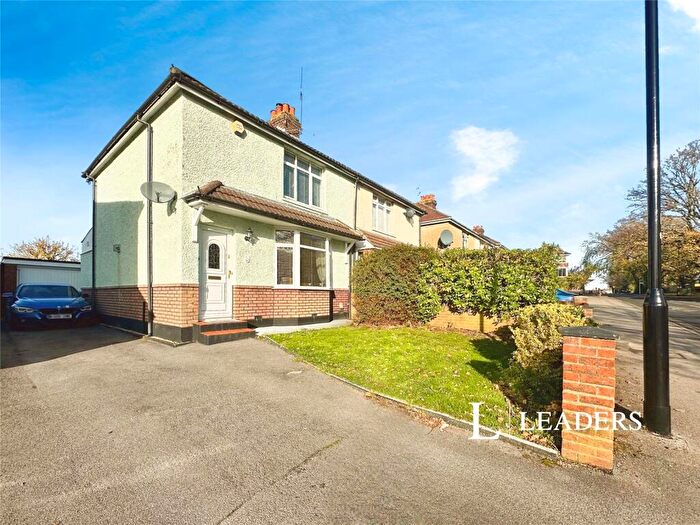
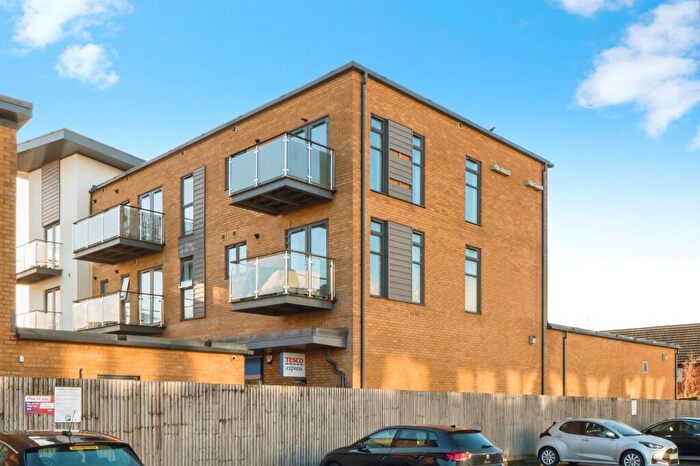
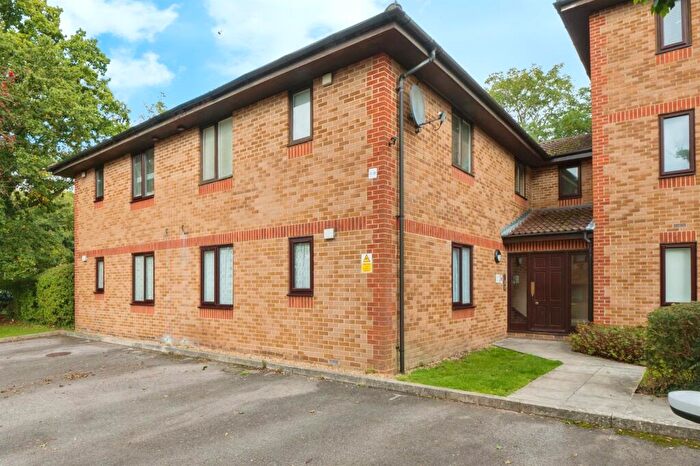
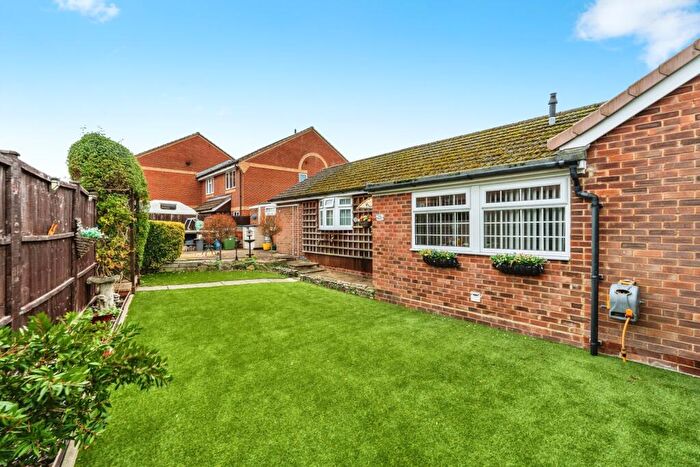
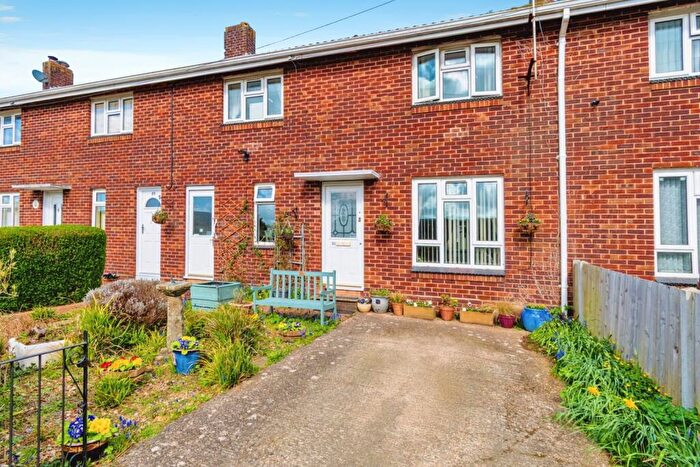
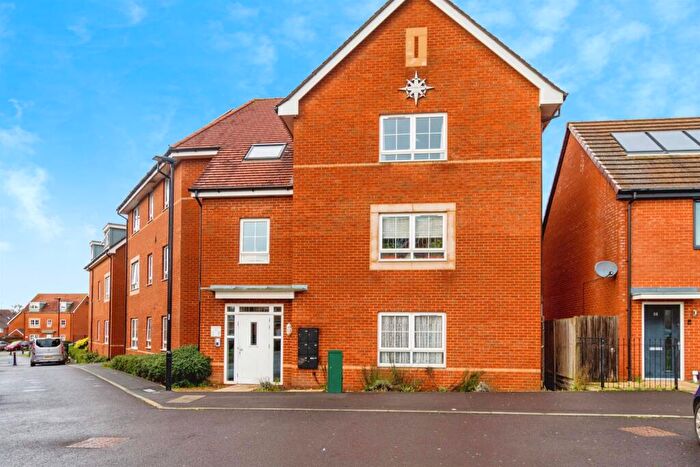
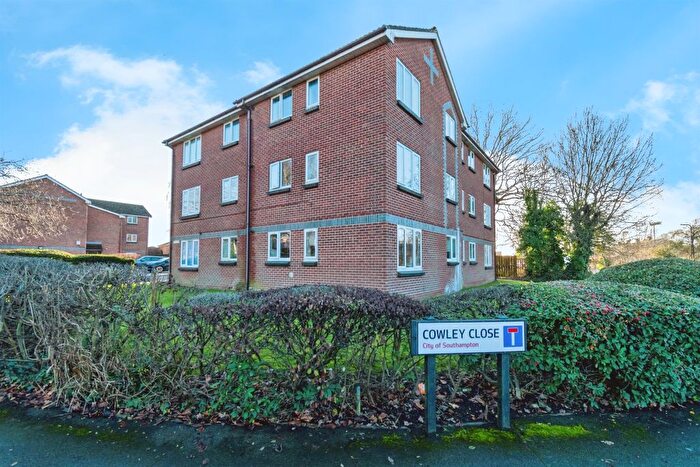
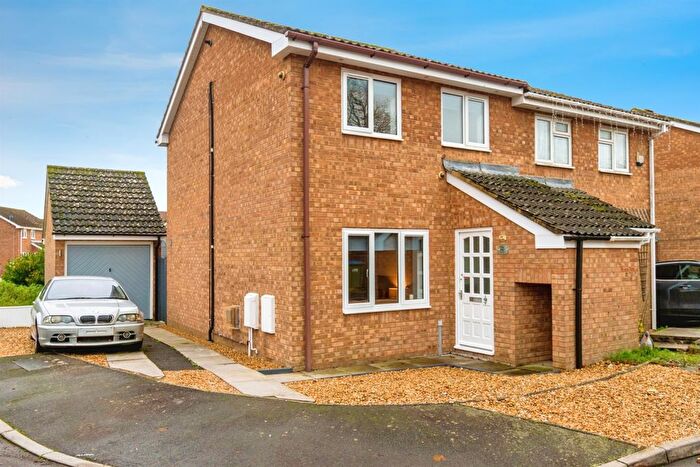
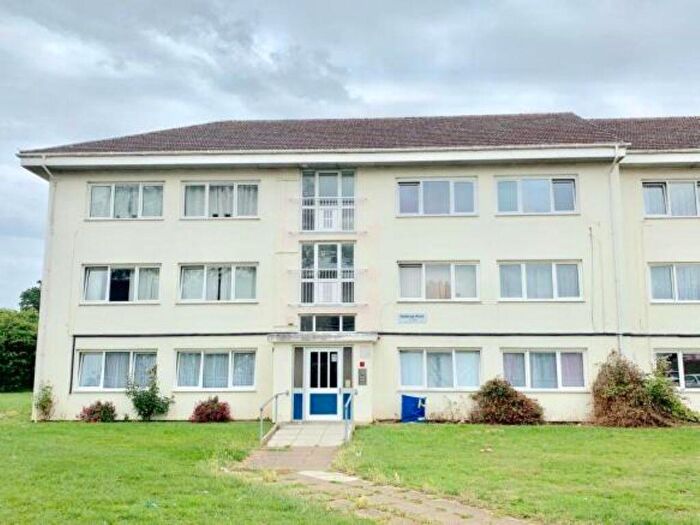
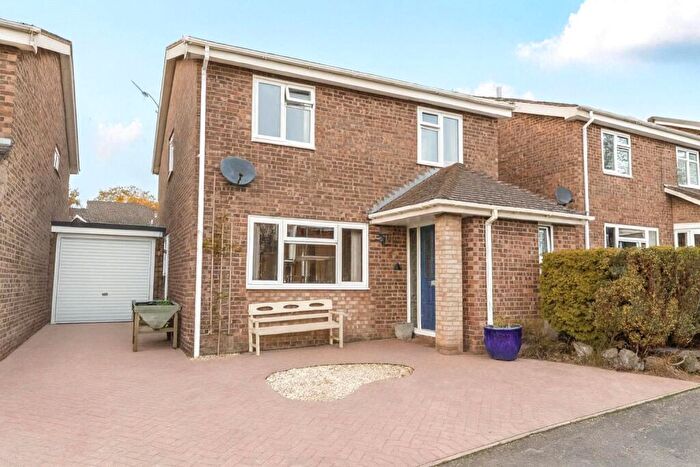
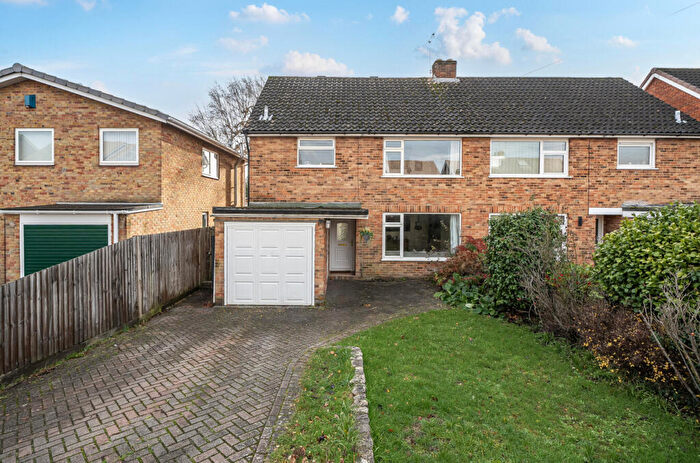
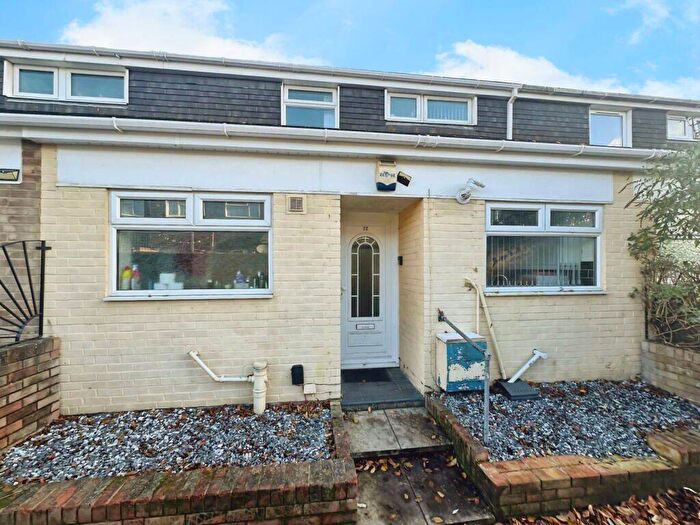
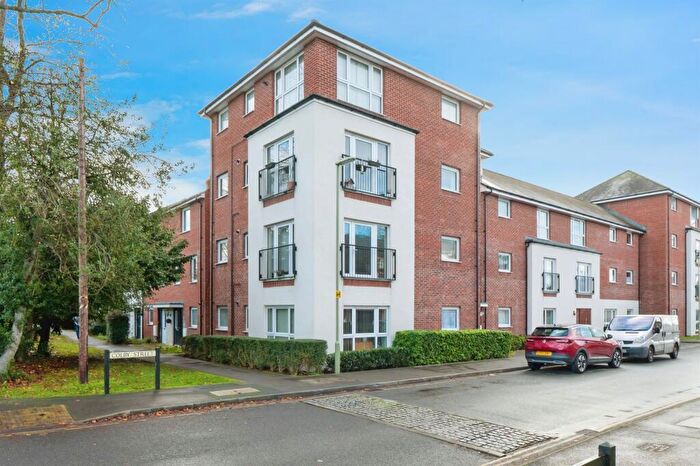
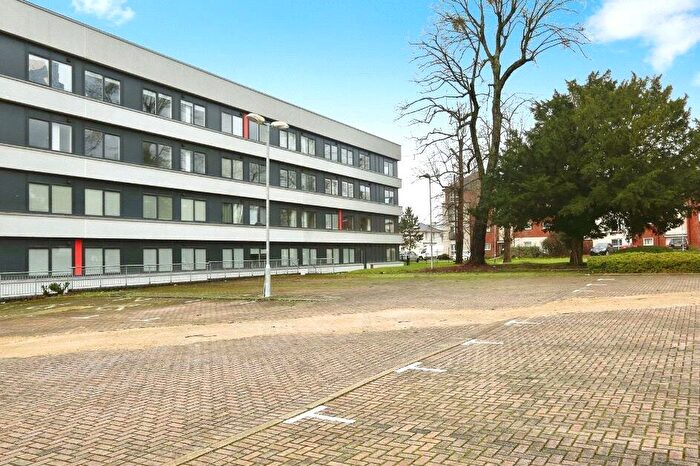
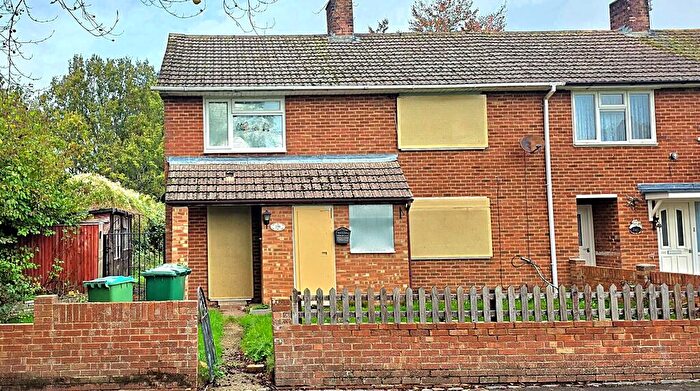
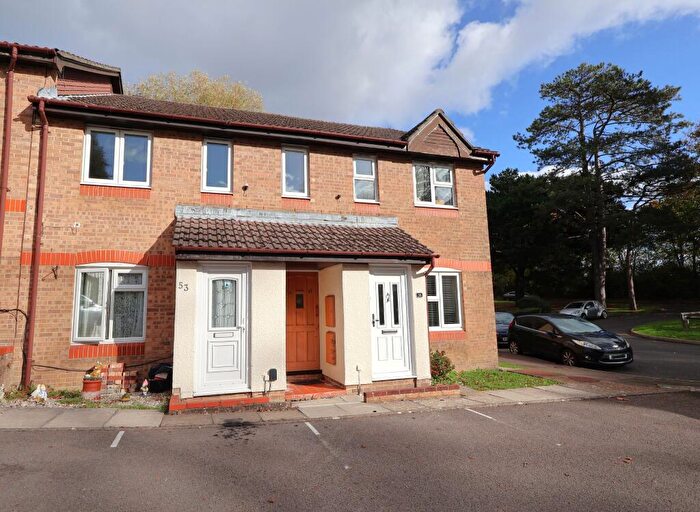
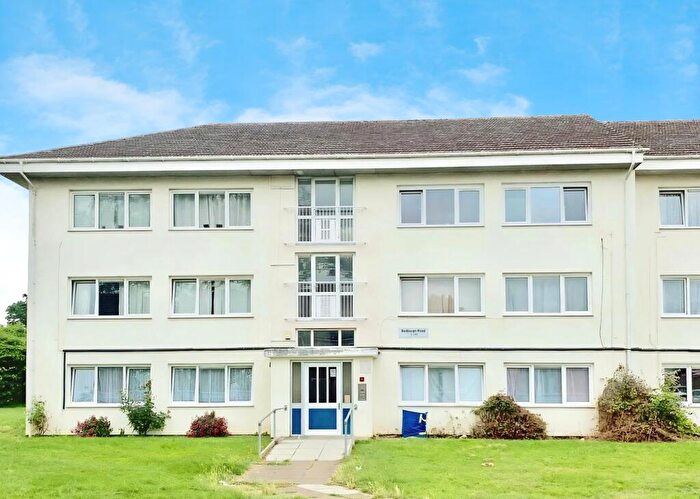
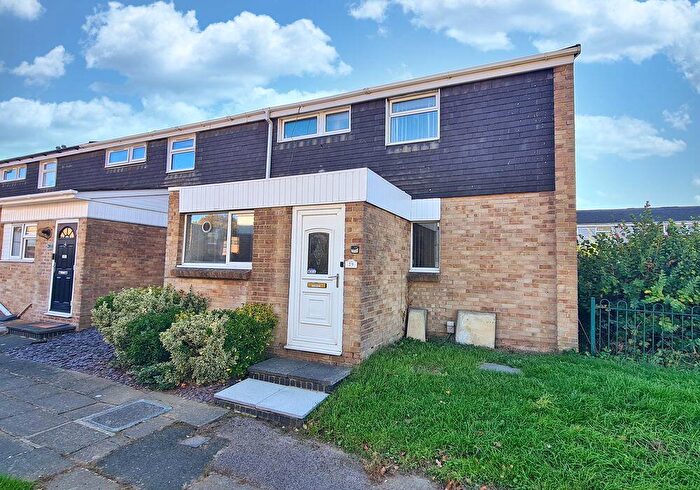
Properties for sale near SO16 9JY, Boniface Crescent


![]()
If you are looking to sell your house, let it out, or receive a property valuation, an expert can help you.
Click the button below to get started.

Price Paid in Boniface Crescent, SO16 9JY, Redbridge
PORTELET HOUSE FLAT 14 Boniface Crescent, SO16 9JY, Redbridge Southampton
Property PORTELET HOUSE FLAT 14 has been sold 1 time. The last time it was sold was in 13/11/2013 and the sold price was £94,500.00.
This is a Flat which was sold as a leasehold in 13/11/2013
| Date | Price | Property Type | Tenure | Classification |
|---|---|---|---|---|
| 13/11/2013 | £94,500.00 | Flat | leasehold | Established Building |
PORTELET HOUSE FLAT 11 Boniface Crescent, SO16 9JY, Redbridge Southampton
Property PORTELET HOUSE FLAT 11 has been sold 2 times. The last time it was sold was in 31/10/2008 and the sold price was £99,000.00.
This is a Flat which was sold as a leasehold in 31/10/2008
| Date | Price | Property Type | Tenure | Classification |
|---|---|---|---|---|
| 31/10/2008 | £99,000.00 | Flat | leasehold | Established Building |
| 04/09/2000 | £54,000.00 | Flat | leasehold | Established Building |
PORTELET HOUSE FLAT 12 Boniface Crescent, SO16 9JY, Redbridge Southampton
Property PORTELET HOUSE FLAT 12 has been sold 1 time. The last time it was sold was in 05/03/2004 and the sold price was £96,500.00.
This is a Flat which was sold as a leasehold in 05/03/2004
| Date | Price | Property Type | Tenure | Classification |
|---|---|---|---|---|
| 05/03/2004 | £96,500.00 | Flat | leasehold | Established Building |
Transport near SO16 9JY, Boniface Crescent

House price paid reports for SO16 9JY, Boniface Crescent
Click on the buttons below to see price paid reports by year or property price:
- Price Paid By Year
Property Price Paid in SO16 9JY, Boniface Crescent by Year
The average sold property price by year was:
| Year | Average Sold Price | Price Change |
Sold Properties
|
|---|---|---|---|
| 2013 | £94,500 | -5% |
1 Property |
| 2008 | £99,000 | 3% |
1 Property |
| 2004 | £96,500 | 44% |
1 Property |
| 2000 | £54,000 | - |
1 Property |