
Houses for sale & to rent in ST2 0LP, Winchester Avenue, Bentilee And Ubberley, Stoke-on-trent
House Prices in ST2 0LP, Winchester Avenue, Bentilee And Ubberley
Properties in ST2 0LP have no sales history available within the last 3 years. ST2 0LP is a postcode in Winchester Avenue located in Bentilee And Ubberley, an area in Stoke-on-trent, City of Stoke-on-Trent, with 6 households².
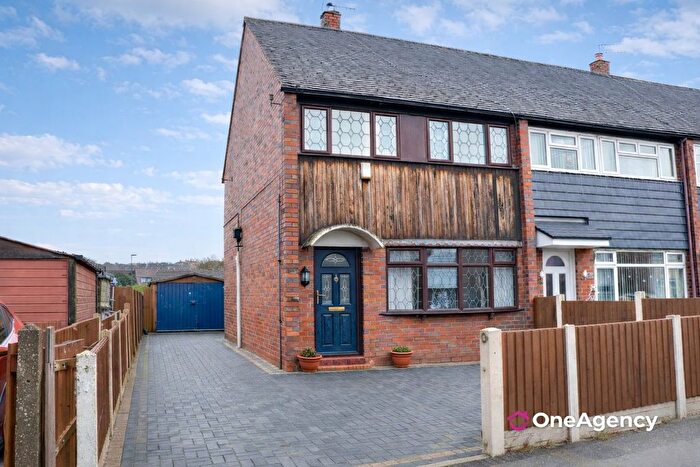
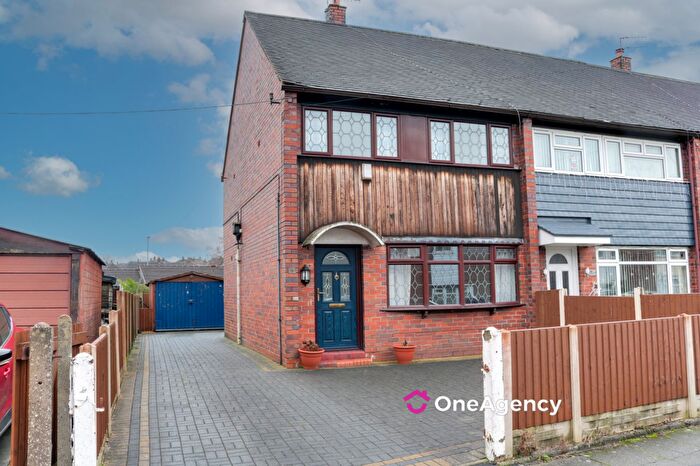
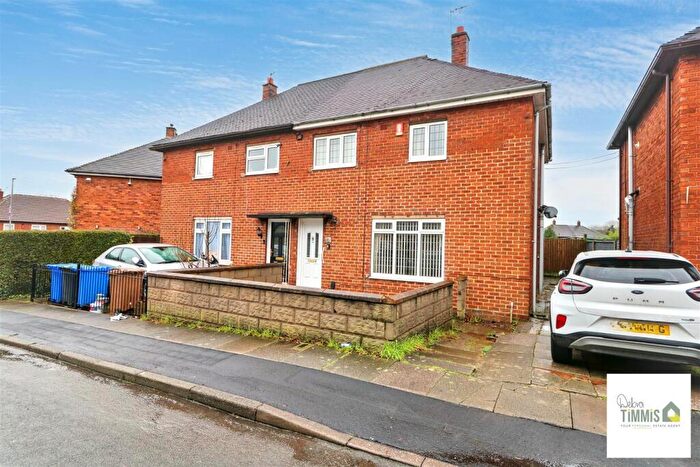
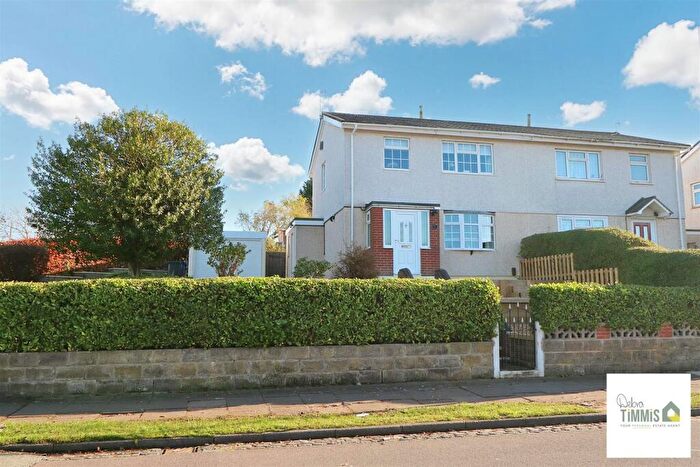
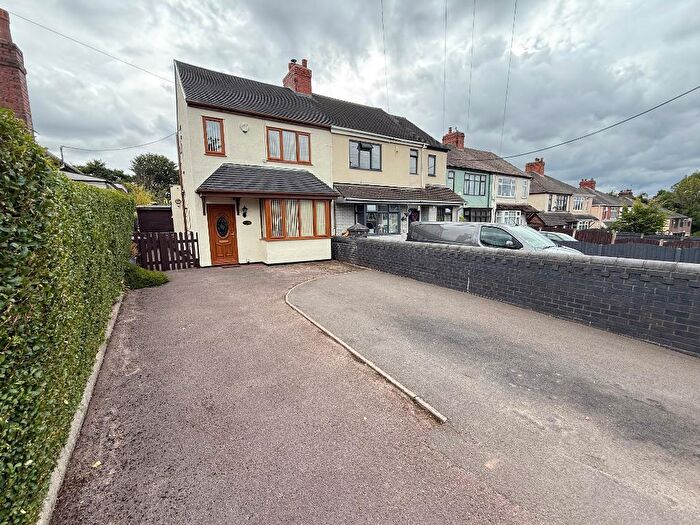
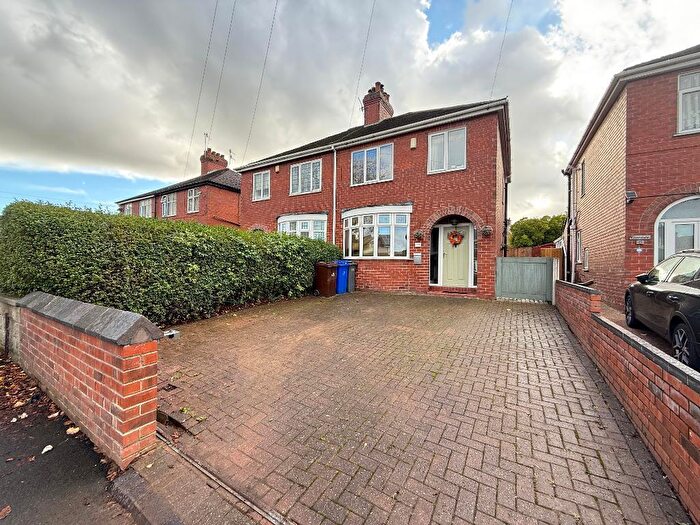
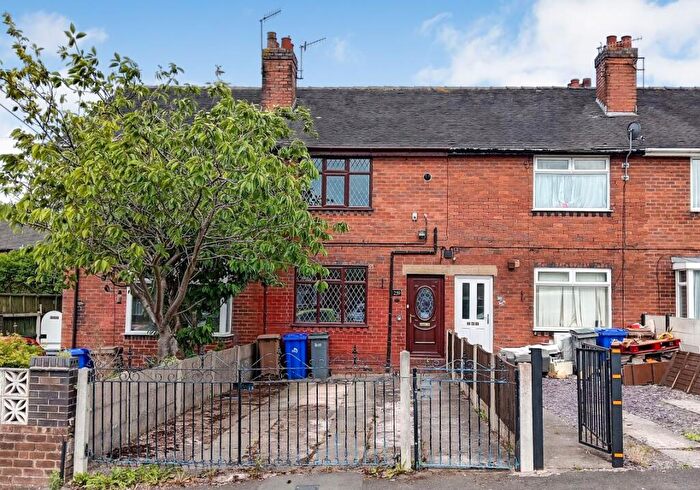
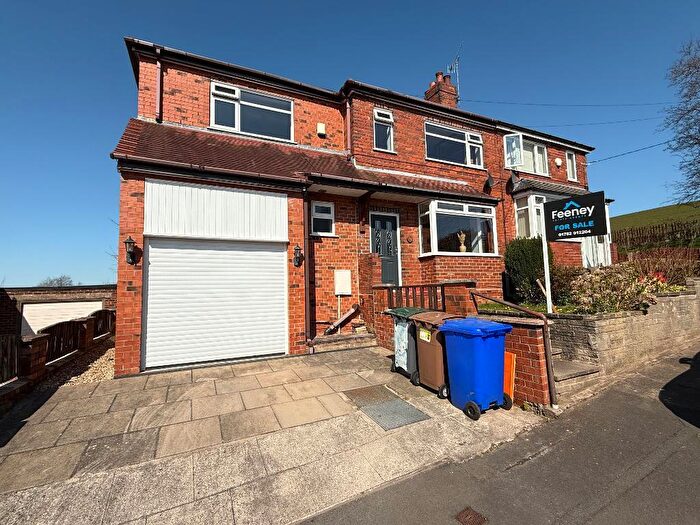
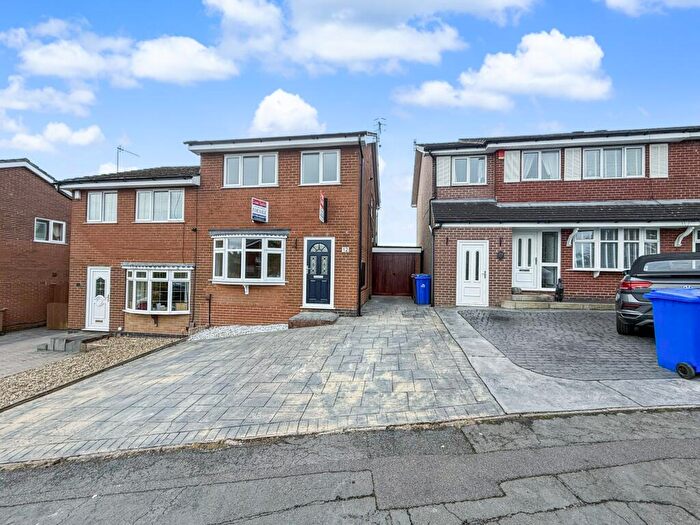
Properties for sale near ST2 0LP, Winchester Avenue

![]()
If you are looking to sell your house, let it out, or receive a property valuation, an expert can help you.
Click the button below to get started.
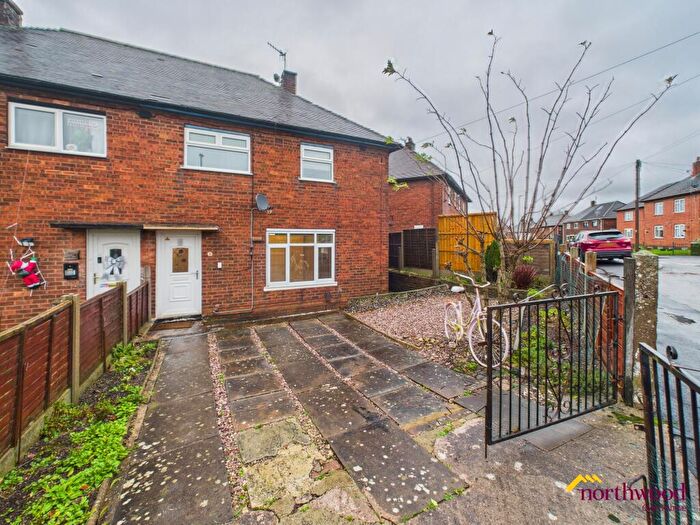
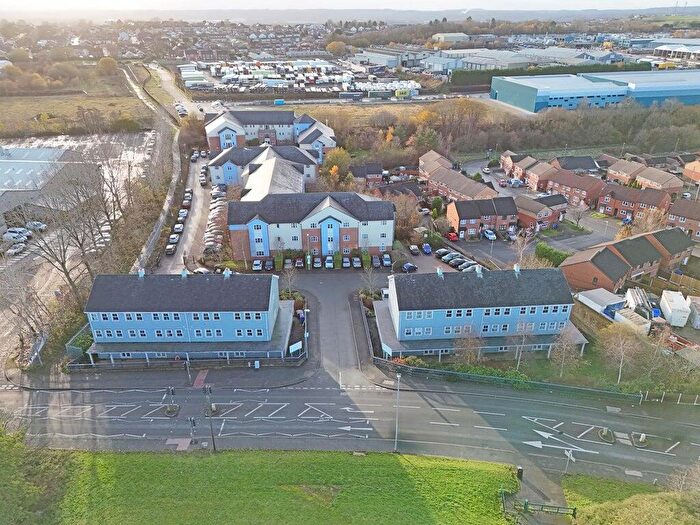
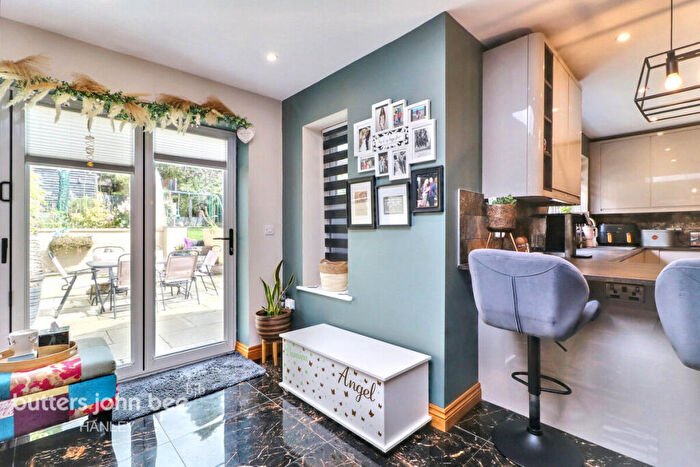
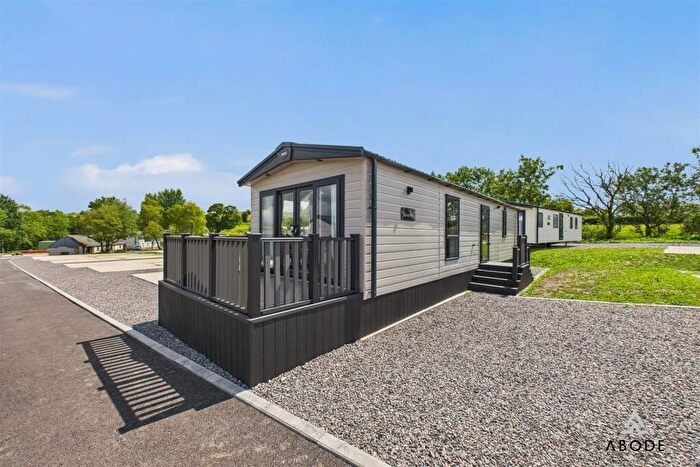
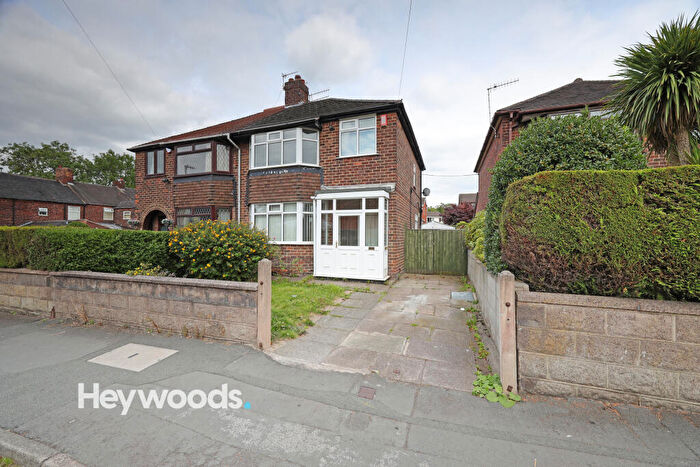
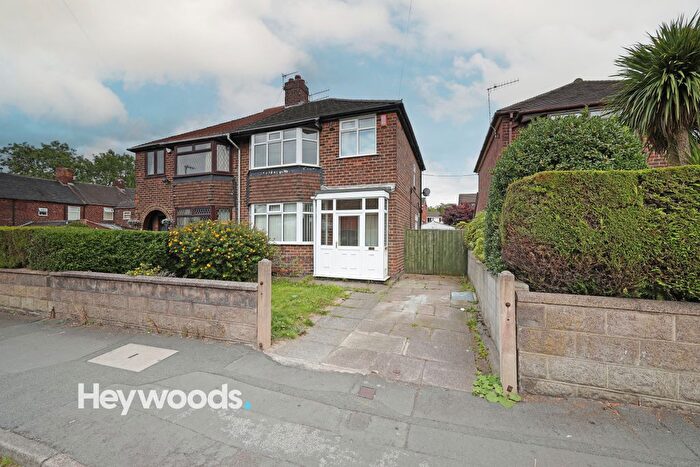
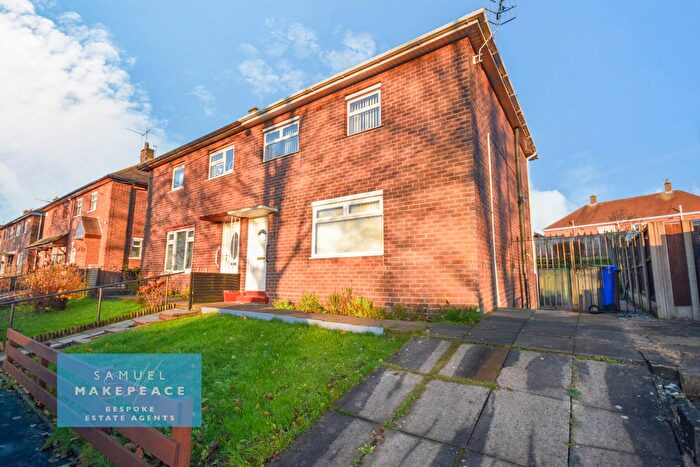
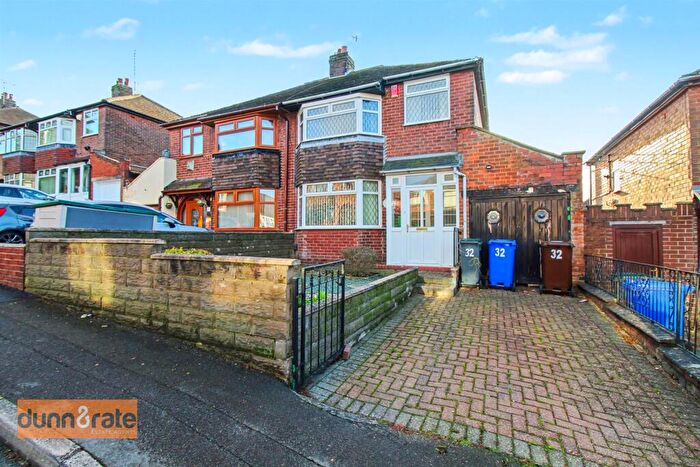
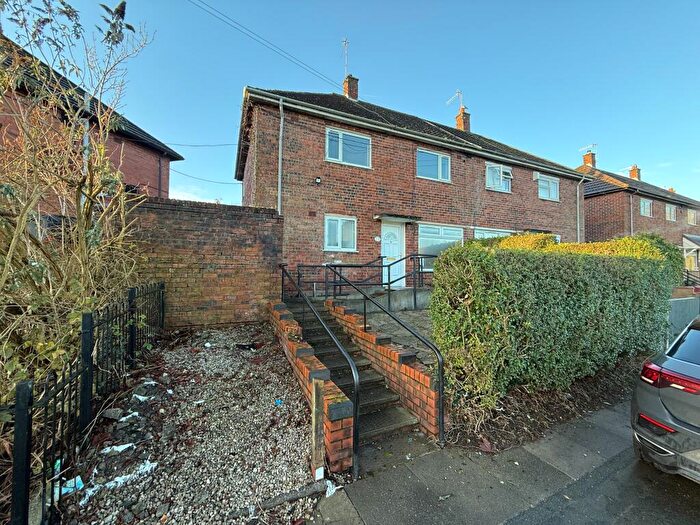
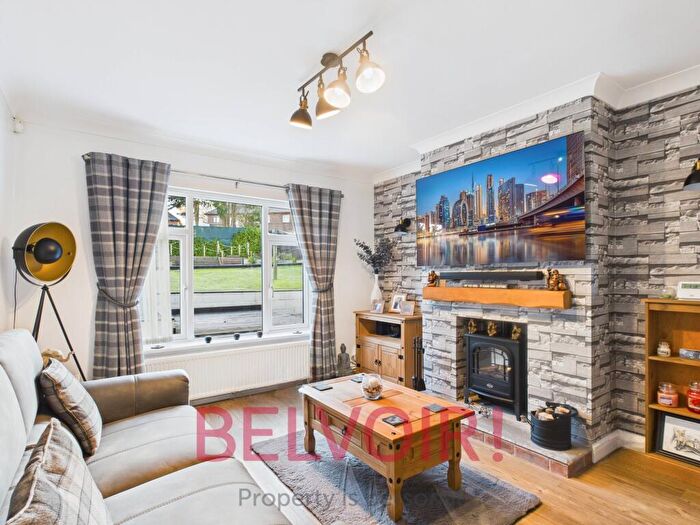
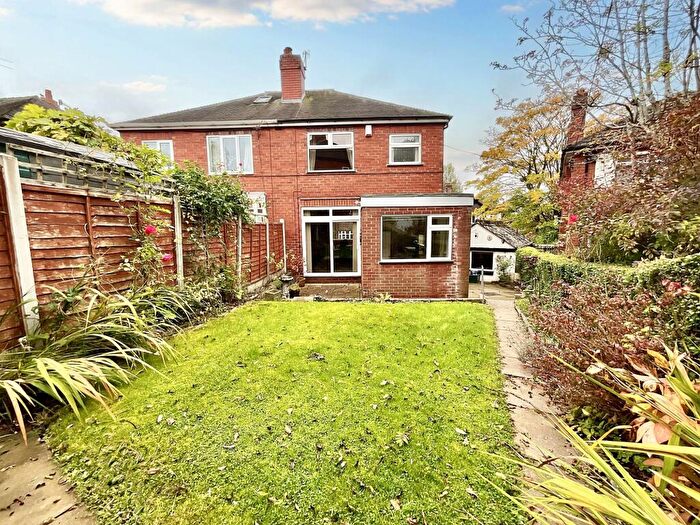
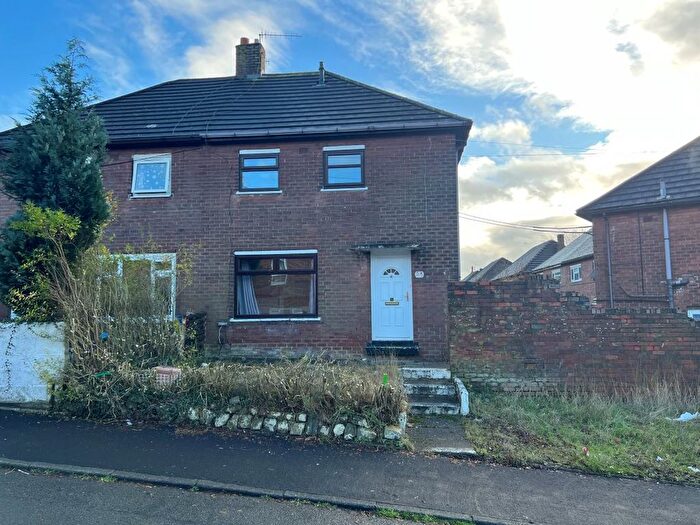
Previously listed properties near ST2 0LP, Winchester Avenue

![]()
If you are looking to sell your house, let it out, or receive a property valuation, an expert can help you.
Click the button below to get started.
Price Paid in Winchester Avenue, ST2 0LP, Bentilee And Ubberley
128 Winchester Avenue, ST2 0LP, Bentilee And Ubberley Stoke-on-trent
Property 128 has been sold 1 time. The last time it was sold was in 06/09/2013 and the sold price was £40,000.00.
This semi detached house, sold as a freehold on 06/09/2013, is a 94 sqm semi-detached house with an EPC rating of C.
| Date | Price | Property Type | Tenure | Classification |
|---|---|---|---|---|
| 06/09/2013 | £40,000.00 | Semi Detached House | freehold | Established Building |
130 Winchester Avenue, ST2 0LP, Bentilee And Ubberley Stoke-on-trent
Property 130 has been sold 3 times. The last time it was sold was in 07/04/2006 and the sold price was £65,000.00.
This semi detached house, sold as a freehold on 07/04/2006, is a 75 sqm semi-detached house with an EPC rating of C.
| Date | Price | Property Type | Tenure | Classification |
|---|---|---|---|---|
| 07/04/2006 | £65,000.00 | Semi Detached House | freehold | Established Building |
| 30/06/2005 | £54,000.00 | Semi Detached House | freehold | Established Building |
| 30/04/2004 | £50,000.00 | Semi Detached House | freehold | Established Building |
132 Winchester Avenue, ST2 0LP, Bentilee And Ubberley Stoke-on-trent
This is a 84 square meter Semi-detached House with an EPC rating of E. Currently, there is no transaction history available for this property.
134 Winchester Avenue, ST2 0LP, Bentilee And Ubberley Stoke-on-trent
This is a 84 square meter Semi-detached House with an EPC rating of C. Currently, there is no transaction history available for this property.
124 Winchester Avenue, ST2 0LP, Bentilee And Ubberley Stoke-on-trent
This is a 92 square meter Semi-detached House with an EPC rating of C. Currently, there is no transaction history available for this property.
120 Winchester Avenue, ST2 0LP, Bentilee And Ubberley Stoke-on-trent
This is a 92 square meter Semi-detached House with an EPC rating of C. Currently, there is no transaction history available for this property.
Postcodes in Winchester Avenue, Bentilee And Ubberley
Navigate through other locations in Winchester Avenue, Bentilee And Ubberley, Stoke-on-trent to see more property listings for sale or to rent.
Transport near ST2 0LP, Winchester Avenue

House price paid reports for ST2 0LP, Winchester Avenue
Click on the buttons below to see price paid reports by year or property price:
- Price Paid By Year
Property Price Paid in ST2 0LP, Winchester Avenue by Year
The average sold property price by year was:
| Year | Average Sold Price | Price Change |
Sold Properties
|
|---|---|---|---|
| 2013 | £40,000 | -63% |
1 Property |
| 2006 | £65,000 | 17% |
1 Property |
| 2005 | £54,000 | 7% |
1 Property |
| 2004 | £50,000 | - |
1 Property |