
Houses for sale & to rent in City of Stoke-on-Trent, England
House Prices in City of Stoke-on-Trent
Properties in City of Stoke-on-Trent have
an average house price of
£146k
and had 10,090 Property Transactions
within the last 3 years.¹
City of Stoke-on-Trent is a location in
England with
105,532 households², where the most expensive property was sold for £850k.
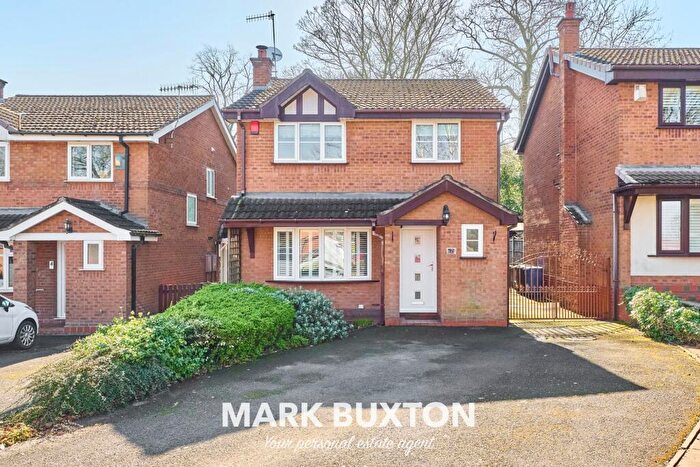
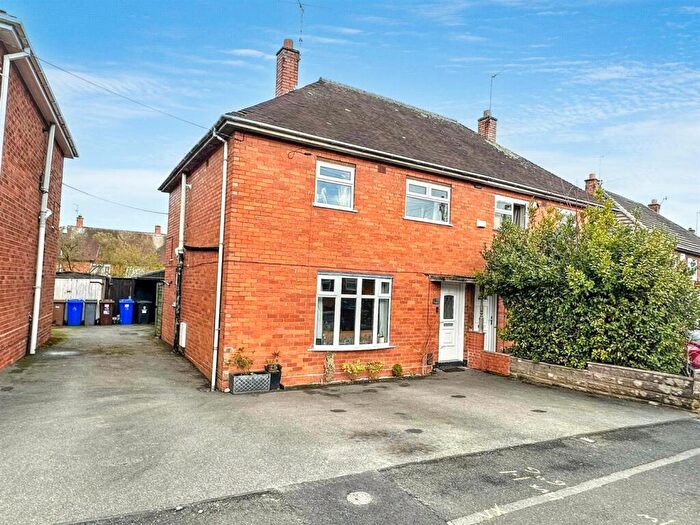
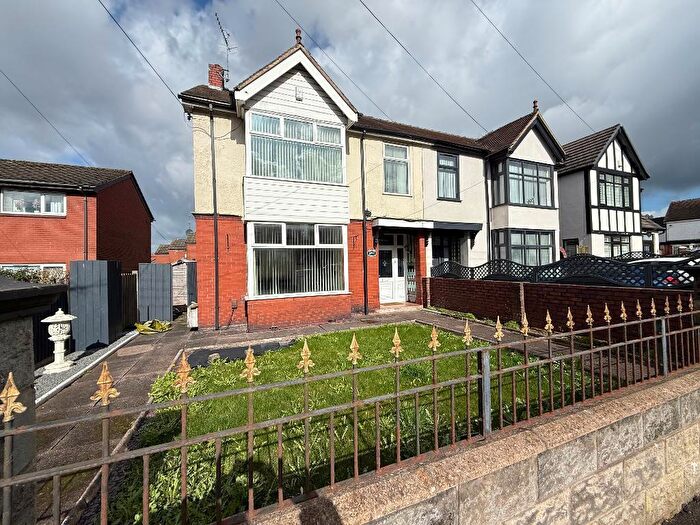
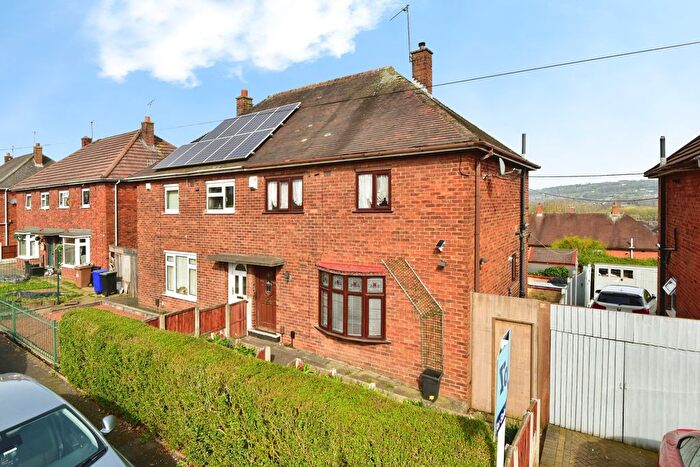
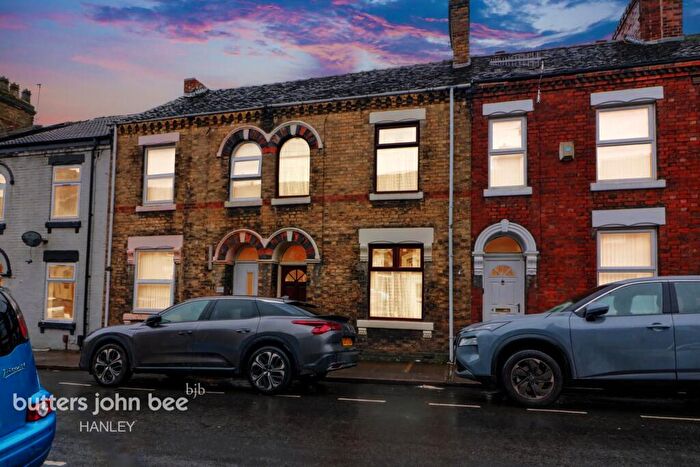
Properties for sale in City of Stoke-on-Trent
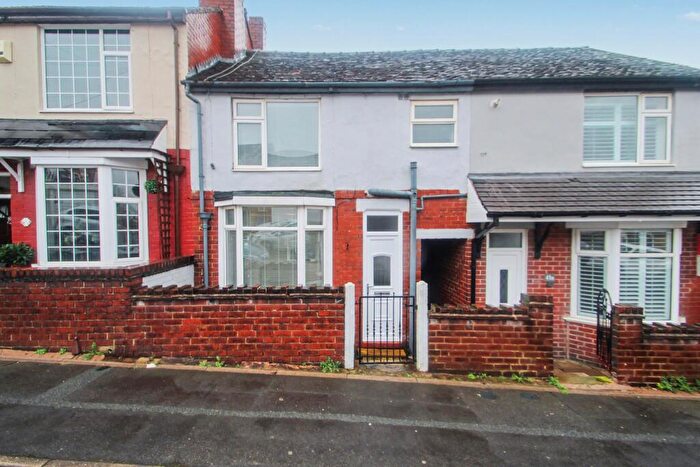
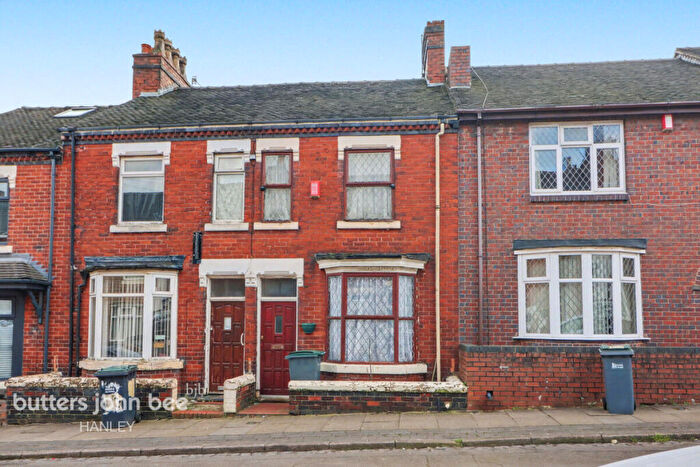
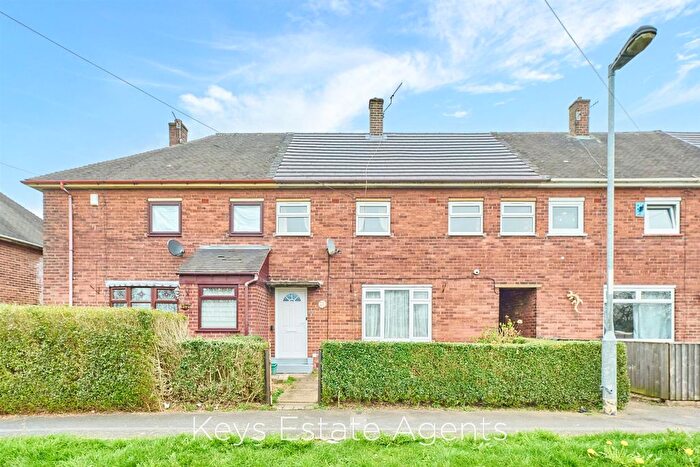

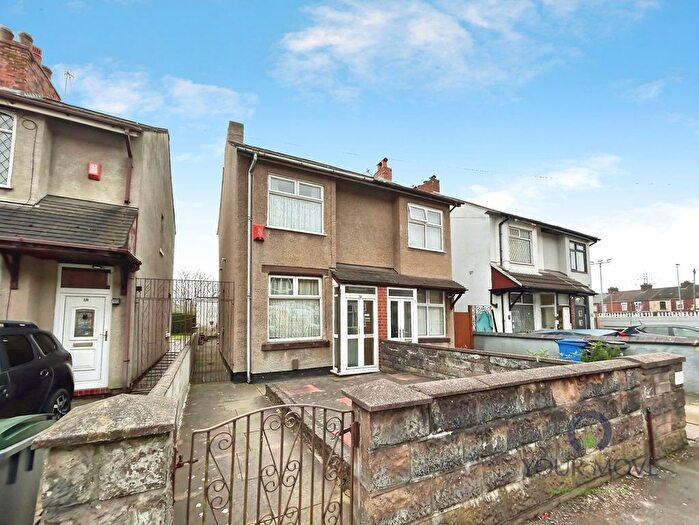
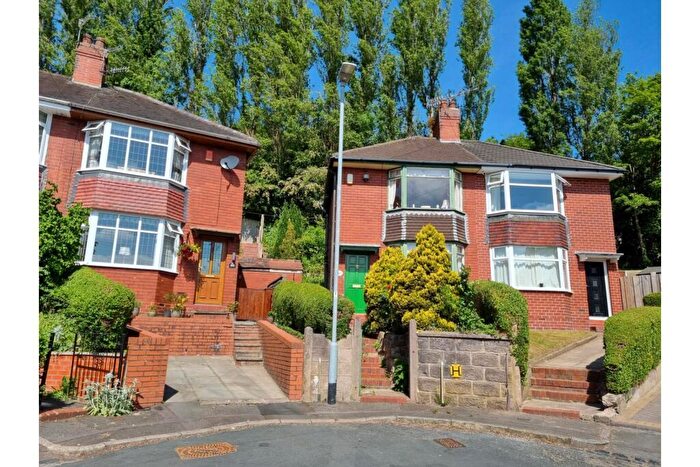
![]()
If you are looking to sell your house, let it out, or receive a property valuation, an expert can help you.
Click the button below to get started.

Towns in City of Stoke-on-Trent
Navigate through our locations to find the location of your next house in City of Stoke-on-Trent, England for sale or to rent.
Transport in City of Stoke-on-Trent
Please see below transportation links in this area:

- FAQ
- Price Paid By Year
- Property Type Price
Frequently asked questions about City of Stoke-on-Trent
What is the average price for a property for sale in City of Stoke-on-Trent?
The average price for a property for sale in City of Stoke-on-Trent is £145,762. This amount is 59% lower than the average price in England. There are more than 10,000 property listings for sale in City of Stoke-on-Trent.
Which train stations are available in or near City of Stoke-on-Trent?
Some of the train stations available in or near City of Stoke-on-Trent are Stoke-On-Trent, Longton and Longport.
Property Price Paid in City of Stoke-on-Trent by Year
The average sold property price by year was:
| Year | Average Sold Price | Price Change |
Sold Properties
|
|---|---|---|---|
| 2026 | £153,891 | 1% |
74 Properties |
| 2025 | £152,180 | 4% |
3,000 Properties |
| 2024 | £146,557 | 5% |
3,496 Properties |
| 2023 | £139,331 | -0,3% |
3,520 Properties |
| 2022 | £139,806 | 3% |
4,137 Properties |
| 2021 | £135,238 | 8% |
4,550 Properties |
| 2020 | £124,731 | 4% |
3,356 Properties |
| 2019 | £119,843 | 2% |
3,979 Properties |
| 2018 | £117,354 | 3% |
4,143 Properties |
| 2017 | £114,121 | 3% |
4,178 Properties |
| 2016 | £110,573 | 4% |
3,984 Properties |
| 2015 | £106,584 | 6% |
3,754 Properties |
| 2014 | £100,492 | -0,3% |
3,660 Properties |
| 2013 | £100,756 | 3% |
2,845 Properties |
| 2012 | £98,185 | 1% |
2,289 Properties |
| 2011 | £97,442 | -2% |
2,238 Properties |
| 2010 | £99,471 | 1% |
2,266 Properties |
| 2009 | £98,489 | -6% |
2,231 Properties |
| 2008 | £104,174 | -0,1% |
3,040 Properties |
| 2007 | £104,293 | 4% |
6,065 Properties |
| 2006 | £99,830 | 7% |
6,212 Properties |
| 2005 | £93,328 | 12% |
5,363 Properties |
| 2004 | £82,049 | 23% |
6,303 Properties |
| 2003 | £63,547 | 17% |
6,244 Properties |
| 2002 | £53,005 | 12% |
5,781 Properties |
| 2001 | £46,815 | 8% |
4,381 Properties |
| 2000 | £43,114 | 5% |
3,796 Properties |
| 1999 | £41,048 | 6% |
3,906 Properties |
| 1998 | £38,698 | 4% |
3,634 Properties |
| 1997 | £37,138 | 4% |
4,021 Properties |
| 1996 | £35,501 | -2% |
3,744 Properties |
| 1995 | £36,156 | - |
3,561 Properties |
Property Price per Property Type in City of Stoke-on-Trent
Here you can find historic sold price data in order to help with your property search.
The average Property Paid Price for specific property types in the last three years are:
| Property Type | Average Sold Price | Sold Properties |
|---|---|---|
| Semi Detached House | £161,378.00 | 3,880 Semi Detached Houses |
| Terraced House | £106,266.00 | 4,453 Terraced Houses |
| Detached House | £259,419.00 | 1,285 Detached Houses |
| Flat | £80,579.00 | 472 Flats |