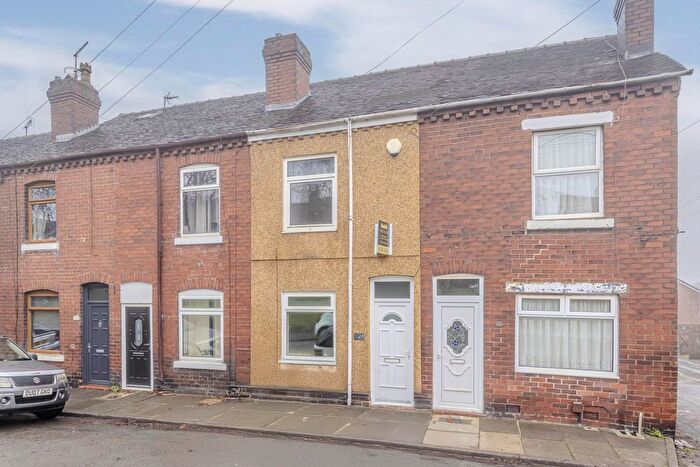
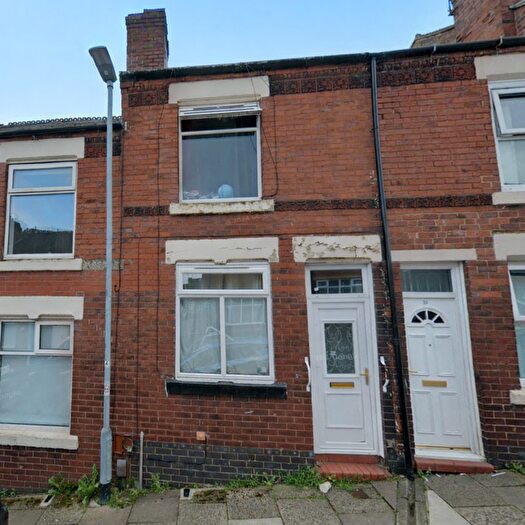
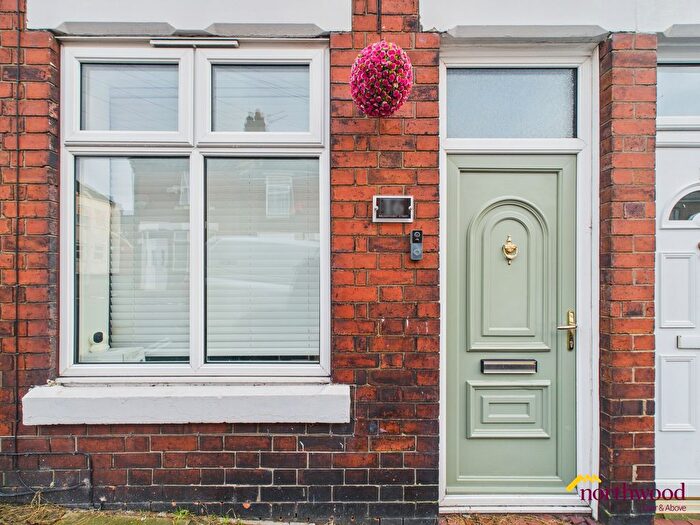
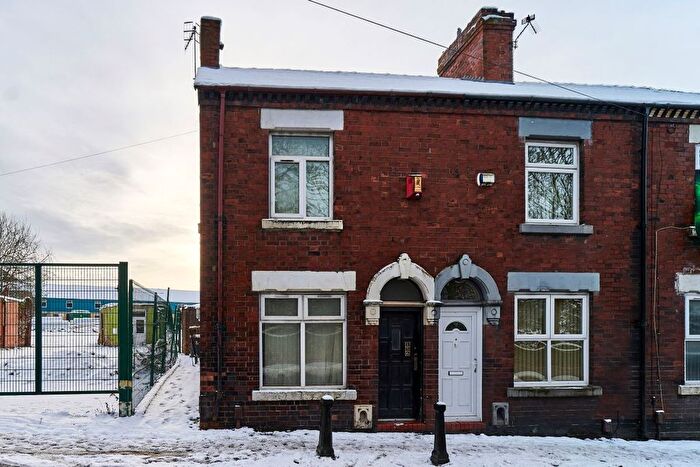
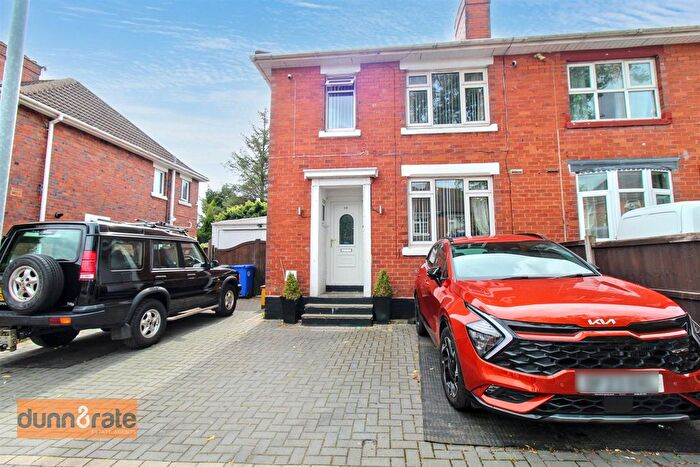
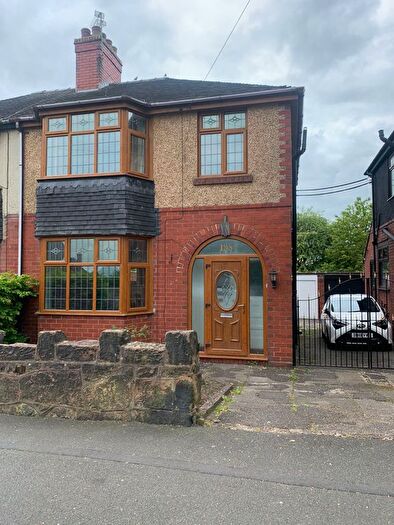
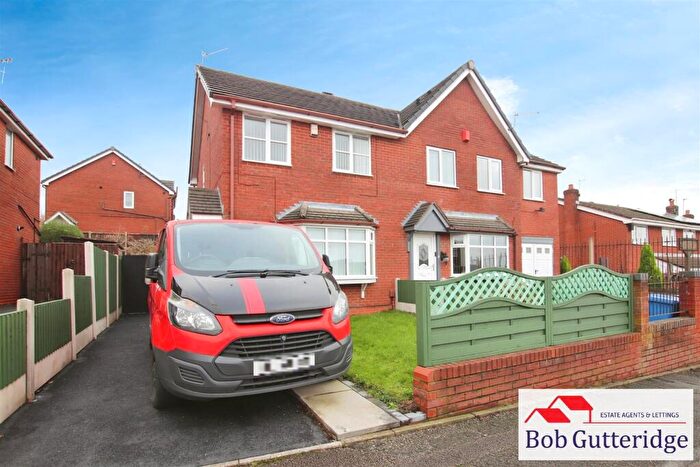
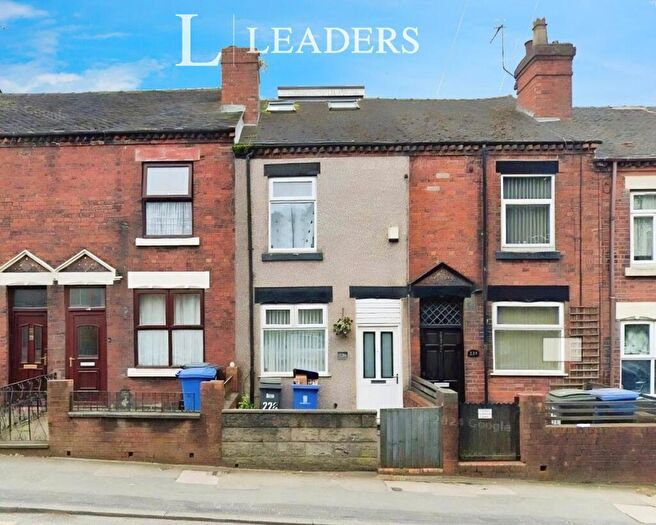
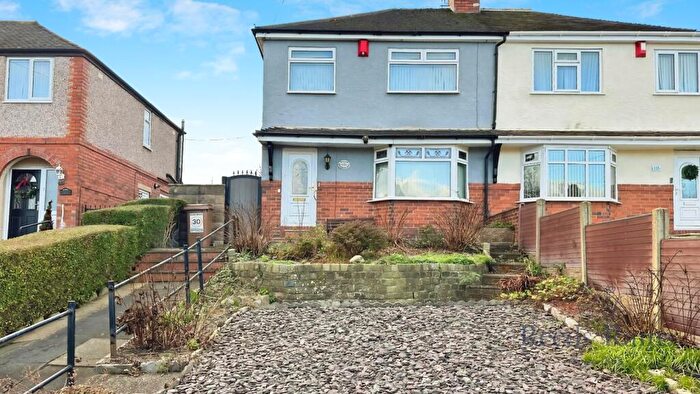
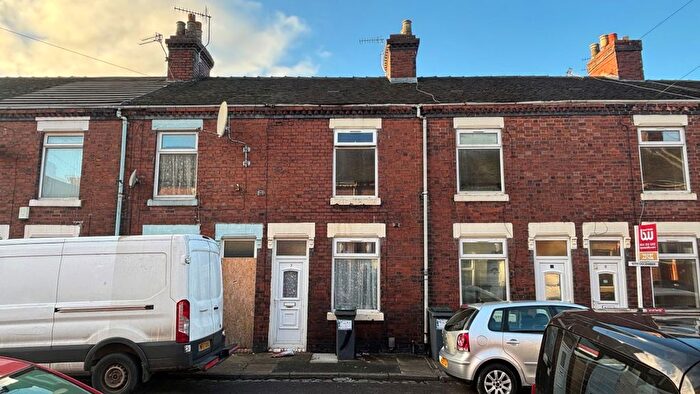
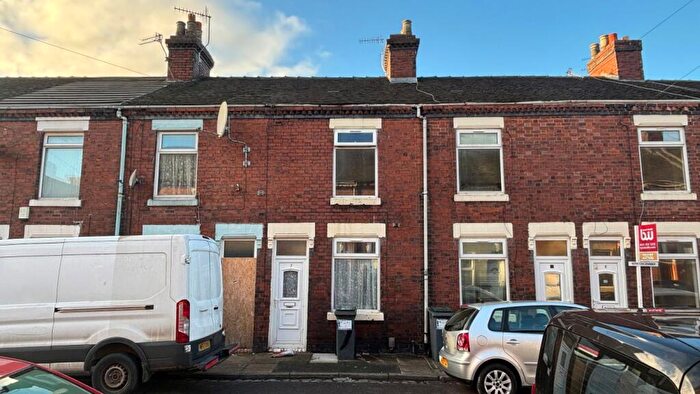
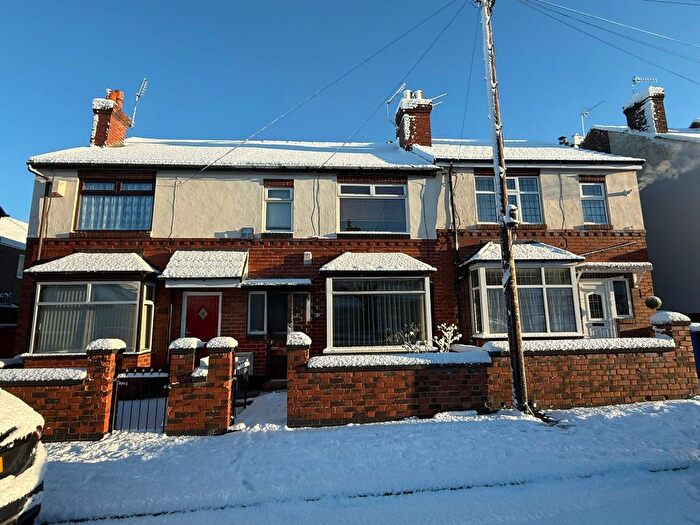
Houses for sale & to rent in Burslem Park, Stoke-on-trent
House Prices in Burslem Park
Properties in Burslem Park have an average house price of £115,861.00 and had 387 Property Transactions within the last 3 years¹.
Burslem Park is an area in Stoke-on-trent, City of Stoke-on-Trent with 2,413 households², where the most expensive property was sold for £335,000.00.
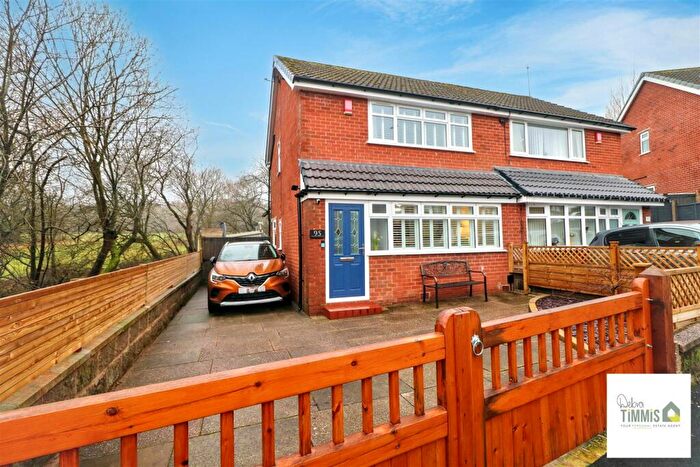
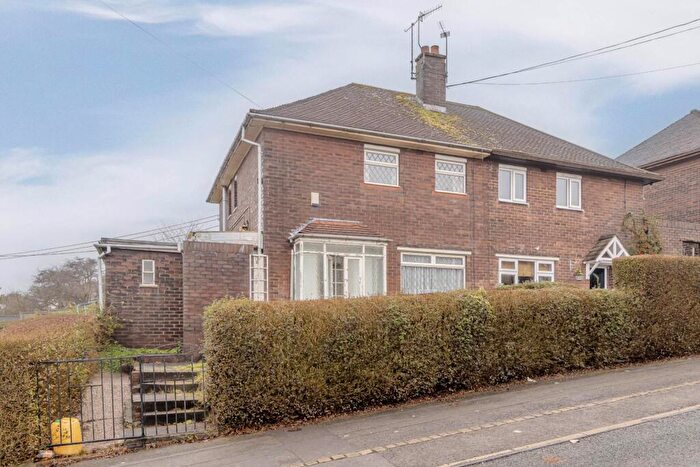
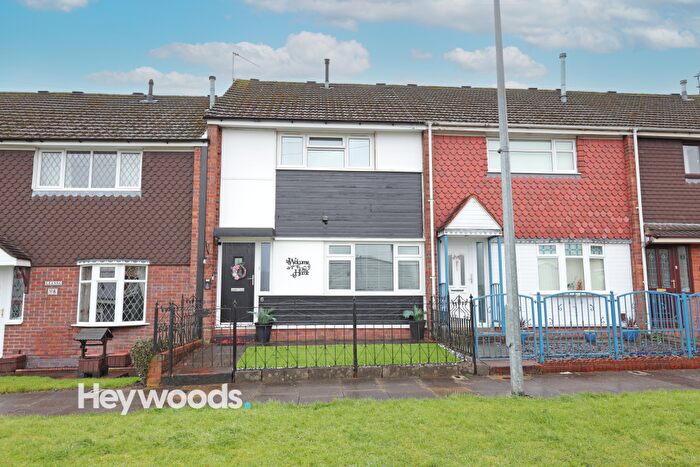
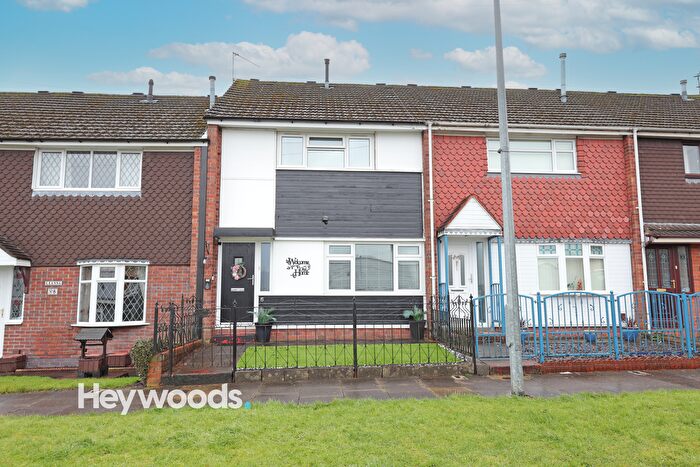
Properties for sale in Burslem Park
Roads and Postcodes in Burslem Park
Navigate through our locations to find the location of your next house in Burslem Park, Stoke-on-trent for sale or to rent.
| Streets | Postcodes |
|---|---|
| Acreswood Road | ST6 7DZ |
| Bank Hall Road | ST6 7DJ ST6 7DL ST6 7DP ST6 7DR ST6 7DS ST6 7DT |
| Bank House Gardens | ST6 7EG |
| Belfast Close | ST6 7PJ |
| Bluestone Avenue | ST6 7EE ST6 7EF |
| Bowden Street | ST6 1EZ ST6 1JB |
| Brackley Avenue | ST6 7DN |
| Bream Way | ST6 7PW |
| Broadhurst Street | ST6 1EX ST6 1EY |
| Burslem Enterprise Centre | ST6 1JQ |
| Cheviot Drive | ST6 7NY |
| Chumleigh Grove | ST6 7BE |
| Curzon Road | ST6 1BS |
| Cynthia Grove | ST6 1BZ |
| Dace Grove | ST6 7PR |
| Dartmouth Street | ST6 1HA ST6 1HB ST6 1HD ST6 1HE ST6 1HF ST6 1HG |
| Dollys Lane | ST6 1BU ST6 7AP ST6 7AW |
| Elaine Avenue | ST6 7DD ST6 7DE |
| Garlick Street | ST6 7DQ |
| Gordon Street | ST6 1ER ST6 1ES ST6 1HY ST6 1HZ |
| Grafton Avenue | ST6 7DB |
| Grayling Grove | ST6 7PS |
| Greenway Avenue | ST6 7DX |
| Hamil Road | ST6 1AP ST6 1AU ST6 1BA ST6 1BB ST6 1BD ST6 1AJ ST6 1AW |
| Hanley Road | ST6 1RB |
| High Lane | ST6 1BH ST6 1BJ ST6 1BN ST6 7AA ST6 7AD ST6 7AE ST6 7BS ST6 7BT ST6 7DF ST6 7DG ST6 7EA ST6 7AB |
| Highbank Place | ST6 7DH |
| Highcroft Walk | ST6 7BU |
| Inglefield Avenue | ST6 7DA |
| Jackfield Street | ST6 1ET ST6 1EU |
| Jean Close | ST6 7BH |
| Joyce Avenue | ST6 7PF |
| Kelsall Street | ST6 1HL |
| Lawton Street | ST6 1AZ |
| Leigh Street | ST6 1BE |
| Leonard Street | ST6 1HH ST6 1HJ ST6 1HS ST6 1HT |
| Lorne Street | ST6 1AR |
| Louise Street | ST6 1AS ST6 1AY ST6 1BG |
| Macclesfield Street | ST6 1EH ST6 1HU ST6 1HX |
| Mandeville Close | ST6 7PA |
| Marney Walk | ST6 7BY |
| Marsh Avenue | ST6 7BZ |
| May Street | ST6 1EP ST6 1JA |
| Merrion Drive | ST6 7PG ST6 7PH ST6 7PQ |
| Minster Street | ST6 1EN ST6 1EW |
| Moorland Road | ST6 1EB ST6 1EF ST6 1JH ST6 1JP ST6 1JR ST6 1JW ST6 1JD |
| Narvik Crescent | ST6 7PB |
| Oakville Avenue | ST6 7DY |
| Park Road | ST6 1EJ ST6 1EL ST6 1EG |
| Penrhyn Avenue | ST6 7DW |
| Riley Avenue | ST6 7DU |
| Sandra Close | ST6 7BJ |
| Shaftesbury Avenue | ST6 1BP ST6 1BW |
| Sneyd Hill | ST6 1RA |
| Stanfield Road | ST6 1AT |
| Steele Avenue | ST6 7ED |
| Stormont Close | ST6 7NZ |
| Stratheden Road | ST6 7NU ST6 7NX ST6 7PD ST6 7PE |
| Tellwright Street | ST6 1AX |
| The Grove | ST6 1BL |
| Thorneycroft Avenue | ST6 7BX |
| Unwin Street | ST6 7PP ST6 7NH ST6 7NL |
| Wade Street | ST6 1HN ST6 1HP ST6 1HR ST6 1HW |
| Wilson Street | ST6 1BQ |
| Woodland Grove | ST6 7EB |
Transport near Burslem Park
- FAQ
- Price Paid By Year
- Property Type Price
Frequently asked questions about Burslem Park
What is the average price for a property for sale in Burslem Park?
The average price for a property for sale in Burslem Park is £115,861. This amount is 19% lower than the average price in Stoke-on-trent. There are 788 property listings for sale in Burslem Park.
What streets have the most expensive properties for sale in Burslem Park?
The streets with the most expensive properties for sale in Burslem Park are Oakville Avenue at an average of £243,333, Riley Avenue at an average of £223,083 and Brackley Avenue at an average of £185,000.
What streets have the most affordable properties for sale in Burslem Park?
The streets with the most affordable properties for sale in Burslem Park are Stanfield Road at an average of £64,000, May Street at an average of £75,930 and Lorne Street at an average of £76,700.
Which train stations are available in or near Burslem Park?
Some of the train stations available in or near Burslem Park are Longport, Stoke-On-Trent and Kidsgrove.
Property Price Paid in Burslem Park by Year
The average sold property price by year was:
| Year | Average Sold Price | Price Change |
Sold Properties
|
|---|---|---|---|
| 2025 | £114,647 | -5% |
64 Properties |
| 2024 | £120,390 | 5% |
102 Properties |
| 2023 | £114,683 | 1% |
104 Properties |
| 2022 | £113,626 | 8% |
117 Properties |
| 2021 | £104,382 | 8% |
123 Properties |
| 2020 | £95,689 | 2% |
104 Properties |
| 2019 | £93,902 | 0,2% |
101 Properties |
| 2018 | £93,677 | - |
111 Properties |
| 2017 | £93,673 | 9% |
107 Properties |
| 2016 | £85,489 | 6% |
94 Properties |
| 2015 | £80,521 | -1% |
100 Properties |
| 2014 | £81,247 | -10% |
91 Properties |
| 2013 | £89,418 | 13% |
80 Properties |
| 2012 | £77,648 | -6% |
55 Properties |
| 2011 | £82,486 | 10% |
47 Properties |
| 2010 | £74,297 | -17% |
55 Properties |
| 2009 | £86,753 | 2% |
50 Properties |
| 2008 | £85,047 | -9% |
83 Properties |
| 2007 | £92,690 | 12% |
163 Properties |
| 2006 | £81,906 | 7% |
176 Properties |
| 2005 | £76,005 | 11% |
143 Properties |
| 2004 | £67,924 | 35% |
182 Properties |
| 2003 | £44,231 | 14% |
191 Properties |
| 2002 | £38,122 | -8% |
184 Properties |
| 2001 | £41,097 | 30% |
152 Properties |
| 2000 | £28,679 | -10% |
106 Properties |
| 1999 | £31,442 | -4% |
125 Properties |
| 1998 | £32,730 | 8% |
98 Properties |
| 1997 | £30,167 | 2% |
130 Properties |
| 1996 | £29,687 | 3% |
122 Properties |
| 1995 | £28,656 | - |
107 Properties |
Property Price per Property Type in Burslem Park
Here you can find historic sold price data in order to help with your property search.
The average Property Paid Price for specific property types in the last three years are:
| Property Type | Average Sold Price | Sold Properties |
|---|---|---|
| Semi Detached House | £161,191.00 | 80 Semi Detached Houses |
| Detached House | £188,981.00 | 38 Detached Houses |
| Terraced House | £92,018.00 | 267 Terraced Houses |
| Flat | £96,500.00 | 2 Flats |

