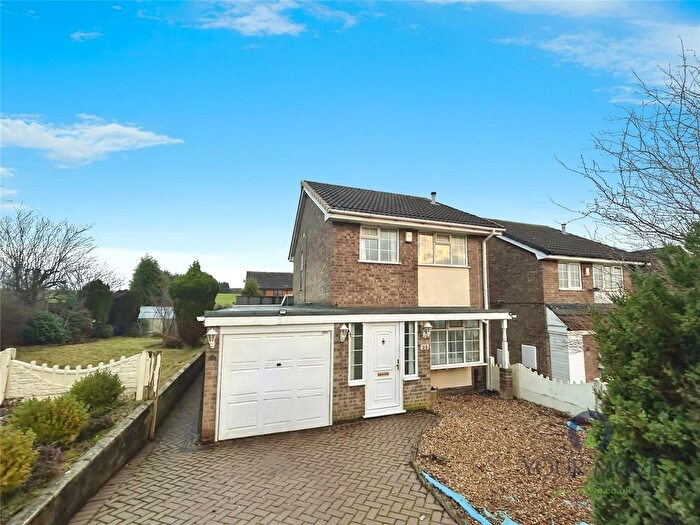
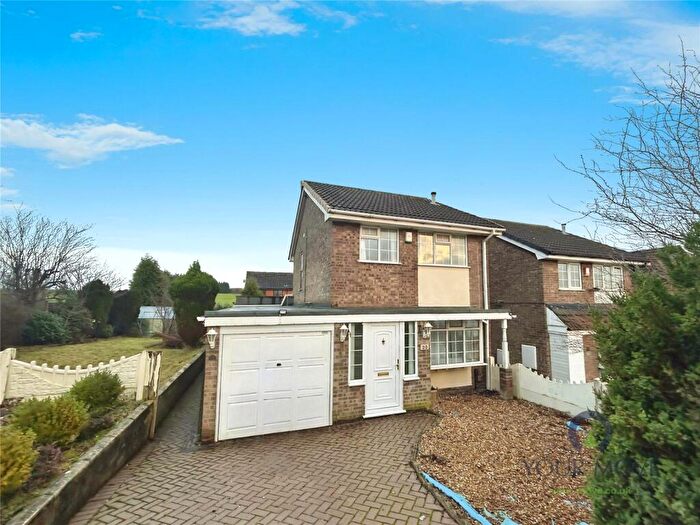
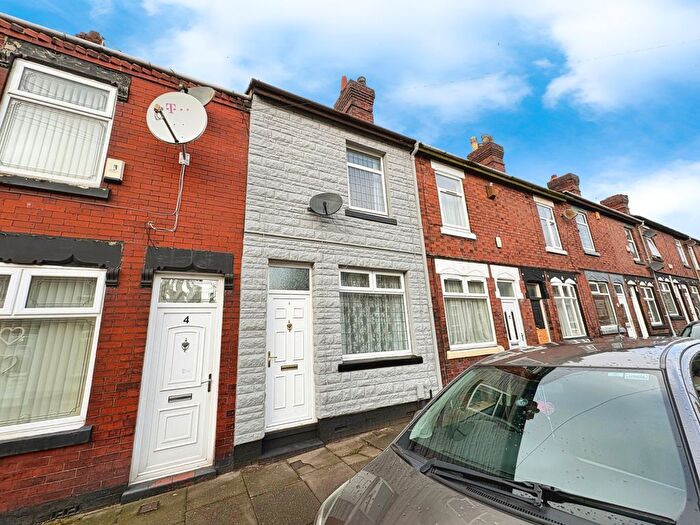
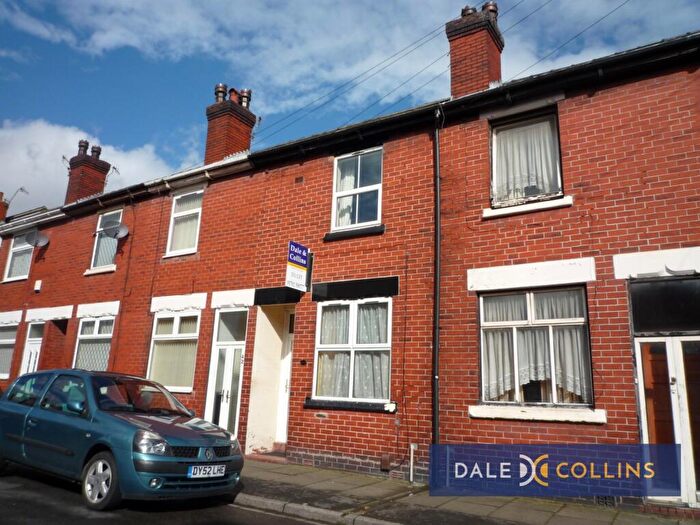
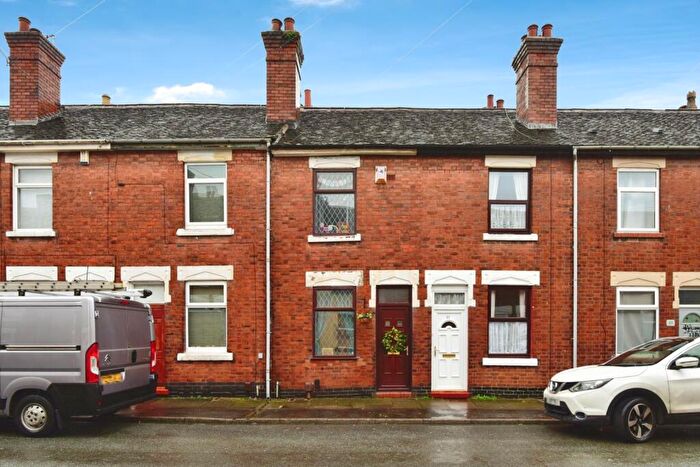
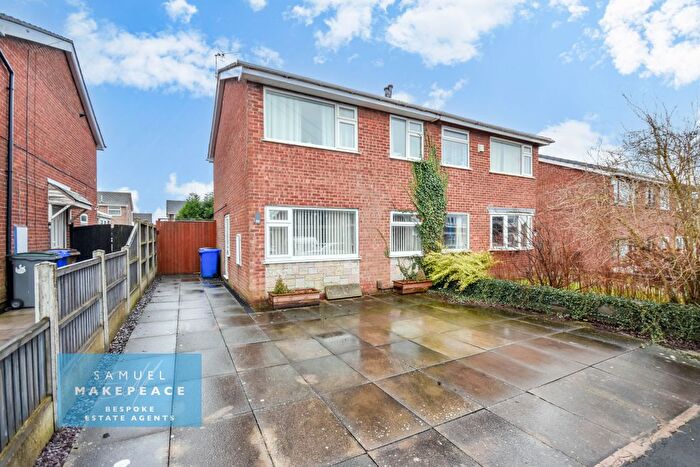
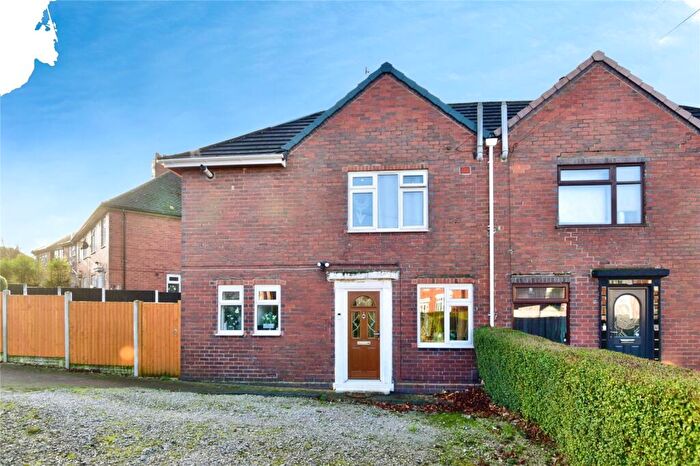
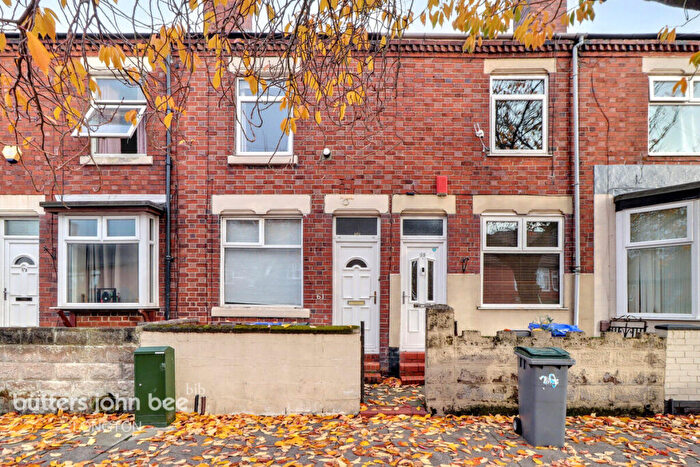
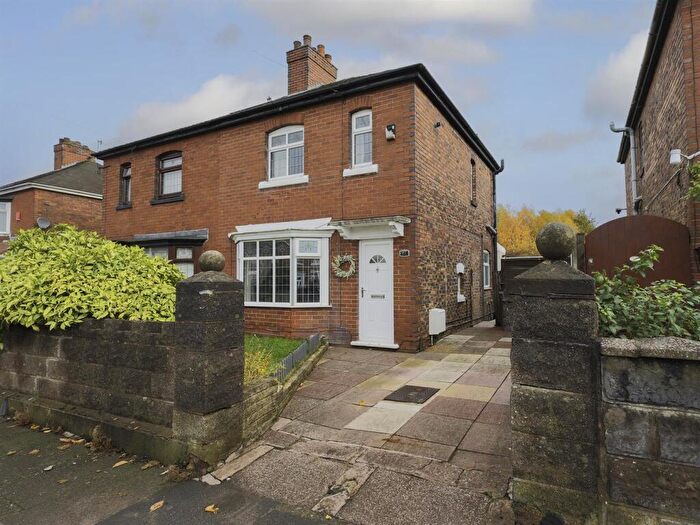
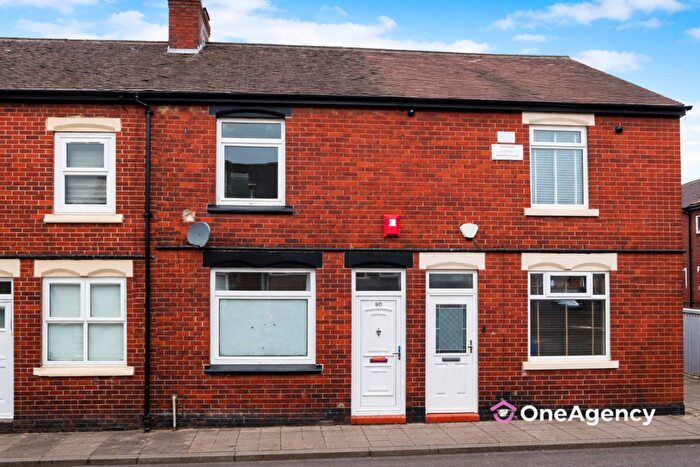
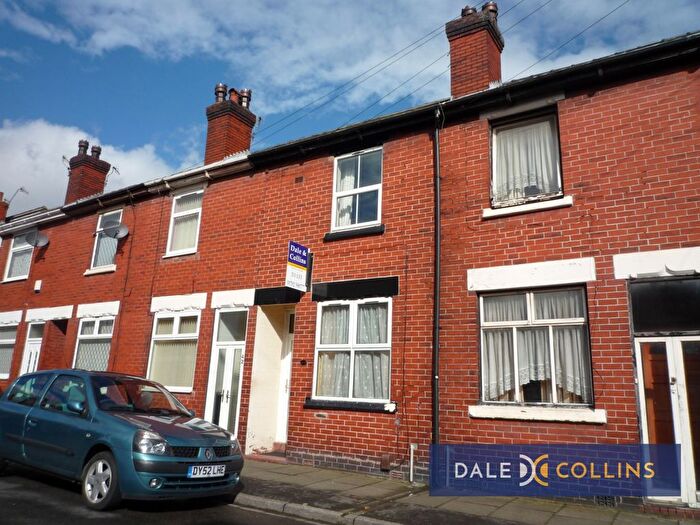
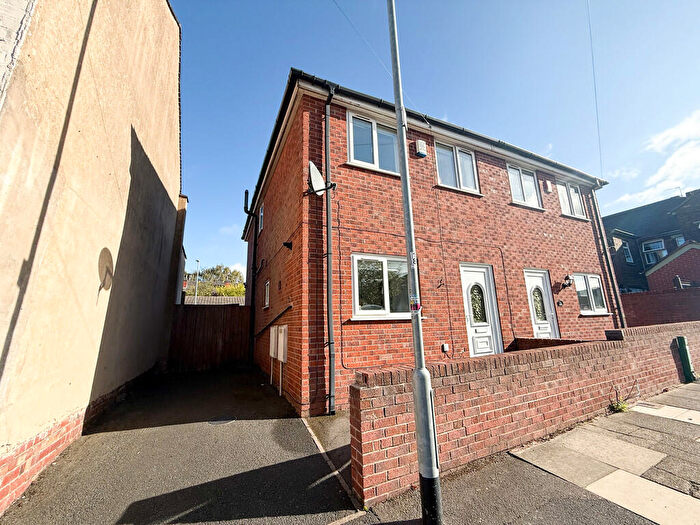
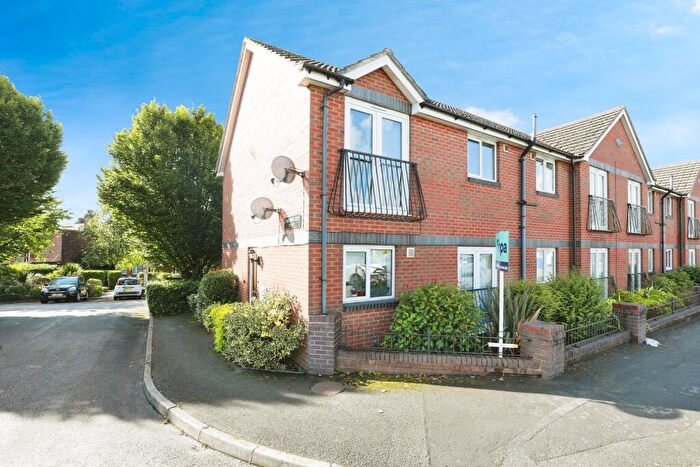
Houses for sale & to rent in Fenton East, Stoke-on-trent
House Prices in Fenton East
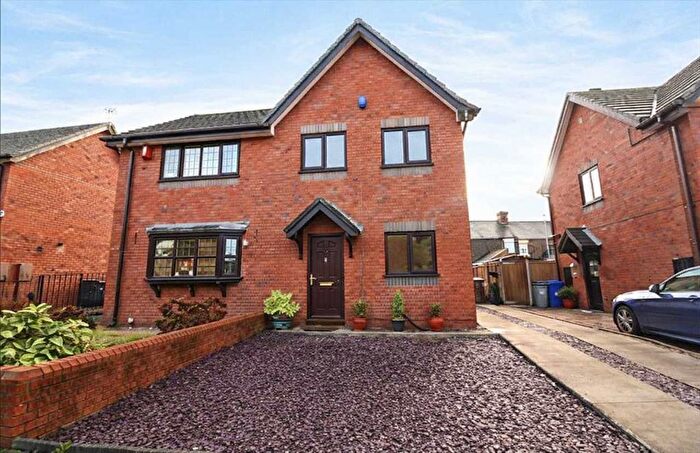
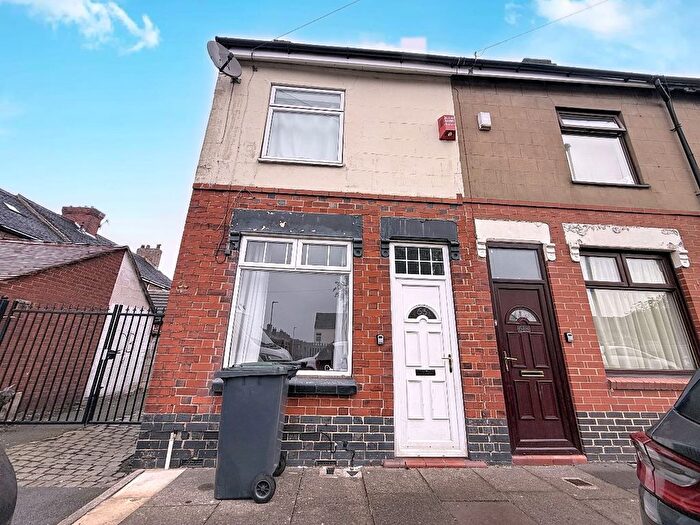
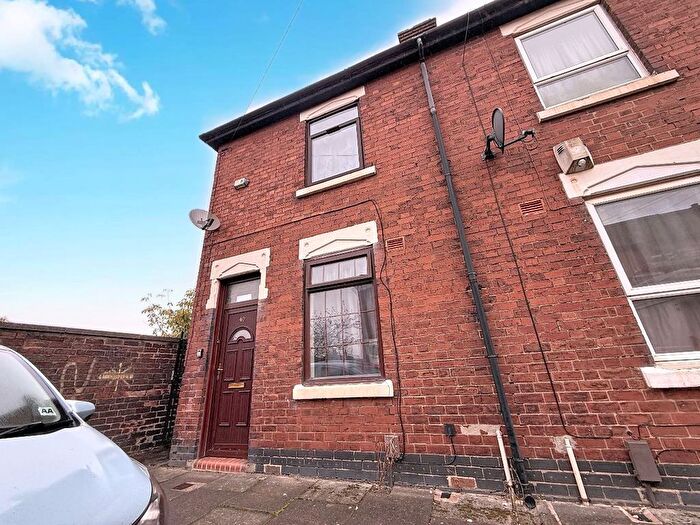
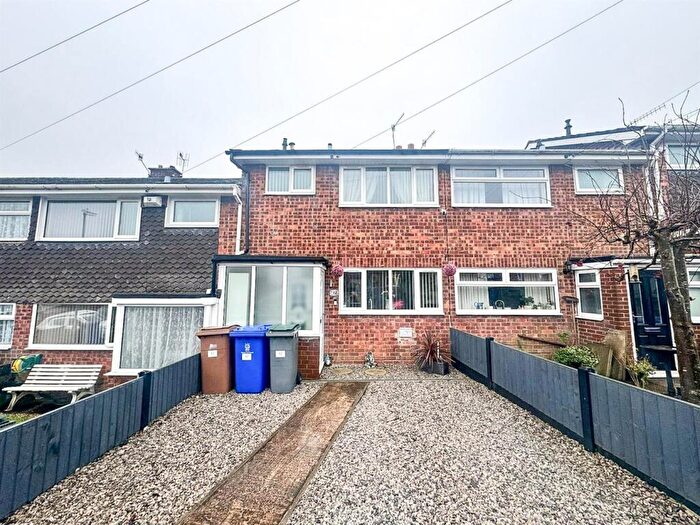
Properties in Fenton East have an average house price of £100,299.00 and had 445 Property Transactions within the last 3 years¹.
Fenton East is an area in Stoke-on-trent, City of Stoke-on-Trent with 2,848 households², where the most expensive property was sold for £232,000.00.
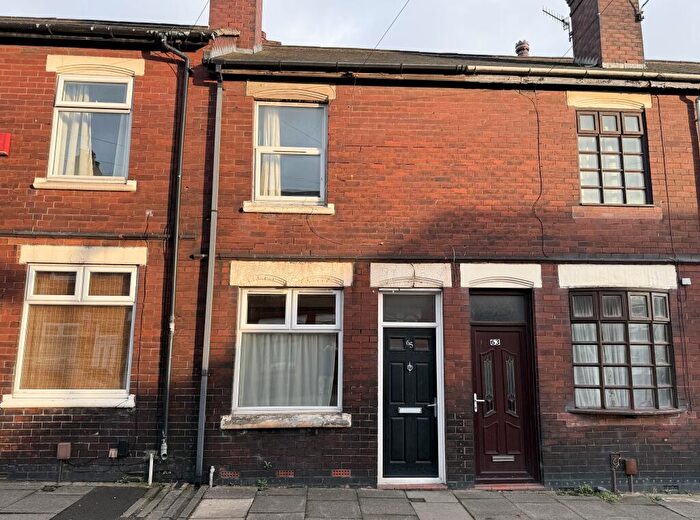
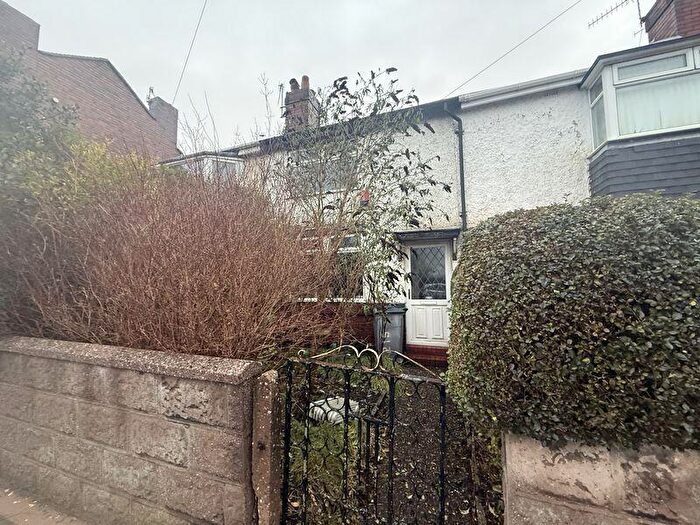
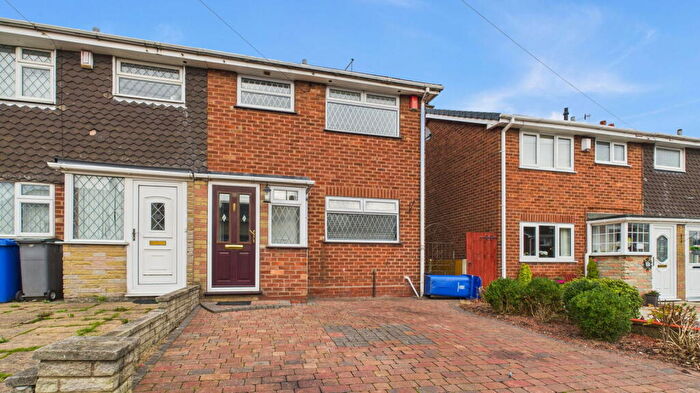
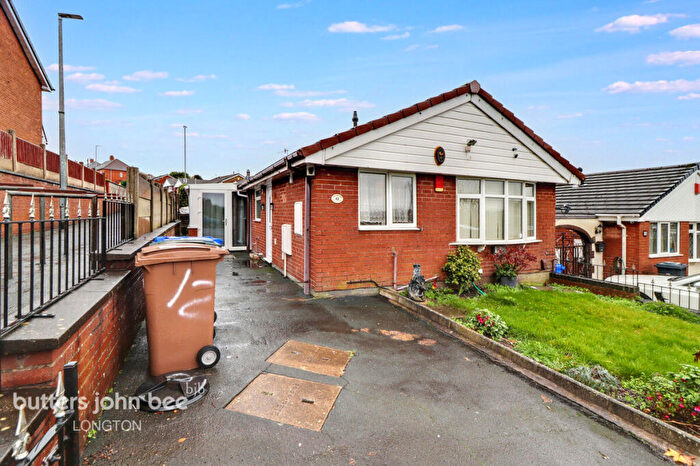
Properties for sale in Fenton East
Roads and Postcodes in Fenton East
Navigate through our locations to find the location of your next house in Fenton East, Stoke-on-trent for sale or to rent.
| Streets | Postcodes |
|---|---|
| Alfreton Road | ST4 2NX ST4 2NY |
| Allensmore Avenue | ST4 3HJ |
| Annette Road | ST4 3RH |
| Applegarth Close | ST4 3RN |
| Appleton Court | ST4 3JF |
| Baron Street | ST4 3PH |
| Berdmore Street | ST4 3HB ST4 3HD |
| Best Street | ST4 3JN ST4 3JR |
| Beville Street | ST4 2LH ST4 3LH |
| Bishop Street | ST4 3PF |
| Bosinney Close | ST4 3QP |
| Brocksford Street | ST4 3EB ST4 3EZ ST4 3HA ST4 3HE |
| Brogan Street | ST4 3JY |
| Burnham Street | ST4 3EX ST4 3EY |
| Bute Street | ST4 3PW |
| Carling Grove | ST4 3HP |
| Carron Street | ST4 3DS ST4 3DT |
| Colville Street | ST4 3LB |
| Cowper Street | ST4 3LA |
| Delph Walk | ST4 3HX |
| Dennis Street | ST4 3JW |
| Duke Street | ST4 3NS |
| Elburton Road | ST4 2NU |
| Elliot Road | ST4 3LQ |
| Elworth Court | ST4 3JE |
| Fenpark Road | ST4 2NN ST4 2NP ST4 2NS ST4 2PA ST4 3JJ ST4 3JT ST4 3JU |
| Fenton Park | ST4 2NR |
| Fife Street | ST4 3BY |
| Fleur Grove | ST4 3RG |
| Foley Place | ST4 3DD |
| Foley Street | ST4 3DX ST4 3DY ST4 3DR |
| Galveston Grove | ST4 3PE |
| Goldenhill Road | ST4 3DL ST4 3DP ST4 3DW |
| Hollings Street | ST4 3HG ST4 3HS ST4 3HW |
| Hopedale Close | ST4 2SX |
| Hulse Street | ST4 2PD |
| Imogen Close | ST4 3QY |
| June Road | ST4 3RL |
| Kelham Road | ST4 2NT |
| Kentmere Close | ST4 3HN |
| King Street | ST4 3DA ST4 3DB ST4 3DE ST4 3EE ST4 3EJ ST4 3EN ST4 3ET ST4 3NA ST3 1ET ST3 1EU ST3 1EZ ST3 1HD ST4 3DJ ST4 3EF ST4 3EQ ST4 3ER ST4 3LZ |
| Kingstable Square | ST4 3EL |
| Lamotte Close | ST4 3QR ST4 3QS |
| Ludbrook Road | ST4 3HL |
| Marriott Street | ST4 3HR |
| May Place | ST4 3EA |
| Minerva Road | ST4 3LE |
| Monty Place | ST4 3RQ |
| Newmount Road | ST4 3HQ ST4 3HU |
| Oldfield Street | ST4 3PG ST4 3PL ST4 3PN ST4 3PQ |
| Oldfields Business Park | ST4 3ES ST4 3NX |
| Packett Street | ST4 3DZ |
| Park Lane | ST4 3JP |
| Park Place | ST4 3HZ |
| Park Street | ST4 3JB ST4 3JD |
| Paynter Street | ST4 3JL |
| Pendine Grove | ST4 3RJ |
| Perth Street | ST4 3PJ |
| Philip Street | ST4 3HY |
| Phoenix Way | ST3 2JD |
| Pool Street | ST4 2PB |
| Rachel Grove | ST4 3QX |
| Rill Street | ST4 3DN |
| Robin Hill Grove | ST4 3QW |
| Rogate Close | ST4 3RP |
| Royal Street | ST4 3EU |
| Shardlow Close | ST4 2NZ |
| Sheldrake Grove | ST4 3RA |
| Sloane Way | ST4 3QZ |
| Smiths Passage | ST4 3ED |
| St Matthew Street | ST4 3JX |
| Stanier Street | ST4 3LJ ST4 3LL ST4 3LN |
| Sterndale Drive | ST4 2QD |
| Surtees Grove | ST4 3HH |
| Swithin Drive | ST4 3RF |
| Troutdale Close | ST4 2SY |
| Victoria Place | ST4 2LX |
| Victoria Road | ST4 2HE ST4 2HF |
| Vivian Road | ST4 3JG ST4 3JQ |
| Wallis Street | ST4 3JZ |
| Warrington Street | ST4 3LF ST4 3LG |
| Wedgwood Road | ST4 3LD |
| Wileman Place | ST4 3LR |
| Wileman Street | ST4 3LP ST4 3LW |
| Woodend Street | ST4 3JS |
Transport near Fenton East
- FAQ
- Price Paid By Year
- Property Type Price
Frequently asked questions about Fenton East
What is the average price for a property for sale in Fenton East?
The average price for a property for sale in Fenton East is £100,299. This amount is 30% lower than the average price in Stoke-on-trent. There are 775 property listings for sale in Fenton East.
What streets have the most expensive properties for sale in Fenton East?
The streets with the most expensive properties for sale in Fenton East are Sterndale Drive at an average of £191,963, Elburton Road at an average of £188,666 and Ludbrook Road at an average of £181,500.
What streets have the most affordable properties for sale in Fenton East?
The streets with the most affordable properties for sale in Fenton East are Best Street at an average of £65,100, Oldfield Street at an average of £66,517 and Packett Street at an average of £66,987.
Which train stations are available in or near Fenton East?
Some of the train stations available in or near Fenton East are Longton, Stoke-On-Trent and Blythe Bridge.
Property Price Paid in Fenton East by Year
The average sold property price by year was:
| Year | Average Sold Price | Price Change |
Sold Properties
|
|---|---|---|---|
| 2025 | £118,745 | 16% |
72 Properties |
| 2024 | £99,702 | 8% |
118 Properties |
| 2023 | £91,376 | -8% |
118 Properties |
| 2022 | £98,805 | 12% |
137 Properties |
| 2021 | £87,356 | 6% |
145 Properties |
| 2020 | £81,806 | 10% |
93 Properties |
| 2019 | £73,706 | -4% |
106 Properties |
| 2018 | £76,400 | 4% |
141 Properties |
| 2017 | £73,036 | -2% |
134 Properties |
| 2016 | £74,581 | 8% |
123 Properties |
| 2015 | £68,428 | 5% |
125 Properties |
| 2014 | £65,298 | 1% |
109 Properties |
| 2013 | £64,906 | -3% |
75 Properties |
| 2012 | £66,561 | 4% |
58 Properties |
| 2011 | £64,053 | -3% |
63 Properties |
| 2010 | £65,843 | 1% |
59 Properties |
| 2009 | £65,078 | -16% |
62 Properties |
| 2008 | £75,225 | -4% |
88 Properties |
| 2007 | £78,301 | 2% |
200 Properties |
| 2006 | £77,126 | 7% |
193 Properties |
| 2005 | £71,561 | 23% |
210 Properties |
| 2004 | £55,058 | 28% |
218 Properties |
| 2003 | £39,836 | 18% |
194 Properties |
| 2002 | £32,687 | 13% |
185 Properties |
| 2001 | £28,367 | 13% |
116 Properties |
| 2000 | £24,787 | -12% |
124 Properties |
| 1999 | £27,638 | 3% |
127 Properties |
| 1998 | £26,839 | 6% |
126 Properties |
| 1997 | £25,289 | 1% |
145 Properties |
| 1996 | £25,122 | -7% |
140 Properties |
| 1995 | £26,904 | - |
131 Properties |
Property Price per Property Type in Fenton East
Here you can find historic sold price data in order to help with your property search.
The average Property Paid Price for specific property types in the last three years are:
| Property Type | Average Sold Price | Sold Properties |
|---|---|---|
| Semi Detached House | £140,638.00 | 95 Semi Detached Houses |
| Detached House | £139,458.00 | 17 Detached Houses |
| Terraced House | £87,024.00 | 323 Terraced Houses |
| Flat | £79,295.00 | 10 Flats |

