
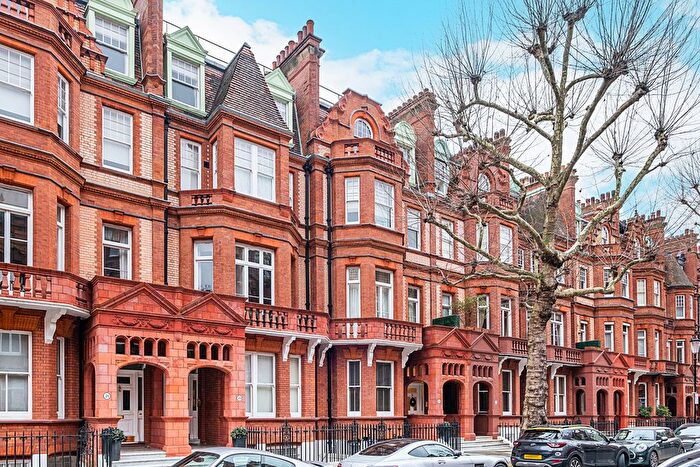
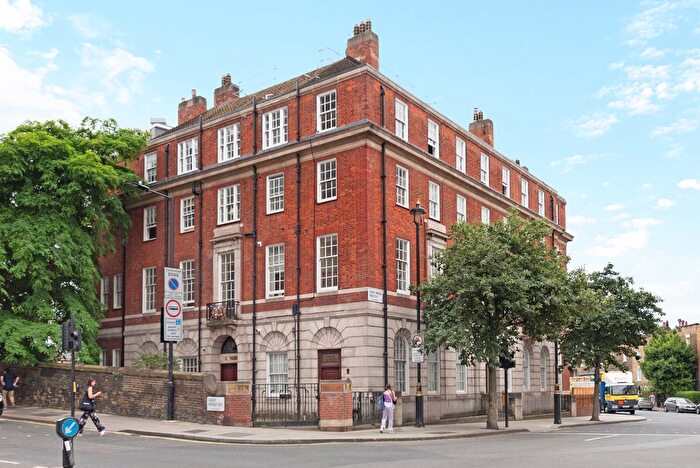
Houses for sale & to rent in Churchill, London
House Prices in Churchill
Properties in this part of Churchill within London have an average house price of £2,302,877.00 and had 312 Property Transactions within the last 3 years¹. This area has 4,536 households² , where the most expensive property was sold for £52,000,000.00.
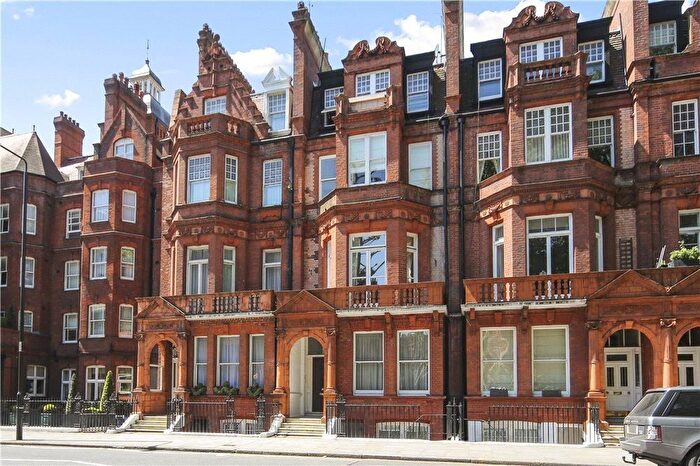
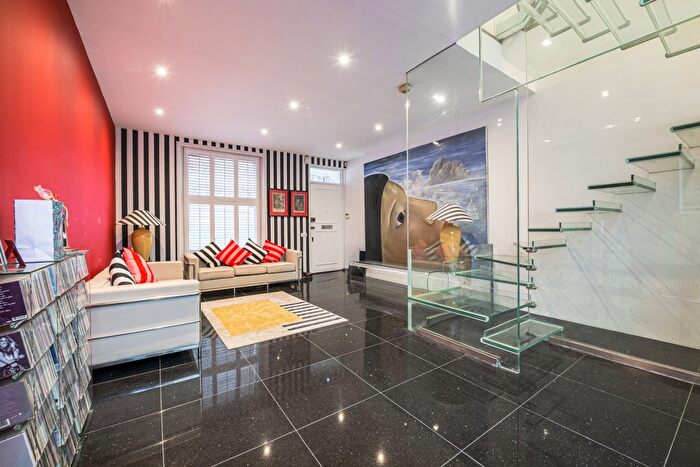
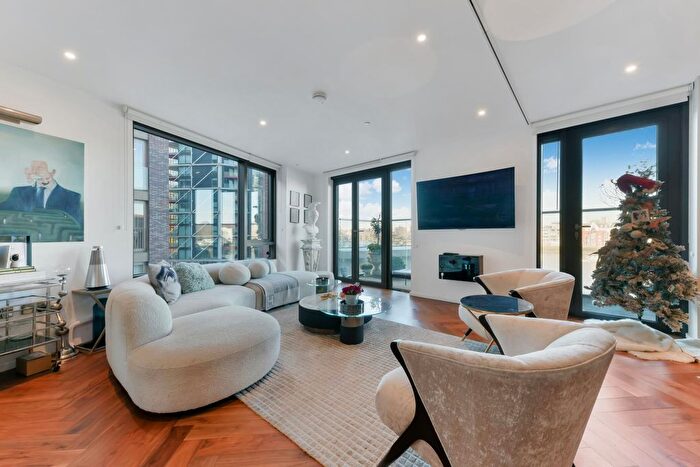
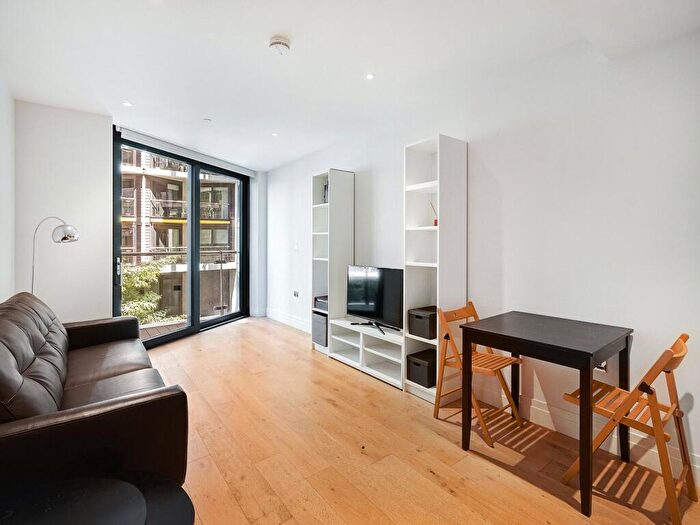
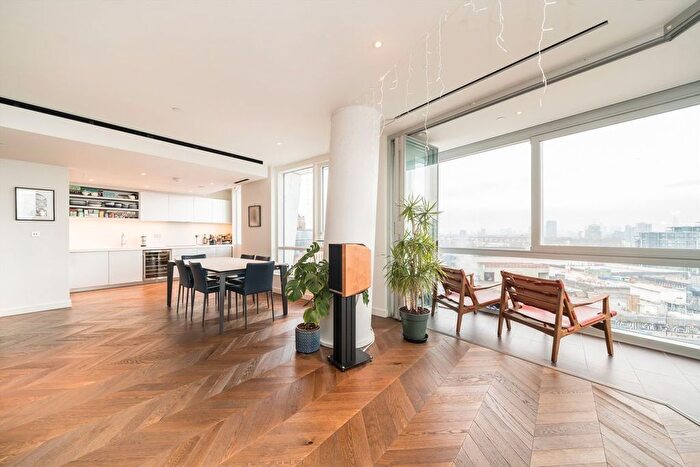
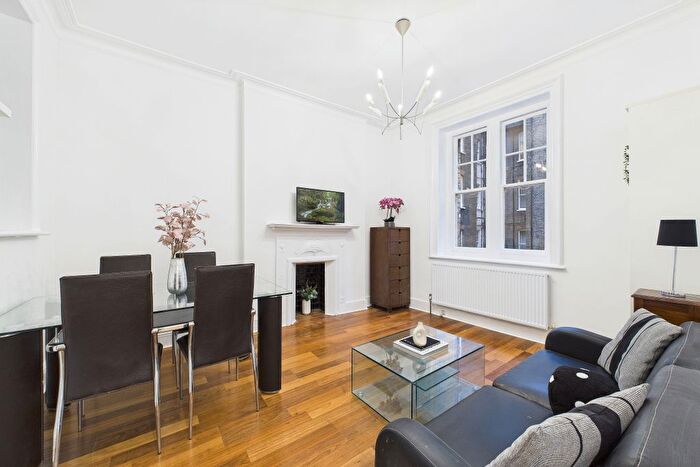
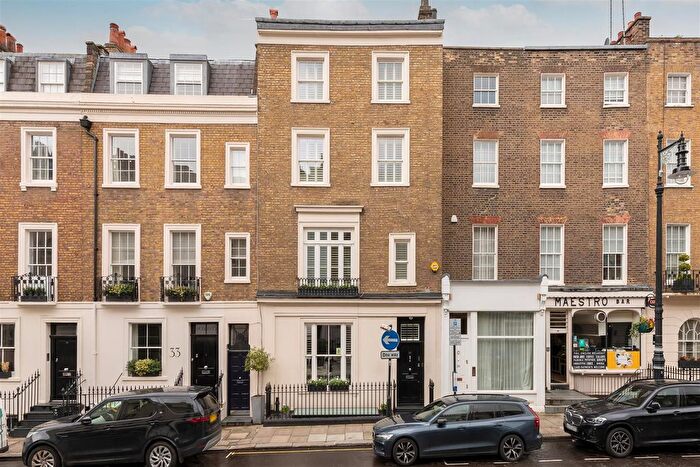
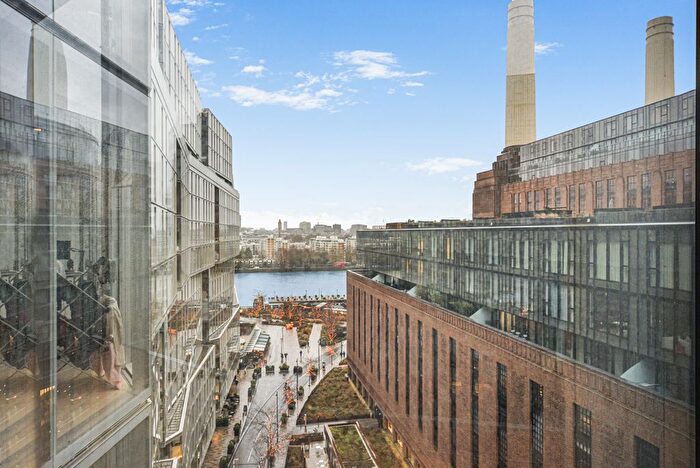
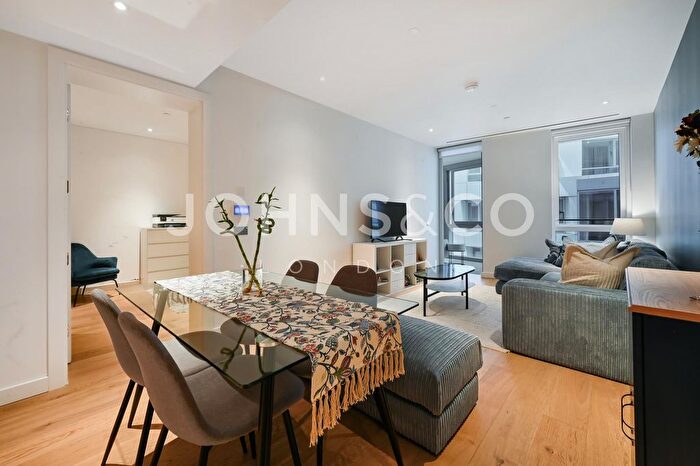
Properties for sale in Churchill
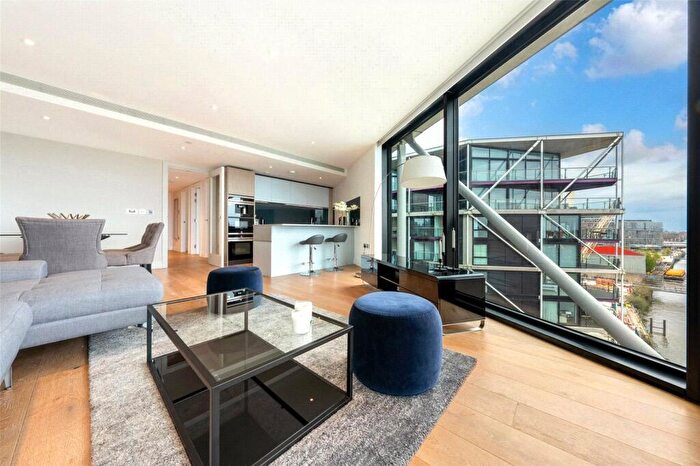
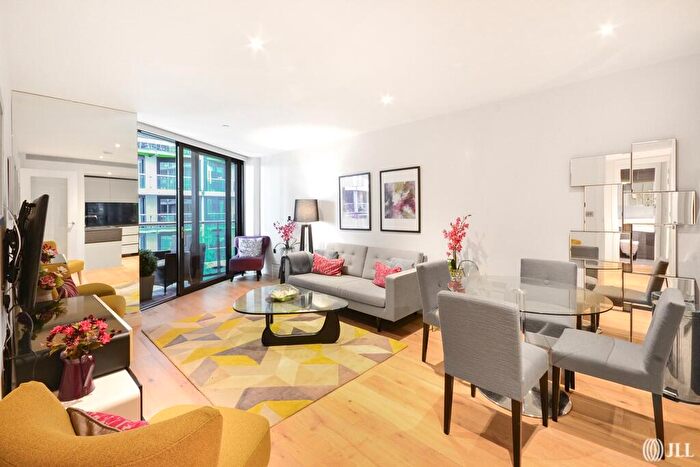
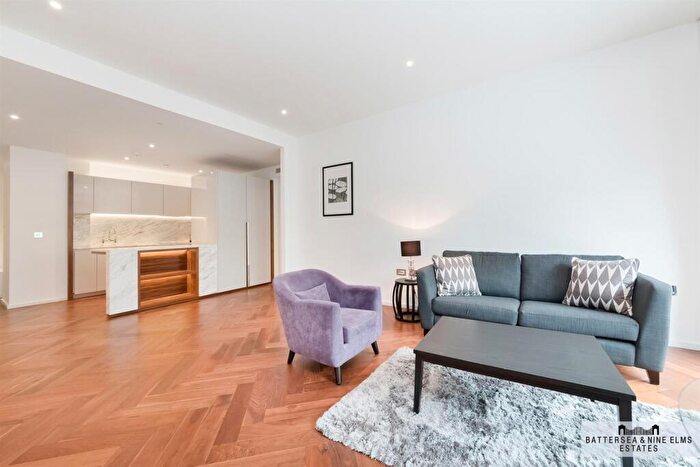
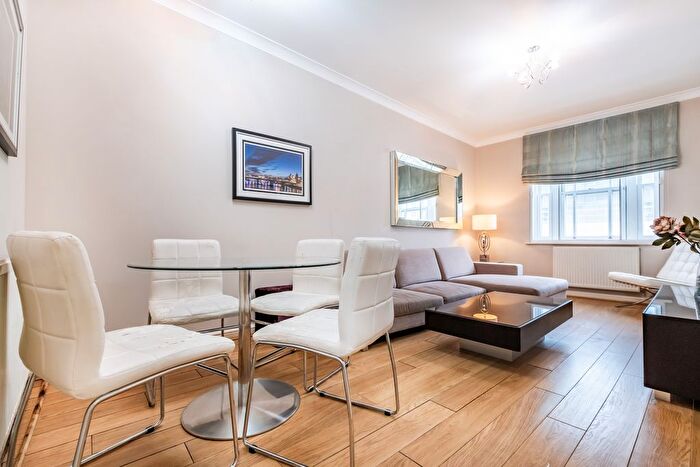
![]()
If you are looking to sell your house, let it out, or receive a property valuation, an expert can help you.
Click the button below to get started.

Roads and Postcodes in Churchill
Navigate through our locations to find the location of your next house in Churchill, London for sale or to rent.
Transport near Churchill
-
 Sloane Square Station
 -
 Victoria Station
 -
Pimlico Station
-
Battersea Power Station Station
-
Battersea Park Station
-
Queenstown Road (Battersea) Station
-
Queenstown Road Station
-
St. James's Park Station
-
Hyde Park Corner Station
-
Nine Elms Station
- FAQ
- Price Paid By Year
- Property Type Price
Frequently asked questions about Churchill
What is the average price for a property for sale in Churchill?
The average price for a property for sale in Churchill is £2,302,877. This amount is 22% higher than the average price in London. There are 8,589 property listings for sale in Churchill.
What streets have the most expensive properties for sale in Churchill?
The streets with the most expensive properties for sale in Churchill are Mulberry Square at an average of £24,799,745, Whistler Square at an average of £12,670,725 and Ebury Square at an average of £4,956,250.
What streets have the most affordable properties for sale in Churchill?
The streets with the most affordable properties for sale in Churchill are Gatliff Close at an average of £298,750, Churchill Gardens at an average of £459,012 and Peabody Avenue at an average of £484,666.
Which train stations are available in or near Churchill?
Some of the train stations available in or near Churchill are Victoria, Battersea Park and Queenstown Road (Battersea).
Which tube stations are available in or near Churchill?
Some of the tube stations available in or near Churchill are Sloane Square, Victoria and Pimlico.
Property Price Paid in Churchill by Year
The average sold property price by year was:
| Year | Average Sold Price | Price Change |
Sold Properties
|
|---|---|---|---|
| 2025 | £1,638,232 | -8% |
34 Properties |
| 2024 | £1,773,124 | -12% |
90 Properties |
| 2023 | £1,982,571 | -69% |
92 Properties |
| 2022 | £3,341,874 | 0,4% |
96 Properties |
| 2021 | £3,327,370 | -27% |
100 Properties |
| 2020 | £4,215,420 | 29% |
91 Properties |
| 2019 | £3,009,293 | 62% |
122 Properties |
| 2018 | £1,131,822 | 9% |
102 Properties |
| 2017 | £1,027,026 | 2% |
89 Properties |
| 2016 | £1,010,829 | -23% |
114 Properties |
| 2015 | £1,244,824 | -69% |
118 Properties |
| 2014 | £2,103,659 | 54% |
161 Properties |
| 2013 | £968,315 | 6% |
154 Properties |
| 2012 | £914,878 | 14% |
131 Properties |
| 2011 | £786,702 | 12% |
136 Properties |
| 2010 | £693,400 | 5% |
124 Properties |
| 2009 | £660,674 | 9% |
81 Properties |
| 2008 | £600,919 | -5% |
65 Properties |
| 2007 | £631,316 | 13% |
136 Properties |
| 2006 | £550,115 | 7% |
334 Properties |
| 2005 | £510,204 | 32% |
174 Properties |
| 2004 | £345,825 | -1% |
135 Properties |
| 2003 | £349,908 | 4% |
109 Properties |
| 2002 | £335,833 | 9% |
89 Properties |
| 2001 | £304,468 | -13% |
121 Properties |
| 2000 | £343,881 | 28% |
123 Properties |
| 1999 | £246,761 | 36% |
174 Properties |
| 1998 | £158,434 | -0,4% |
109 Properties |
| 1997 | £159,098 | 4% |
138 Properties |
| 1996 | £152,425 | 22% |
85 Properties |
| 1995 | £118,410 | - |
59 Properties |
Property Price per Property Type in Churchill
Here you can find historic sold price data in order to help with your property search.
The average Property Paid Price for specific property types in the last three years are:
| Property Type | Average Sold Price | Sold Properties |
|---|---|---|
| Flat | £1,610,988.00 | 253 Flats |
| Semi Detached House | £4,450,000.00 | 2 Semi Detached Houses |
| Terraced House | £5,298,554.00 | 57 Terraced Houses |