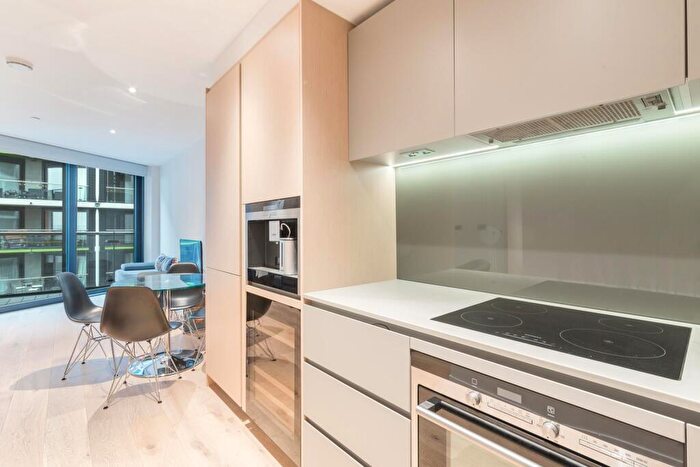
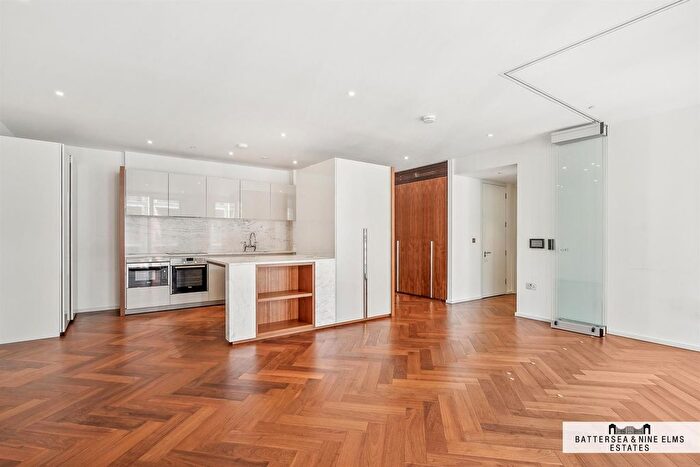
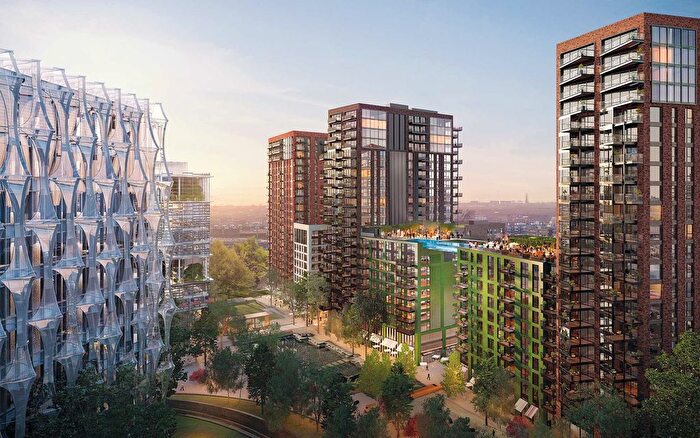
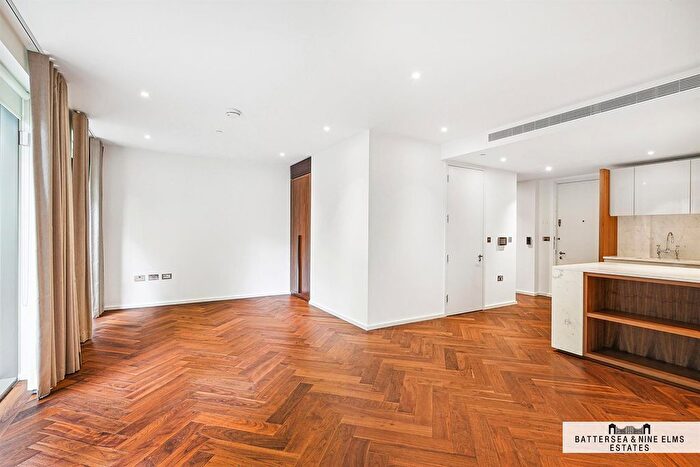
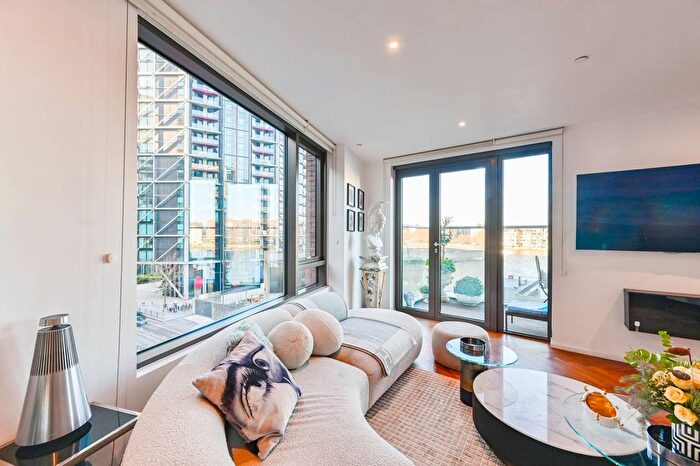
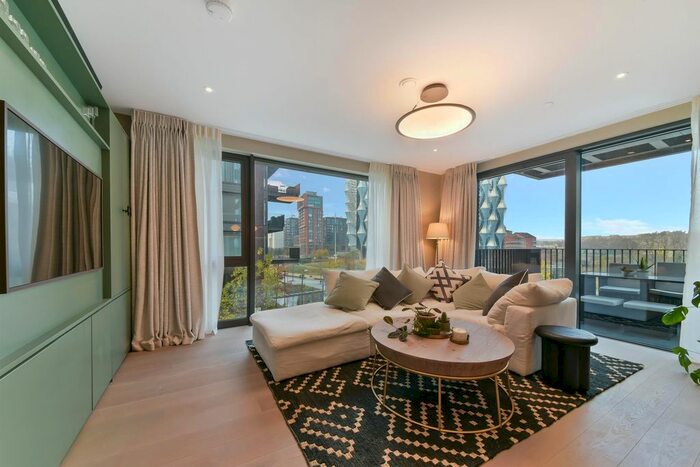
Houses for sale & to rent in Tachbrook, London
House Prices in Tachbrook
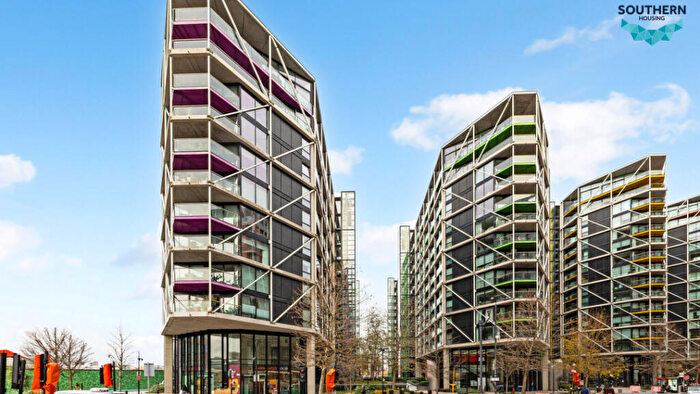
Properties in this part of Tachbrook within London have an average house price of £923,839.00 and had 285 Property Transactions within the last 3 years¹. This area has 4,362 households² , where the most expensive property was sold for £4,375,000.00.
Properties for sale in Tachbrook
Roads and Postcodes in Tachbrook
Navigate through our locations to find the location of your next house in Tachbrook, London for sale or to rent.
Transport near Tachbrook
-
Pimlico Station
-
Vauxhall Station
-
Victoria Station
-
Nine Elms Station
-
Battersea Power Station Station
-
St. James's Park Station
-
Battersea Park Station
-
Sloane Square Station
-
Westminster Station
-
Queenstown Road (Battersea) Station
- FAQ
- Price Paid By Year
- Property Type Price
Frequently asked questions about Tachbrook
What is the average price for a property for sale in Tachbrook?
The average price for a property for sale in Tachbrook is £923,839. This amount is 51% lower than the average price in London. There are more than 10,000 property listings for sale in Tachbrook.
What streets have the most expensive properties for sale in Tachbrook?
The streets with the most expensive properties for sale in Tachbrook are Bessborough Place at an average of £2,025,000, Lindsay Square at an average of £1,571,500 and Balvaird Place at an average of £1,391,666.
What streets have the most affordable properties for sale in Tachbrook?
The streets with the most affordable properties for sale in Tachbrook are Garden Terrace at an average of £385,000, Vauxhall Bridge Road at an average of £446,119 and Rampayne Street at an average of £531,666.
Which train stations are available in or near Tachbrook?
Some of the train stations available in or near Tachbrook are Vauxhall, Victoria and Battersea Park.
Which tube stations are available in or near Tachbrook?
Some of the tube stations available in or near Tachbrook are Pimlico, Vauxhall and Victoria.
Property Price Paid in Tachbrook by Year
The average sold property price by year was:
| Year | Average Sold Price | Price Change |
Sold Properties
|
|---|---|---|---|
| 2025 | £848,958 | -5% |
41 Properties |
| 2024 | £892,327 | 2% |
89 Properties |
| 2023 | £875,230 | -18% |
68 Properties |
| 2022 | £1,029,357 | -2% |
87 Properties |
| 2021 | £1,052,026 | 12% |
86 Properties |
| 2020 | £921,775 | 23% |
57 Properties |
| 2019 | £706,585 | -35% |
63 Properties |
| 2018 | £955,115 | -4% |
55 Properties |
| 2017 | £997,824 | 7% |
61 Properties |
| 2016 | £926,046 | -1% |
65 Properties |
| 2015 | £933,804 | -2% |
98 Properties |
| 2014 | £950,471 | 28% |
116 Properties |
| 2013 | £685,014 | -5% |
128 Properties |
| 2012 | £719,072 | -5% |
113 Properties |
| 2011 | £753,545 | 14% |
97 Properties |
| 2010 | £649,998 | 6% |
144 Properties |
| 2009 | £608,792 | 10% |
87 Properties |
| 2008 | £547,768 | -10% |
86 Properties |
| 2007 | £600,060 | 15% |
179 Properties |
| 2006 | £507,730 | 20% |
157 Properties |
| 2005 | £405,299 | 8% |
135 Properties |
| 2004 | £371,062 | -1% |
154 Properties |
| 2003 | £374,542 | -1% |
148 Properties |
| 2002 | £378,739 | 3% |
148 Properties |
| 2001 | £367,773 | -7% |
196 Properties |
| 2000 | £394,558 | 29% |
182 Properties |
| 1999 | £279,508 | 11% |
282 Properties |
| 1998 | £248,979 | 11% |
198 Properties |
| 1997 | £222,235 | 32% |
246 Properties |
| 1996 | £150,365 | 3% |
183 Properties |
| 1995 | £145,238 | - |
127 Properties |
Property Price per Property Type in Tachbrook
Here you can find historic sold price data in order to help with your property search.
The average Property Paid Price for specific property types in the last three years are:
| Property Type | Average Sold Price | Sold Properties |
|---|---|---|
| Flat | £810,757.00 | 259 Flats |
| Terraced House | £2,050,307.00 | 26 Terraced Houses |

