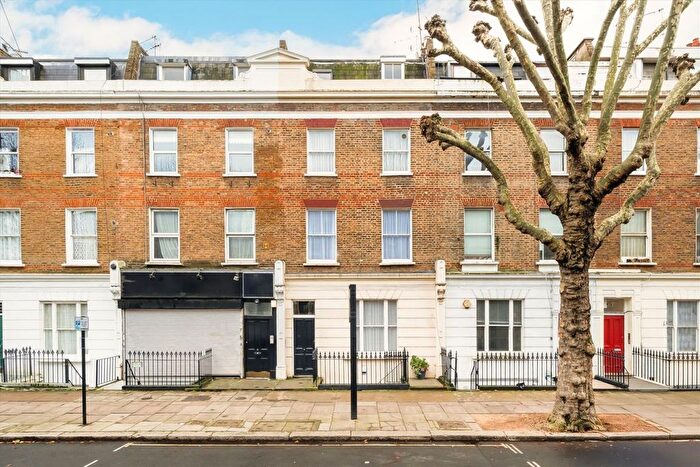
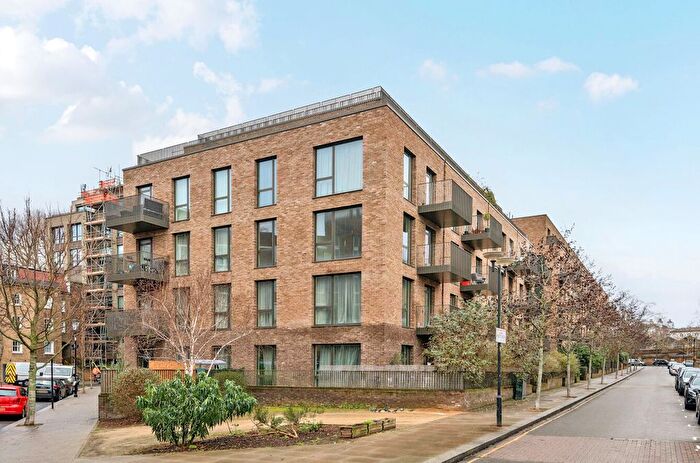
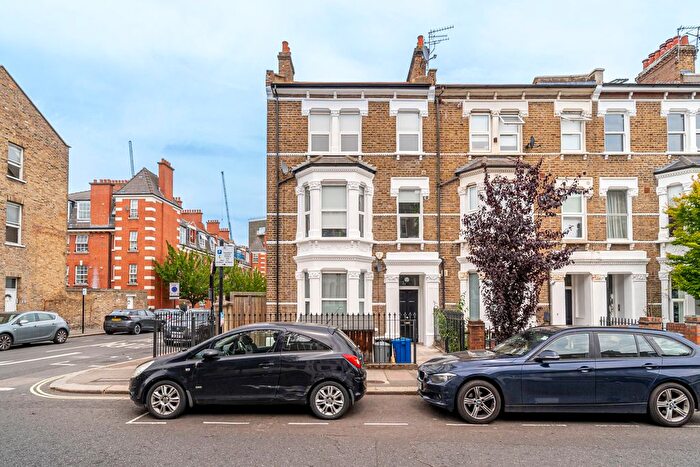
Houses for sale & to rent in W10 4NX, John Fearon Walk, Queens Park, London
House Prices in W10 4NX, John Fearon Walk, Queens Park
Properties in W10 4NX have an average house price of £315,000.00 and had 1 Property Transaction within the last 3 years.¹ W10 4NX is a postcode in John Fearon Walk located in Queens Park, an area in London, City of Westminster London Borough, with 20 households², where the most expensive property was sold for £315,000.00.
Properties for sale near W10 4NX, John Fearon Walk
Price Paid in John Fearon Walk, W10 4NX, Queens Park
NAYLOR HOUSE, 10 FLAT 47 John Fearon Walk, W10 4NX, Queens Park London
Property NAYLOR HOUSE, 10 FLAT 47 has been sold 4 times. The last time it was sold was in 19/09/2025 and the sold price was £315,000.00.
This is a Flat which was sold as a leasehold in 19/09/2025
| Date | Price | Property Type | Tenure | Classification |
|---|---|---|---|---|
| 19/09/2025 | £315,000.00 | Flat | leasehold | Established Building |
| 23/08/2019 | £370,000.00 | Flat | leasehold | Established Building |
| 05/10/2018 | £375,000.00 | Flat | leasehold | Established Building |
| 15/02/2016 | £345,000.00 | Flat | leasehold | Established Building |
NAYLOR HOUSE, 10 FLAT 51 John Fearon Walk, W10 4NX, Queens Park London
Property NAYLOR HOUSE, 10 FLAT 51 has been sold 2 times. The last time it was sold was in 06/11/2008 and the sold price was £277,500.00.
This is a Flat which was sold as a leasehold in 06/11/2008
| Date | Price | Property Type | Tenure | Classification |
|---|---|---|---|---|
| 06/11/2008 | £277,500.00 | Flat | leasehold | Established Building |
| 21/08/2006 | £238,500.00 | Flat | leasehold | Established Building |
Transport near W10 4NX, John Fearon Walk
-
Queens Park Station
-
Kilburn Park Station
-
Kensal Rise Station
-
Westbourne Park Station
-
Brondesbury Park Station
-
Kilburn High Road Station
-
Kensal Green Station
-
Maida Vale Station
-
Ladbroke Grove Station
-
Brondesbury Station
House price paid reports for W10 4NX, John Fearon Walk
Click on the buttons below to see price paid reports by year or property price:
- Price Paid By Year
- Property Type Price
Property Price Paid in W10 4NX, John Fearon Walk by Year
The average sold property price by year was:
| Year | Average Sold Price | Price Change |
Sold Properties
|
|---|---|---|---|
| 2025 | £315,000 | -17% |
1 Property |
| 2019 | £370,000 | -1% |
1 Property |
| 2018 | £375,000 | 8% |
1 Property |
| 2016 | £345,000 | 20% |
1 Property |
| 2008 | £277,500 | 14% |
1 Property |
| 2006 | £238,500 | - |
1 Property |
Property Price per Property Type in W10 4NX, John Fearon Walk
Here you can find historic sold price data in order to help with your property search.
The average Property Paid Price for specific property types in the last three years are:
| Property Type | Average Sold Price | Sold Properties |
|---|---|---|
| Flat | £315,000.00 | 1 Flat |

