
Houses for sale & to rent in St Peters, Wolverhampton
House Prices in St Peters
Properties in St Peters have an average house price of £149k and had 255 Property Transactions within the last 3 years¹.
St Peters is an area in Wolverhampton, City of Wolverhampton with 4,923 households², where the most expensive property was sold for £605k.
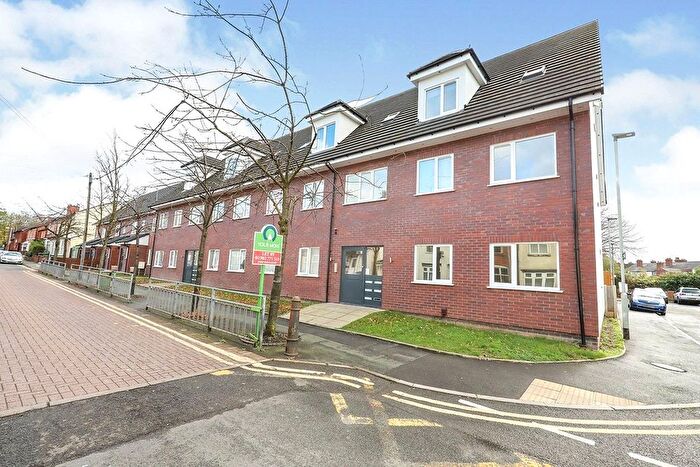
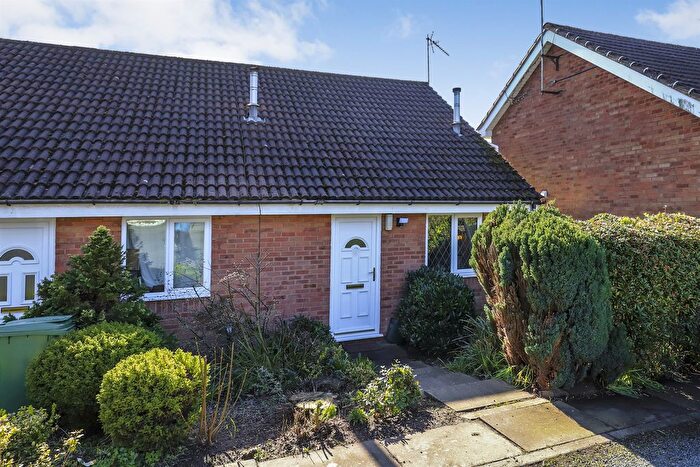
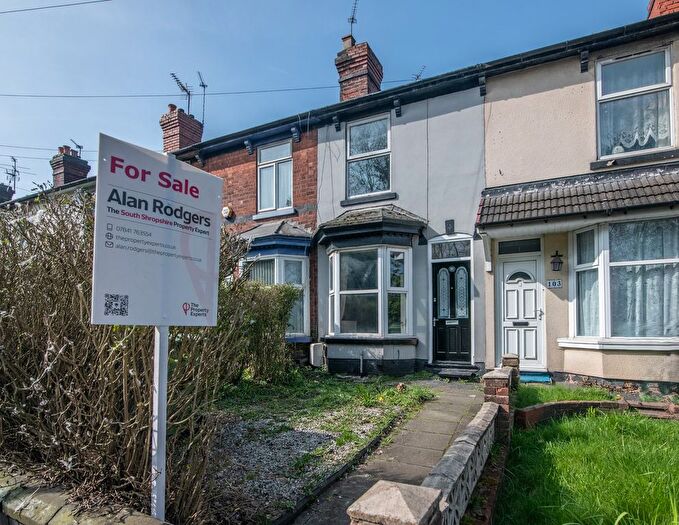
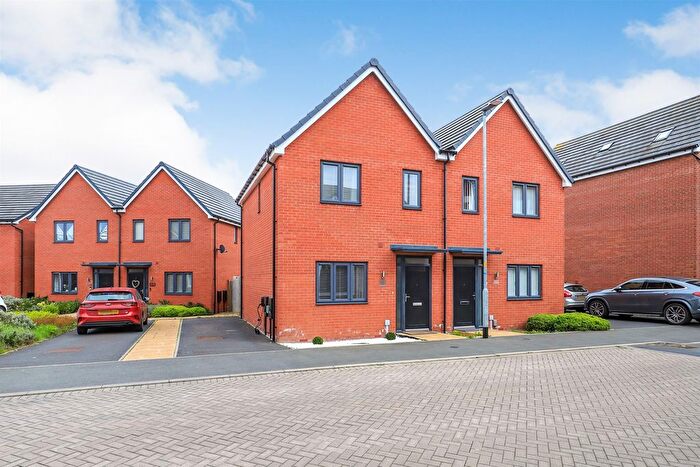
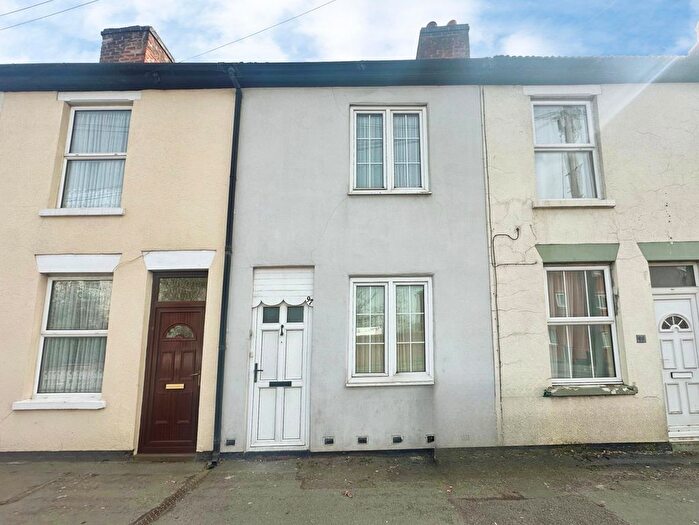
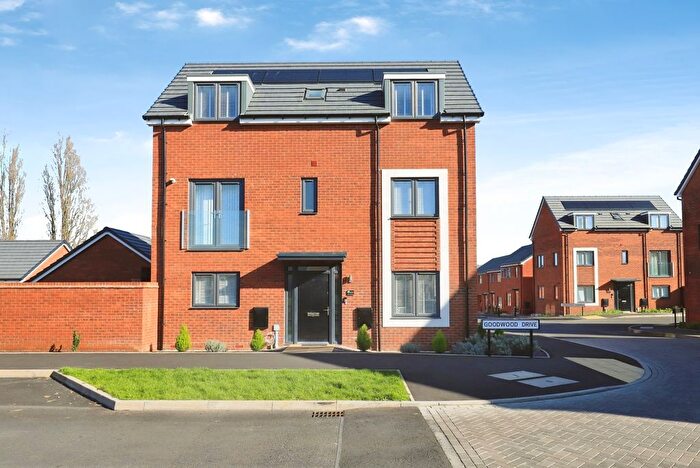
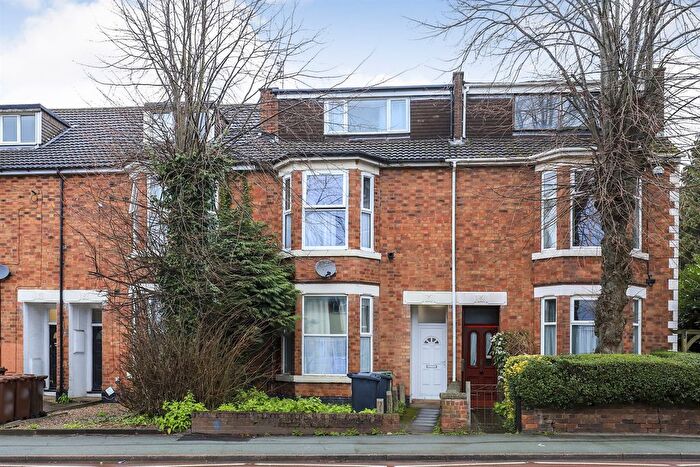
Properties for sale in St Peters
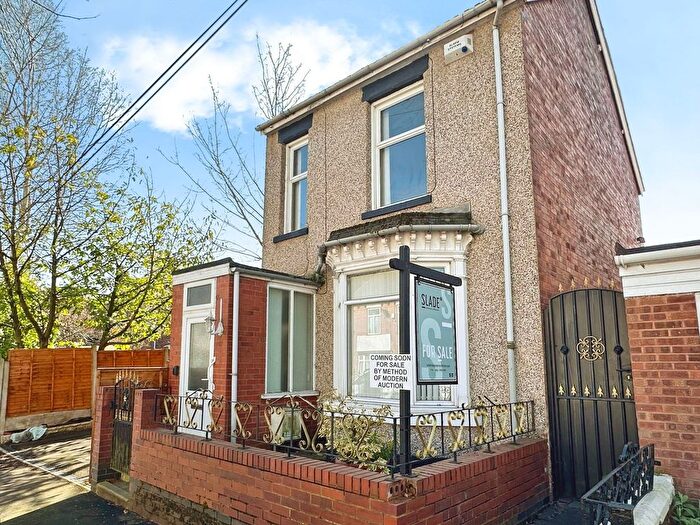
![]()
If you are looking to sell your house, let it out, or receive a property valuation, an expert can help you.
Click the button below to get started.

Roads and Postcodes in St Peters
Navigate through our locations to find the location of your next house in St Peters, Wolverhampton for sale or to rent.
Transport near St Peters

- FAQ
- Price Paid By Year
- Property Type Price
Frequently asked questions about St Peters
What is the average price for a property for sale in St Peters?
The average price for a property for sale in St Peters is £149,227. This amount is 32% lower than the average price in Wolverhampton. There are 2,176 property listings for sale in St Peters.
What streets have the most expensive properties for sale in St Peters?
The streets with the most expensive properties for sale in St Peters are Snow Hill at an average of £510,000, WATERLOO ROAD at an average of £383,333 and Hambrook Close at an average of £365,000.
What streets have the most affordable properties for sale in St Peters?
The streets with the most affordable properties for sale in St Peters are Manby Close at an average of £68,000, Hunter Street at an average of £72,022 and North Road at an average of £75,000.
Which train stations are available in or near St Peters?
Some of the train stations available in or near St Peters are Wolverhampton, Bilbrook and Codsall.
Property Price Paid in St Peters by Year
The average sold property price by year was:
| Year | Average Sold Price | Price Change |
Sold Properties
|
|---|---|---|---|
| 2026 | £93,000 | -63% |
2 Properties |
| 2025 | £151,553.09 | -2% |
79 Properties |
| 2024 | £154,763.62 | 8% |
86 Properties |
| 2023 | £143,006.19 | -9% |
88 Properties |
| 2022 | £155,638.14 | 15% |
103 Properties |
| 2021 | £132,752.59 | 10% |
136 Properties |
| 2020 | £120,106.15 | 3% |
79 Properties |
| 2019 | £117,050.91 | -1% |
110 Properties |
| 2018 | £117,883.74 | 14% |
107 Properties |
| 2017 | £101,808.25 | -7% |
134 Properties |
| 2016 | £109,421.31 | 2% |
107 Properties |
| 2015 | £107,021.91 | -3% |
133 Properties |
| 2014 | £110,497 | 16% |
105 Properties |
| 2013 | £93,133 | 2% |
70 Properties |
| 2012 | £90,969 | 3% |
38 Properties |
| 2011 | £87,892 | -3% |
48 Properties |
| 2010 | £90,185.18 | 0,3% |
56 Properties |
| 2009 | £89,949.19 | -14% |
62 Properties |
| 2008 | £102,103 | -5% |
82 Properties |
| 2007 | £107,217.53 | -2% |
193 Properties |
| 2006 | £109,597 | 7% |
151 Properties |
| 2005 | £101,603.38 | 4% |
146 Properties |
| 2004 | £97,368.76 | 14% |
156 Properties |
| 2003 | £83,551.79 | 39% |
206 Properties |
| 2002 | £51,120 | 13% |
207 Properties |
| 2001 | £44,329.13 | 8% |
192 Properties |
| 2000 | £40,933.88 | 9% |
169 Properties |
| 1999 | £37,107.23 | -5% |
162 Properties |
| 1998 | £38,798 | -10% |
154 Properties |
| 1997 | £42,734.29 | 21% |
209 Properties |
| 1996 | £33,857 | 3% |
130 Properties |
| 1995 | £32,785 | - |
113 Properties |
Property Price per Property Type in St Peters
Here you can find historic sold price data in order to help with your property search.
The average Property Paid Price for specific property types in the last three years are:
| Property Type | Average Sold Price | Sold Properties |
|---|---|---|
| Flat | £104,788.21 | 33 Flats |
| Semi Detached House | £175,217.68 | 65 Semi Detached Houses |
| Detached House | £244,146.88 | 16 Detached Houses |
| Terraced House | £136,875.18 | 141 Terraced Houses |