
Houses for sale in Bugle, Bodmin
House Prices in Bugle
Properties in Bugle have an average house price of £349k and had 31 Property Transactions within the last 3 years¹.
Bugle is an area in Bodmin, Cornwall with 419 households², where the most expensive property was sold for £900k.
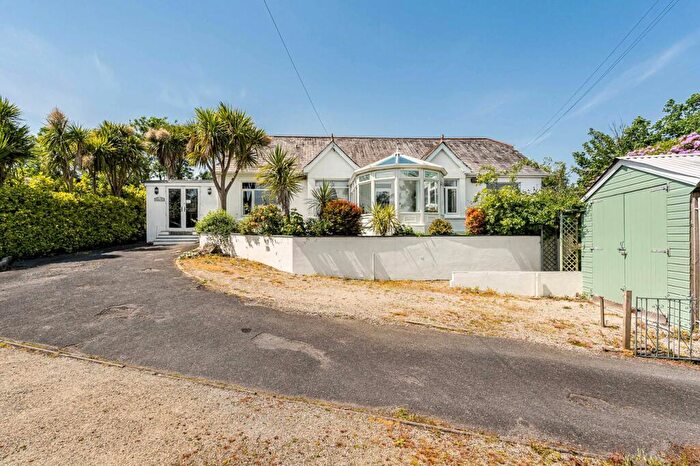
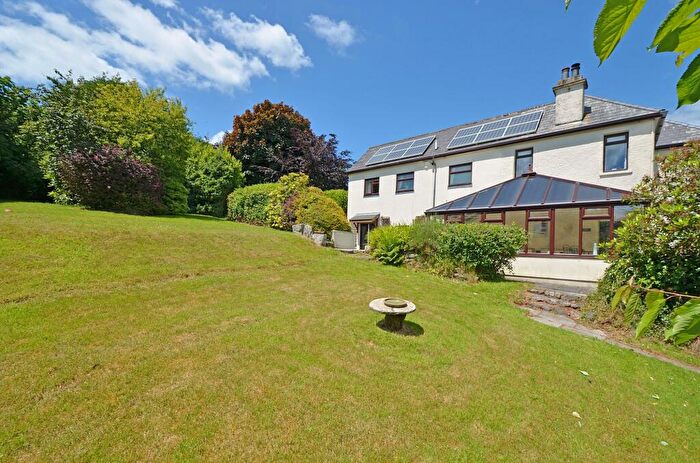
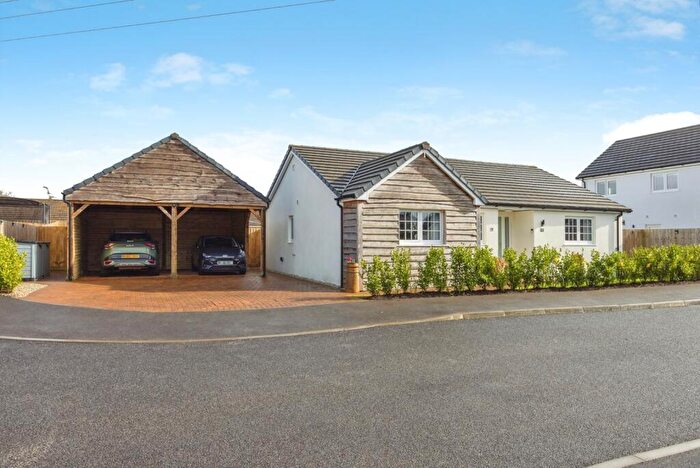
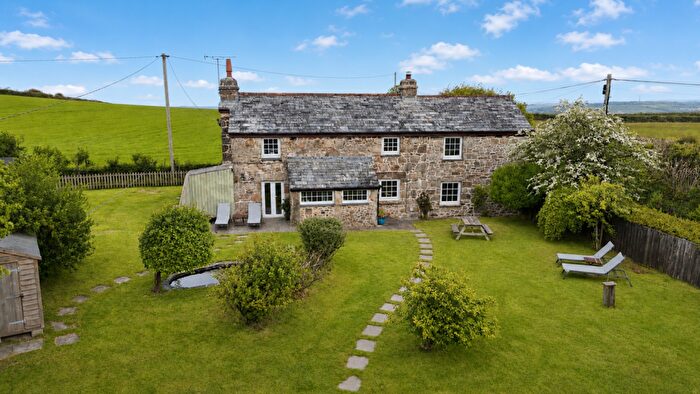
Properties for sale in Bugle
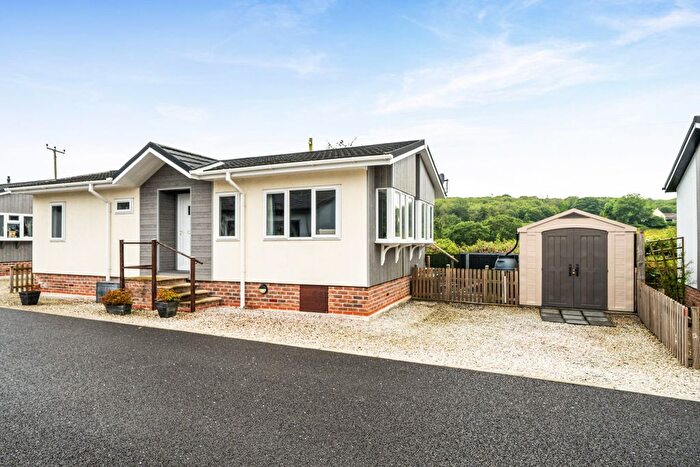
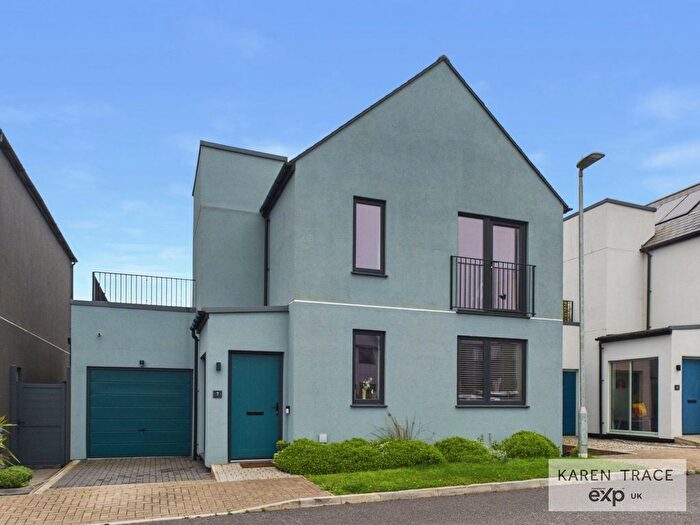
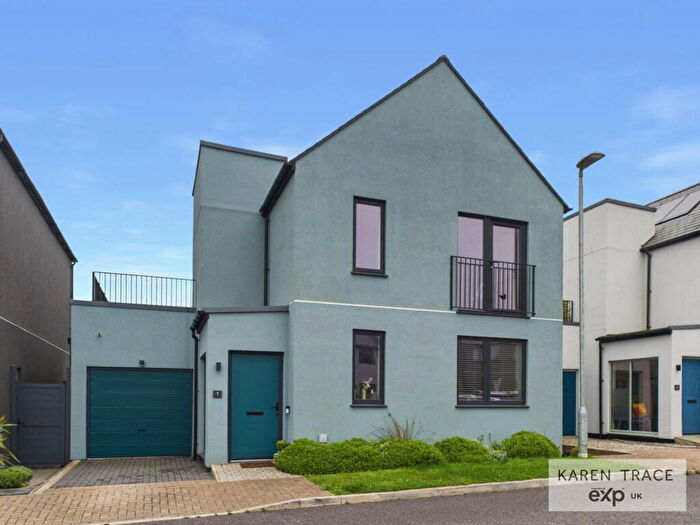
![]()
If you are looking to sell your house, let it out, or receive a property valuation, an expert can help you.
Click the button below to get started.
Roads and Postcodes in Bugle
Navigate through our locations to find the location of your next house in Bugle, Bodmin for sale or to rent.
| Streets | Postcodes |
|---|---|
| Beam Villas | PL30 5HY |
| Beswetherick Field | PL30 5FB PL30 5FD |
| Bridges | PL30 5EF |
| Challow Terrace | PL30 5DP |
| Croft Farm Park | PL30 5EH PL30 5EW |
| Lower Mill Terrace | PL30 5DZ |
| Railway Terrace | PL30 5EG |
| Rosevale Gardens | PL30 5EP |
| St Cyriac | PL30 5QA |
| St Julitta | PL30 5ED |
| St Sulien | PL30 5EB |
| Treskilling | PL30 5EJ PL30 5EL |
| PL30 5FA PL30 5DJ PL30 5DN PL30 5DR PL30 5DS PL30 5DT PL30 5DU PL30 5DW PL30 5DX PL30 5EA PL30 5EE PL30 5EN PL30 5EQ PL30 5HU PL30 5HX PL30 5HZ PL30 5JE |
Property price trends in Bugle
According to the latest Land Registry data, the average home in Bugle sold for £190,000 in 2026. That figure comes from 371 sales logged over the past 31 years.
Prices have fallen back over the last three years. Compared with 2023, when the typical sale came in around £332,847, that's a fall of roughly 42.9%.
Looking back five years, average prices are down about 41.7% since 2021, a drop of around £135,653 in cash terms.
Zoom out to the past decade for the fuller picture. Back in 2016, homes here averaged £224,359, so the typical sold price has fallen about 15.3% since then, around 1.6% a year lower. Stretch the view to fifteen years and that annual pace edges up closer to -0.4%.
Frequently asked questions about Bugle
What is the average price for a property for sale in Bugle?
The average price for a property for sale in Bugle is £348,631. This amount is 15% higher than the average price in Bodmin. There are 643 property listings for sale in Bugle.
What streets have the most expensive properties for sale in Bugle?
The streets with the most expensive properties for sale in Bugle are Rosevale Gardens at an average of £462,500, St Cyriac at an average of £409,000 and Treskilling at an average of £346,000.
What streets have the most affordable properties for sale in Bugle?
The streets with the most affordable properties for sale in Bugle are Beswetherick Field at an average of £149,312, St Julitta at an average of £270,000 and Bridges at an average of £310,000.
Which train stations are available in or near Bugle?
Some of the train stations available in or near Bugle are Luxulyan, Bugle and Par.
Property Price Paid in Bugle by Year
The average sold property price by year was:
| Year | Average Sold Price | Price Change |
Sold Properties
|
|---|---|---|---|
| 2026 | £190,000 | -54% |
1 Property |
| 2025 | £292,086 | -51% |
11 Properties |
| 2024 | £440,900 | 25% |
10 Properties |
| 2023 | £332,847 | 10% |
9 Properties |
| 2022 | £298,250 | -9% |
18 Properties |
| 2021 | £325,653 | -9% |
15 Properties |
| 2020 | £355,500 | 47% |
13 Properties |
| 2019 | £187,000 | -18% |
7 Properties |
| 2018 | £220,812 | -14% |
12 Properties |
| 2017 | £251,495 | 11% |
11 Properties |
Property Price per Property Type in Bugle
Here you can find historic sold price data in order to help with your property search.
The average Property Paid Price for specific property types in the last three years are:
| Property Type | Average Sold Price | Sold Properties |
|---|---|---|
| Semi Detached House | £250,111.00 | 9 Semi Detached Houses |
| Terraced House | £214,906.00 | 4 Terraced Houses |
| Detached House | £444,526.00 | 17 Detached Houses |
| Flat | £140,000.00 | 1 Flat |
