
Houses for sale in Bodmin, Cornwall
House Prices in Bodmin
Properties in Bodmin have an average house price of £304k and had 989 Property Transactions within the last 3 years.¹
Bodmin is an area in Cornwall with 11,773 households², where the most expensive property was sold for £2.75M.
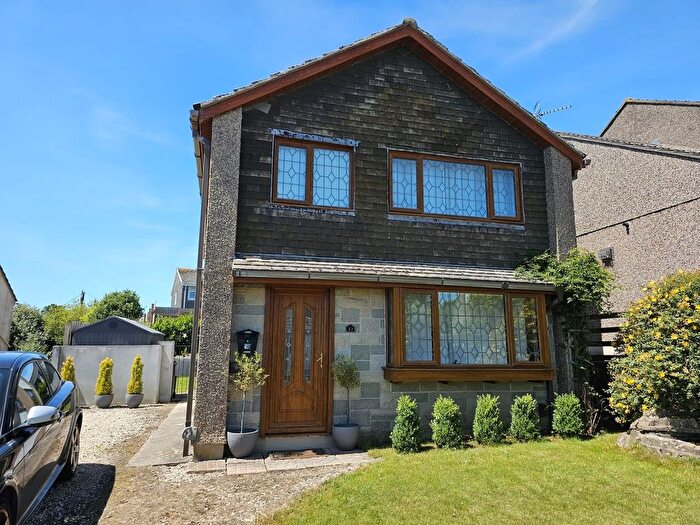
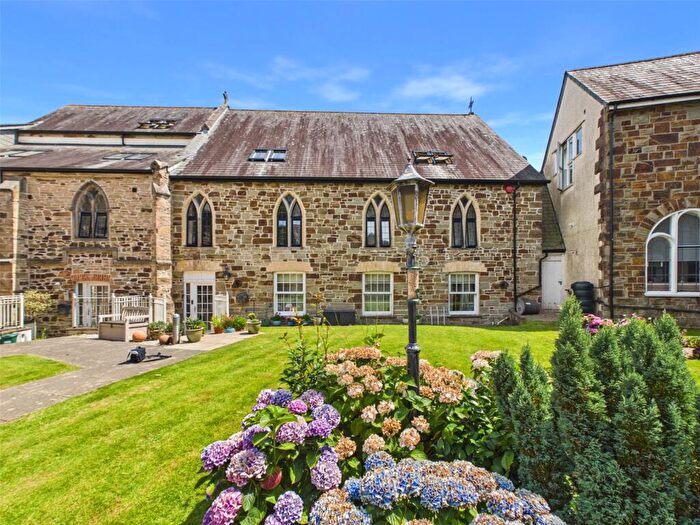
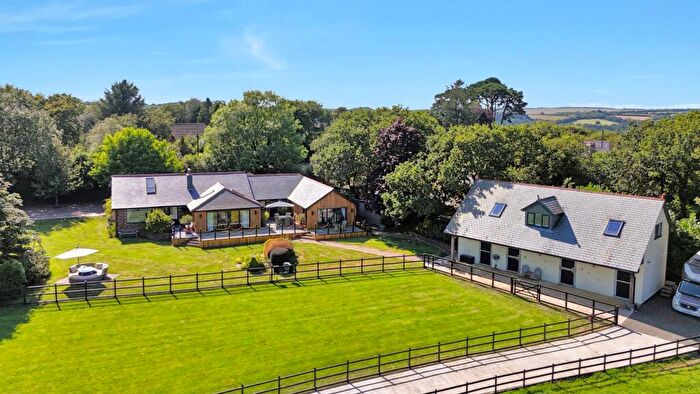
Properties for sale in Bodmin
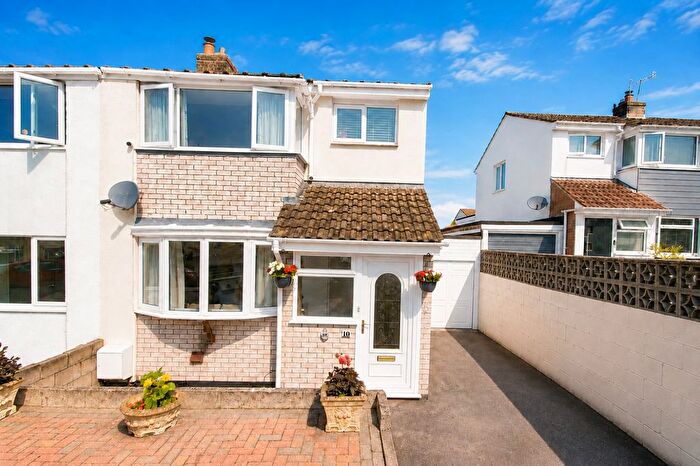
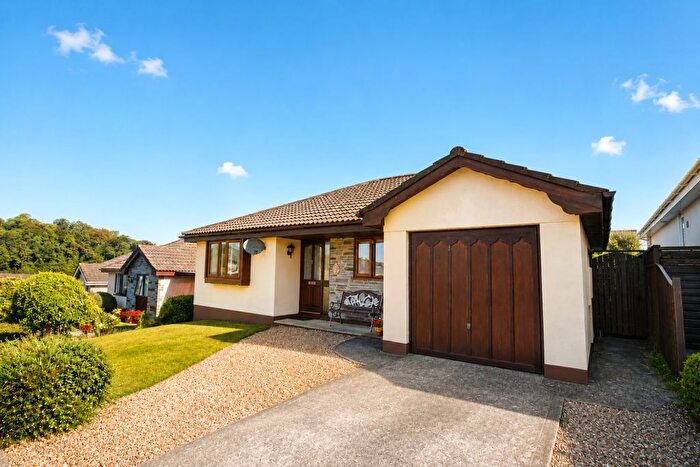
![]()
If you are looking to sell your house, let it out, or receive a property valuation, an expert can help you.
Click the button below to get started.


Neighbourhoods in Bodmin
Navigate through our locations to find the location of your next house in Bodmin, Cornwall for sale or to rent.
- Bodmin St Leonard
- Bodmin St Marys
- Bodmin St Petroc
- Bugle
- Camelford
- Lanivet And Blisland
- Lostwithiel
- St Cleer
- St Columb Major
- St Issey And St Tudy
- St Minver And St Endellion
- St Teath And St Breward
- Wadebridge East
- St Teath & Tintagel
- Lostwithiel & Lanreath
- Lanivet, Blisland & Bodmin St Lawrence
- Bodmin St Petroc's
Property price trends in Bodmin
According to the latest Land Registry data, the average home in Bodmin sold for £274,055 in 2026. That figure comes from a substantial record of 13,169 sales logged over the past 31 years.
Prices have fallen back over the last three years. Compared with 2023, when the typical sale came in around £326,218, that's a fall of roughly 16%.
Looking back five years, average prices are down about 7.2% since 2021, a drop of around £21,356 in cash terms.
Zoom out to the past decade for the fuller picture. Back in 2016, homes here averaged £216,334, so the typical sold price has climbed about 26.7% since then, roughly 2.4% a year. Stretch the view to fifteen years and that annual pace eases back to about 1.8%.
Frequently asked questions about Bodmin
What is the average price for a property for sale in Bodmin?
The average price for a property for sale in Bodmin is £303,966. This amount is 12% lower than the average price in Cornwall. There are more than 10,000 property listings for sale in Bodmin.
What locations have the most expensive properties for sale in Bodmin?
The locations with the most expensive properties for sale in Bodmin are St Minver And St Endellion at an average of £550,857, Lostwithiel at an average of £498,333 and Lanivet And Blisland at an average of £426,504.
What locations have the most affordable properties for sale in Bodmin?
The locations with the most affordable properties for sale in Bodmin are Bodmin St Leonard at an average of £201,264, Bodmin St Marys at an average of £235,095 and Bodmin St Petroc at an average of £269,080.
Which train stations are available in or near Bodmin?
Some of the train stations available in or near Bodmin are Bodmin Parkway, Lostwithiel and Roche.
Property Price Paid in Bodmin by Year
The average sold property price by year was:
| Year | Average Sold Price | Price Change |
Sold Properties
|
|---|---|---|---|
| 2026 | £274,055 | -1% |
18 Properties |
| 2025 | £275,893 | -13% |
328 Properties |
| 2024 | £312,720 | -4% |
338 Properties |
| 2023 | £326,218 | 10% |
305 Properties |
| 2022 | £295,177 | -0,1% |
369 Properties |
| 2021 | £295,411 | 12% |
531 Properties |
| 2020 | £259,457 | 10% |
412 Properties |
| 2019 | £232,289 | -0,2% |
457 Properties |
| 2018 | £232,659 | 5% |
383 Properties |
| 2017 | £221,122 | 2% |
506 Properties |
Property Price per Property Type in Bodmin
Here you can find historic sold price data in order to help with your property search.
The average Property Paid Price for specific property types in the last three years are:
| Property Type | Average Sold Price | Sold Properties |
|---|---|---|
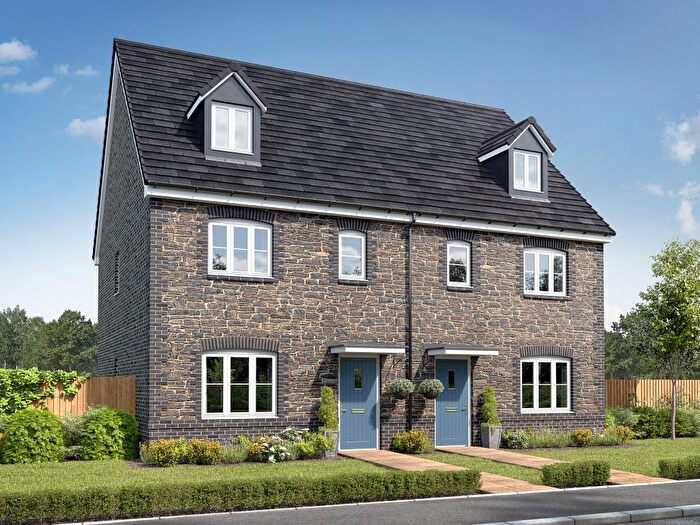
| Semi Detached House | £238,884.00 | 214 Semi Detached Houses |
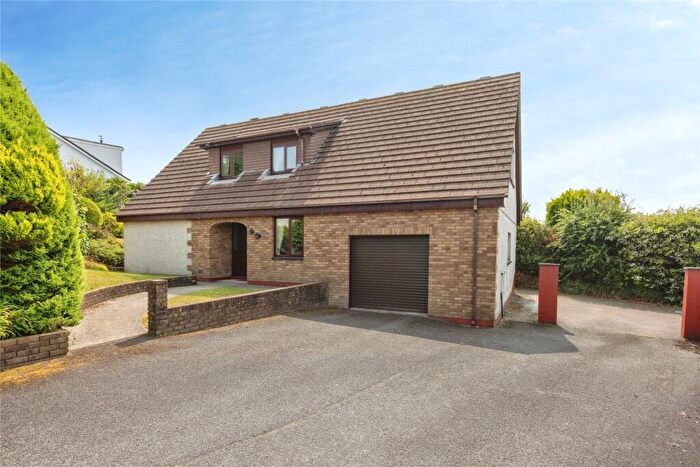
| Detached House | £437,333.00 | 436 Detached Houses |
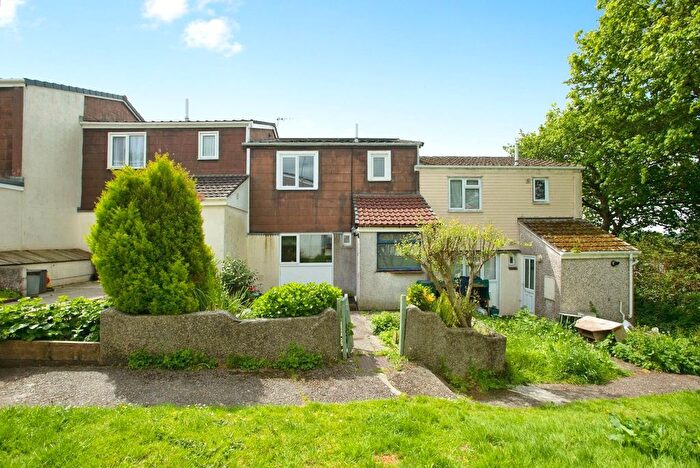
| Terraced House | £191,719.00 | 257 Terraced Houses |
| Flat | £116,484.00 | 82 Flats |
Transport in Bodmin
Please see below transportation links in this area:
