
Houses for sale in EX23 8GD, Hobbacott Close, Bude, Bude
House Prices in EX23 8GD, Hobbacott Close, Bude
Properties in EX23 8GD have no sales history available within the last 3 years. EX23 8GD is a postcode in Hobbacott Close located in Bude, an area in Bude, Cornwall, with 13 households².
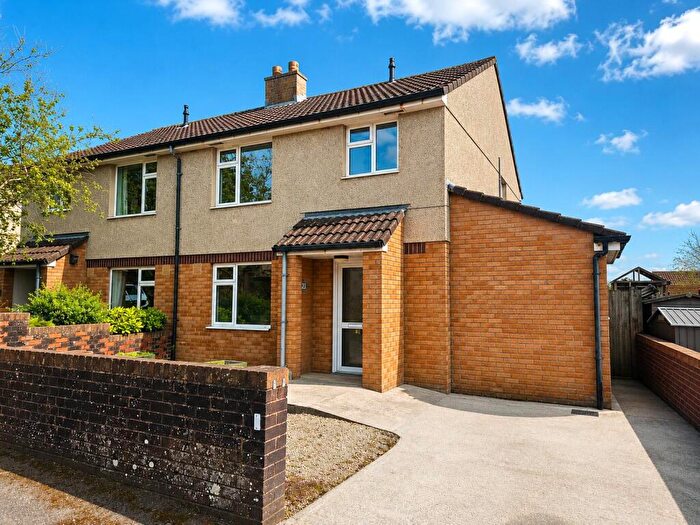
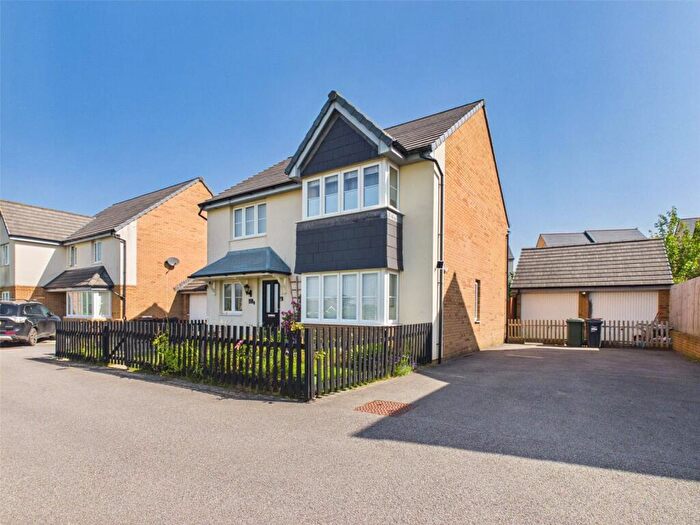
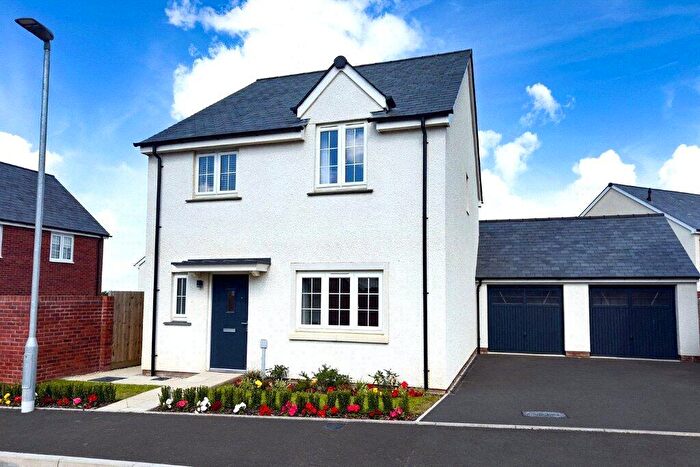
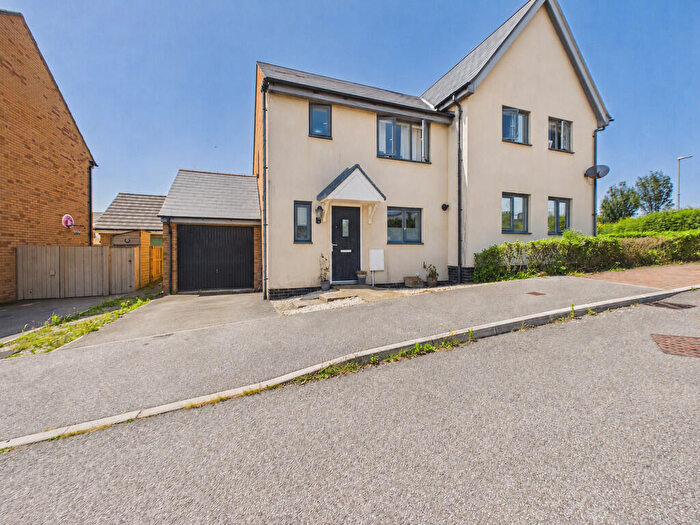
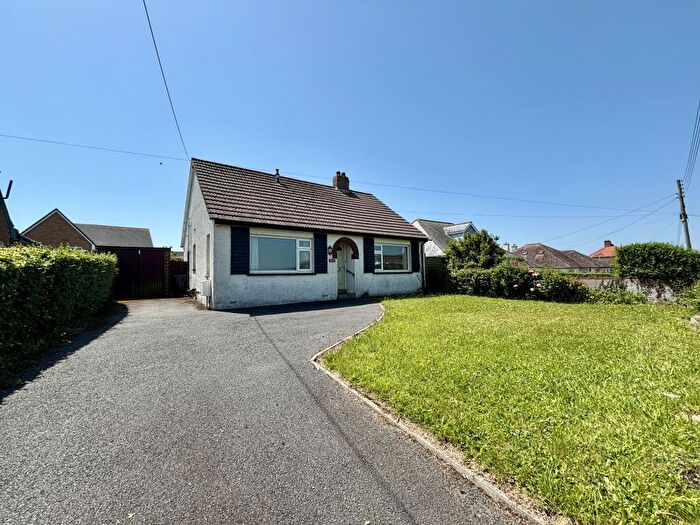
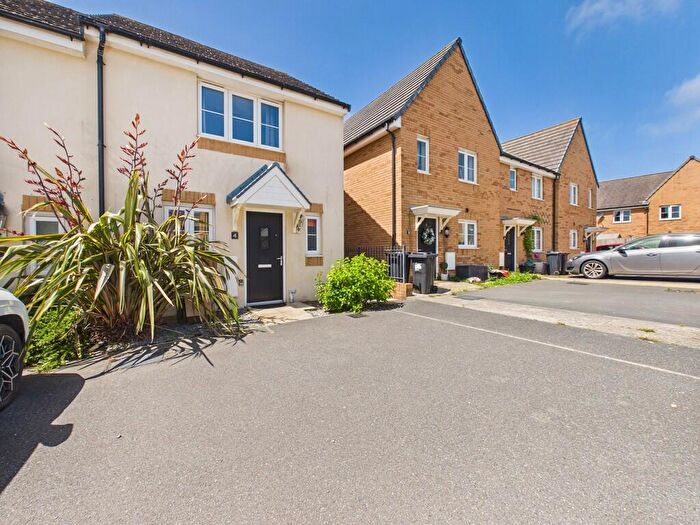
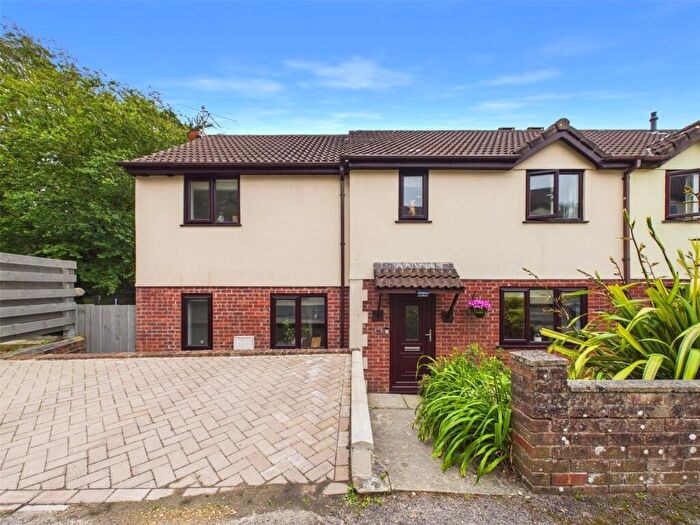
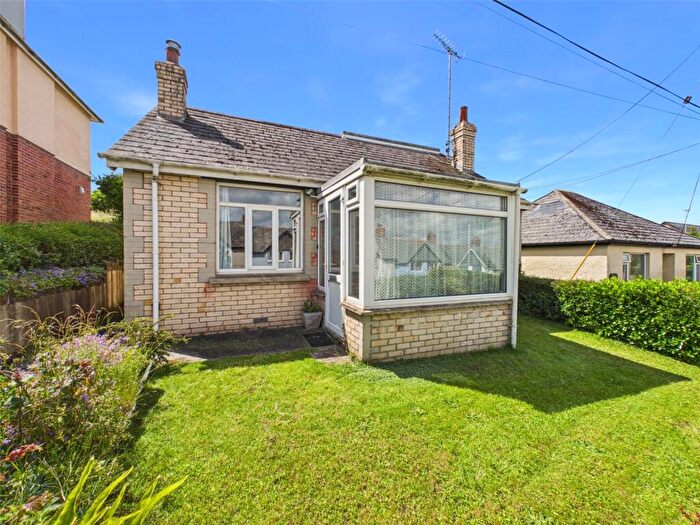
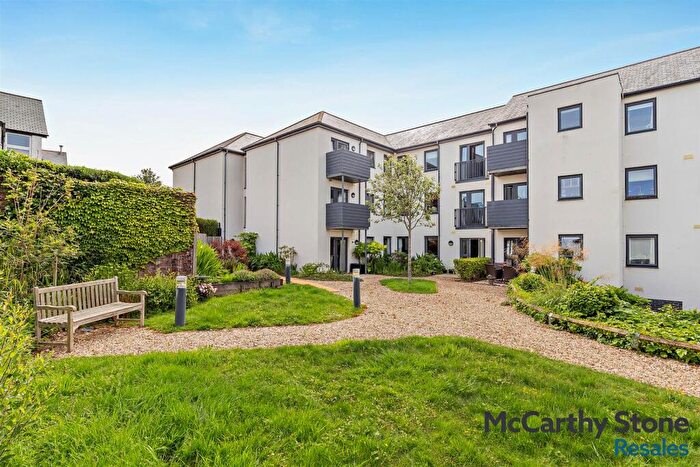
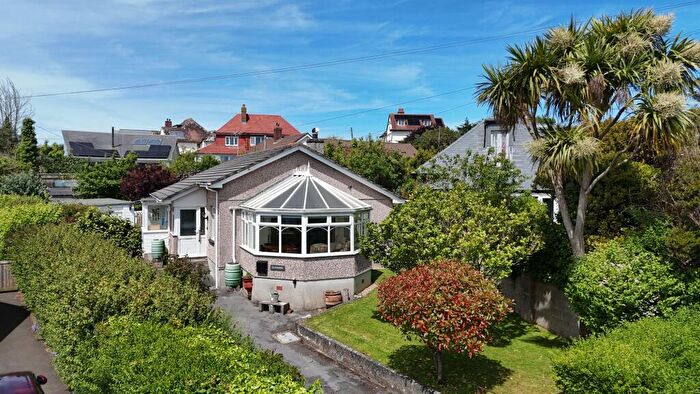
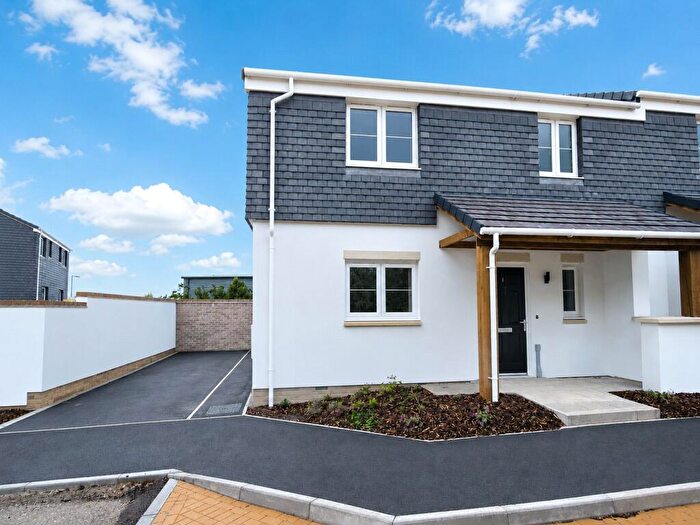
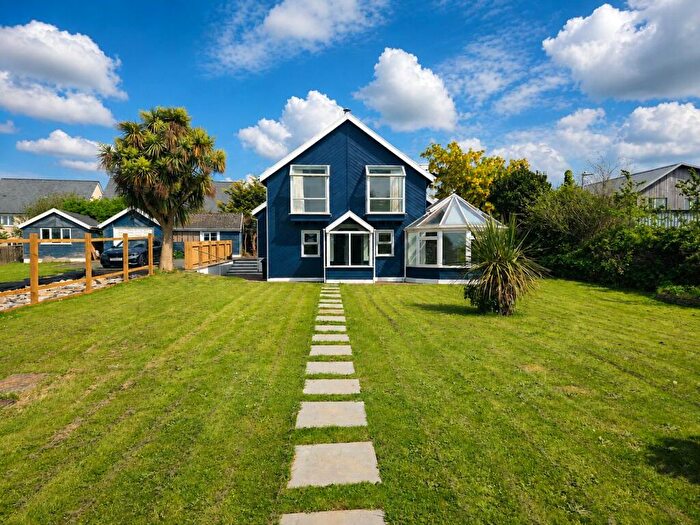
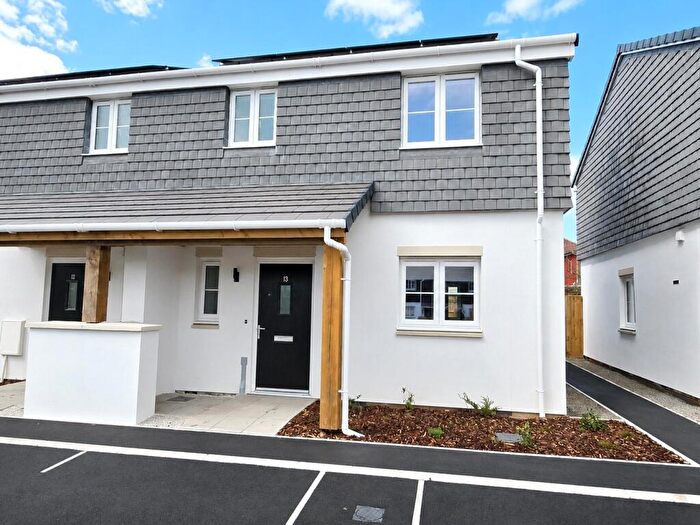
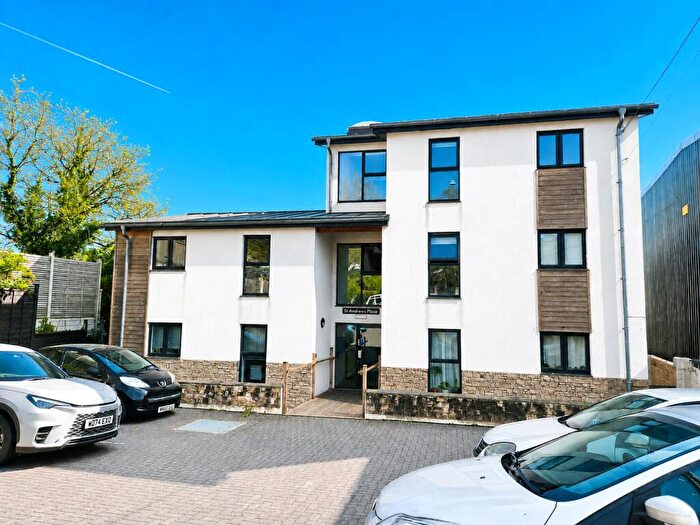
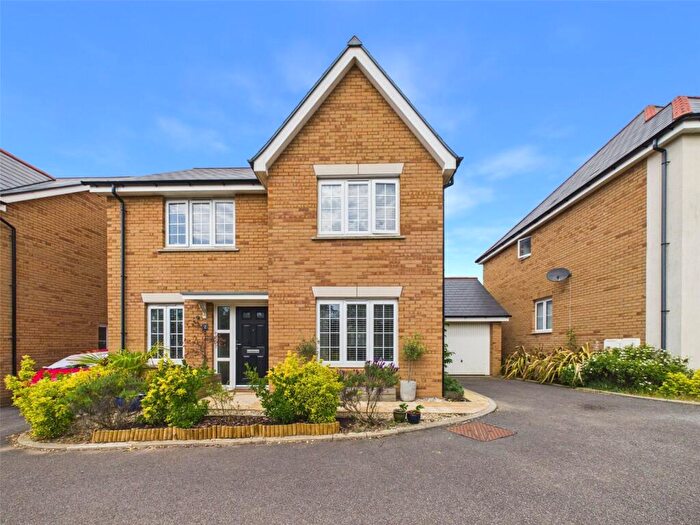
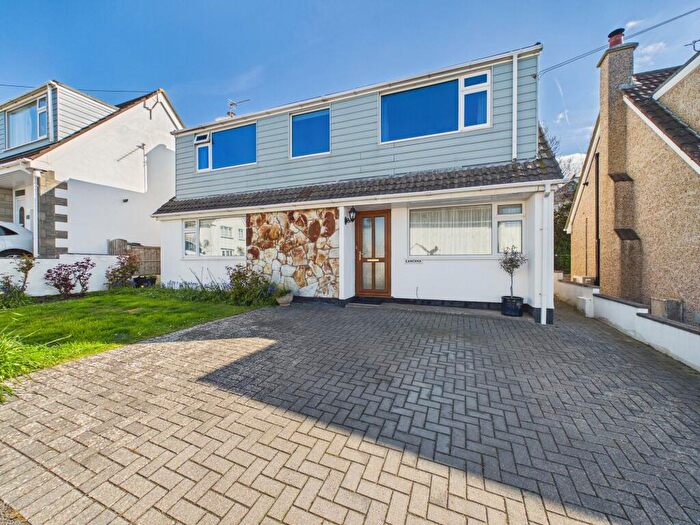
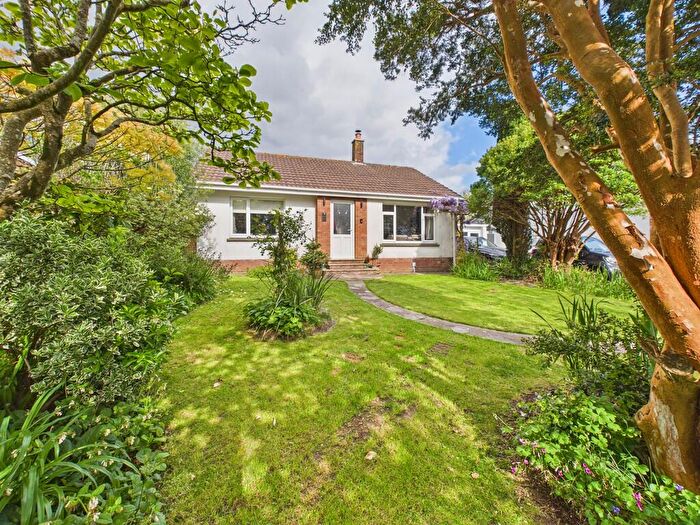
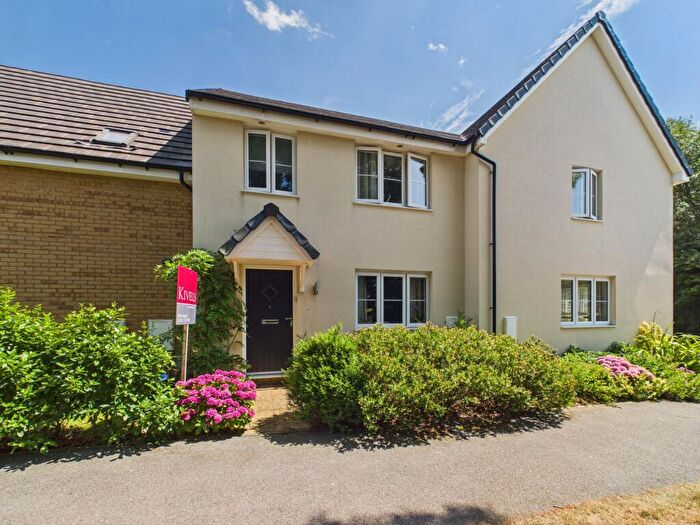
Properties for sale near EX23 8GD, Hobbacott Close
![]()
If you are looking to sell your house, let it out, or receive a property valuation, an expert can help you.
Click the button below to get started.

Price Paid in Hobbacott Close, EX23 8GD, Bude
7 Hobbacott Close, EX23 8GD, Bude Bude
Property 7 has been sold 2 times. The last time it was sold was in 27/01/2017 and the sold price was £215,000.00.
This detached house, sold as a freehold on 27/01/2017, is a 86 sqm detached house with an EPC rating of C.
| Date | Price | Property Type | Tenure | Classification |
|---|---|---|---|---|
| 27/01/2017 | £215,000.00 | Detached House | freehold | Established Building |
| 28/04/2008 | £209,950.00 | Detached House | freehold | Established Building |
6 Hobbacott Close, EX23 8GD, Bude Bude
Property 6 has been sold 2 times. The last time it was sold was in 21/01/2016 and the sold price was £209,000.00.
This detached house, sold as a freehold on 21/01/2016, is a 85 sqm detached house with an EPC rating of C.
| Date | Price | Property Type | Tenure | Classification |
|---|---|---|---|---|
| 21/01/2016 | £209,000.00 | Detached House | freehold | Established Building |
| 25/04/2008 | £209,950.00 | Semi Detached House | freehold | New Build |
15 Hobbacott Close, EX23 8GD, Bude Bude
This is a 52 square meter Top-floor Flat with an EPC rating of C. Currently, there is no transaction history available for this property.
Property price trends in EX23 8GD, Hobbacott Close
According to the latest Land Registry data, the average home in EX23 8GD, Hobbacott Close sold for £215,000 in 2017. That figure comes from 4 sales logged over the past 9 years.
Zoom out to the past decade for the fuller picture. Back in 2008, homes here averaged £209,950, so the typical sold price has climbed about 2.4% since then, roughly 0.3% a year.
Property Price Paid in EX23 8GD, Hobbacott Close by Year
The average sold property price by year was:
| Year | Average Sold Price | Price Change |
Sold Properties
|
|---|---|---|---|
| 2017 | £215,000 | 3% |
1 Property |
| 2016 | £209,000 | -0,5% |
1 Property |
| 2008 | £209,950 | - |
2 Properties |
