
Houses for sale in Perranporth, Newquay
House Prices in Perranporth
Properties in Perranporth have an average house price of £635k and had 2 Property Transactions within the last 3 years¹.
Perranporth is an area in Newquay, Cornwall with 23 households², where the most expensive property was sold for £800k.
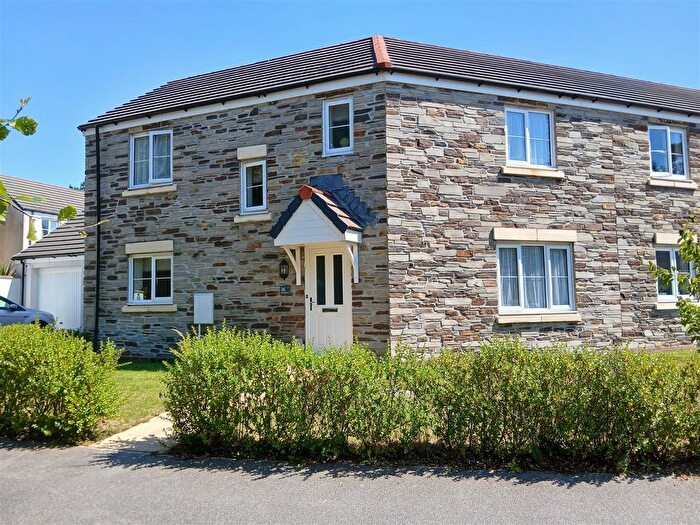
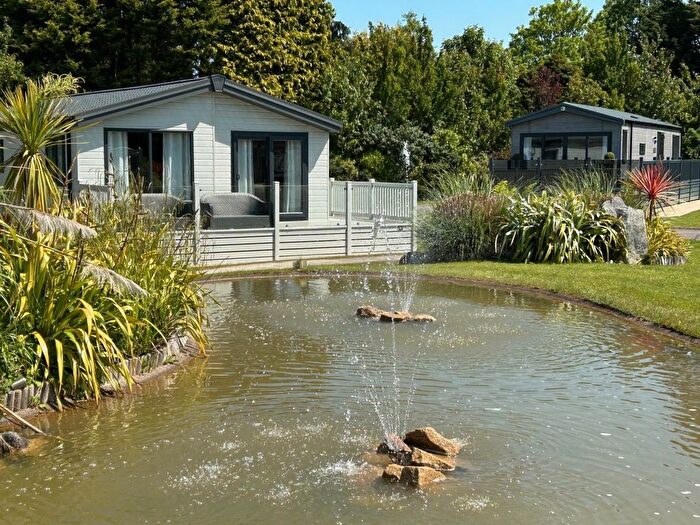
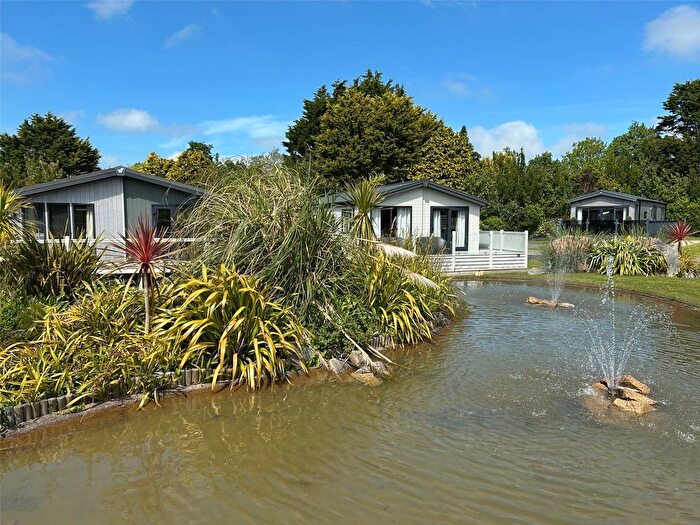
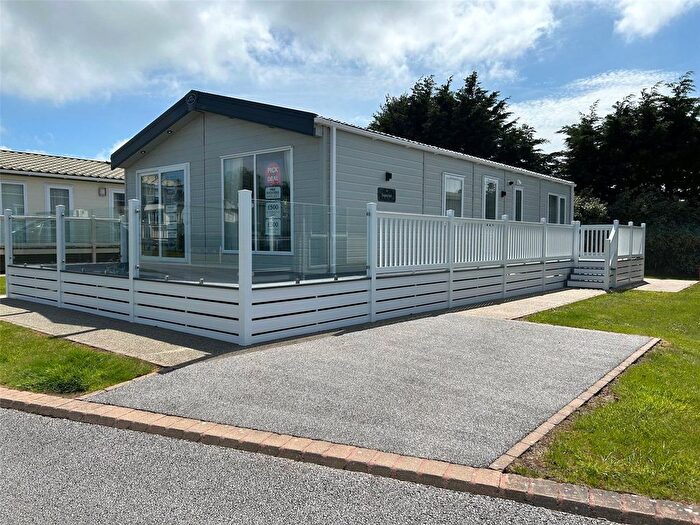
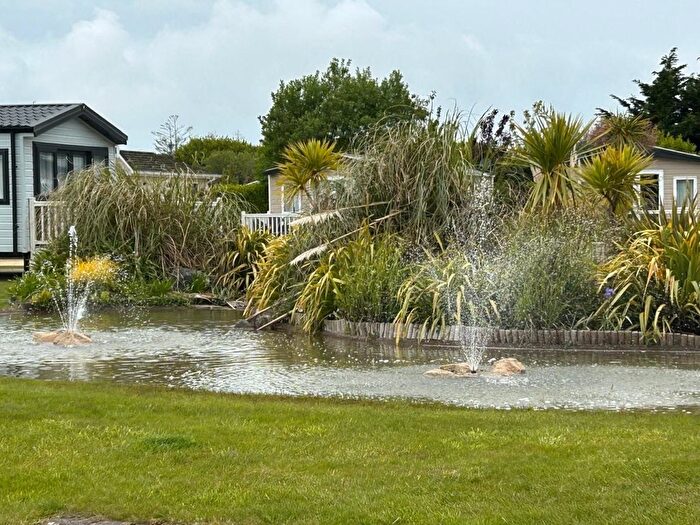
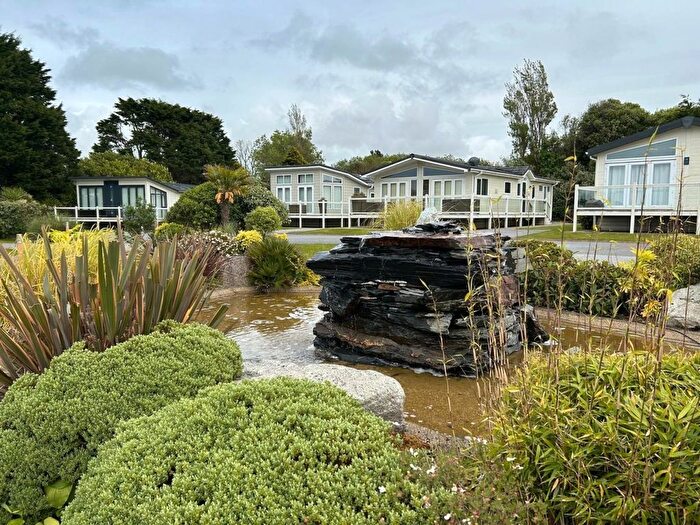
Properties for sale in Perranporth
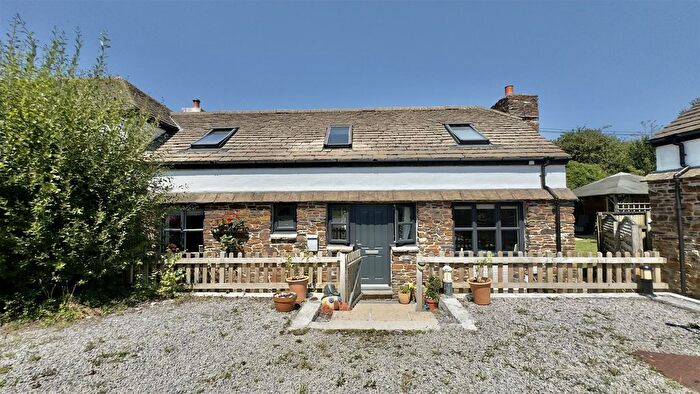
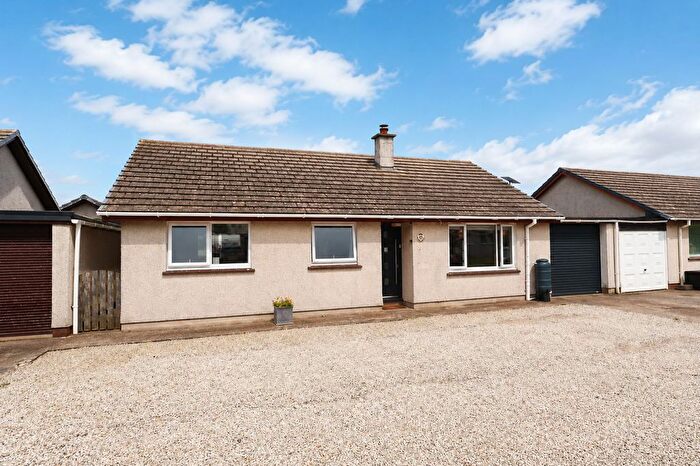
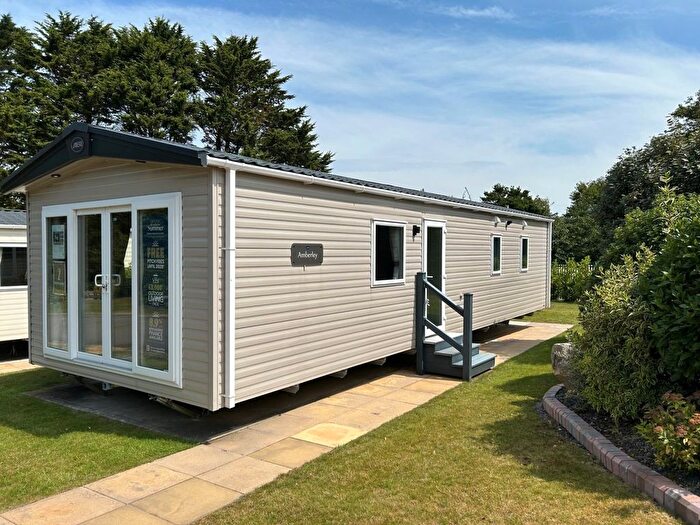
![]()
If you are looking to sell your house, let it out, or receive a property valuation, an expert can help you.
Click the button below to get started.
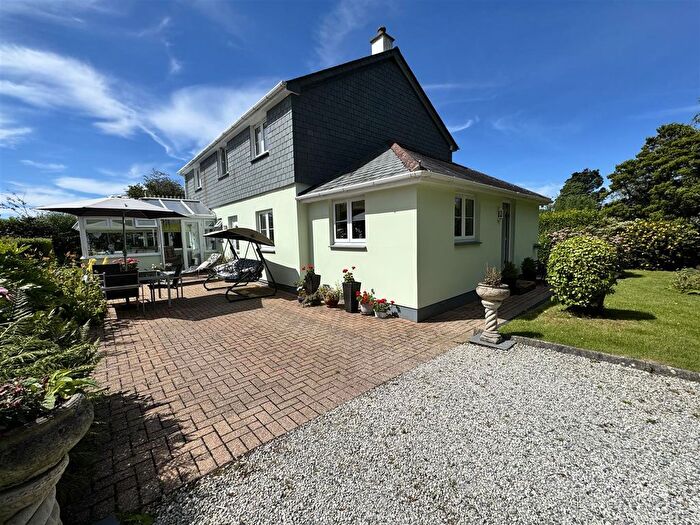
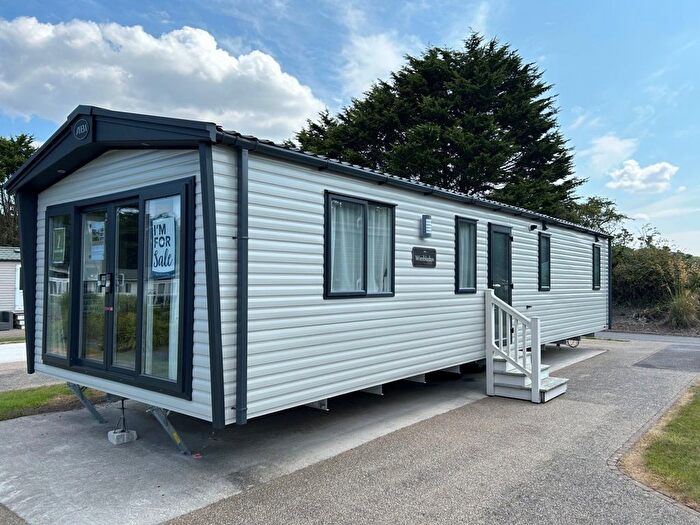
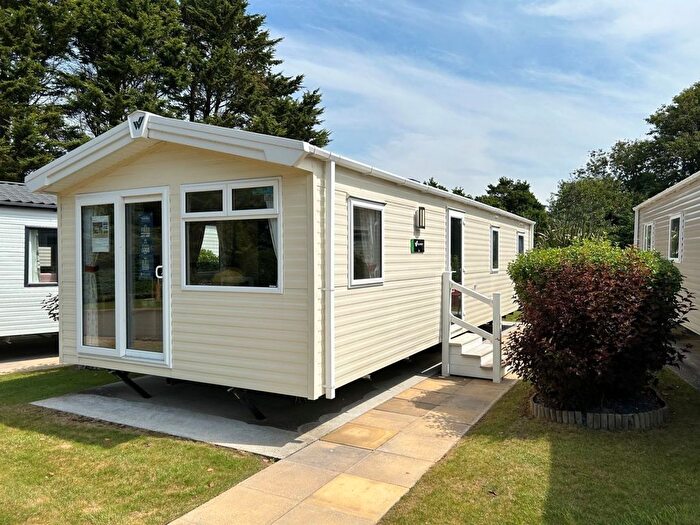
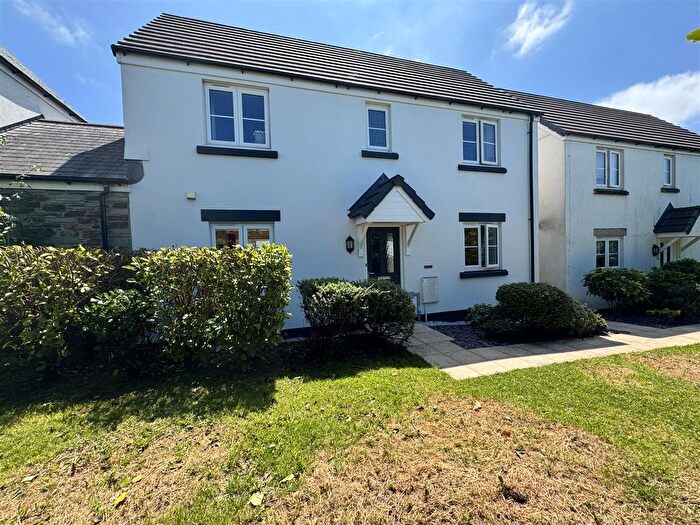
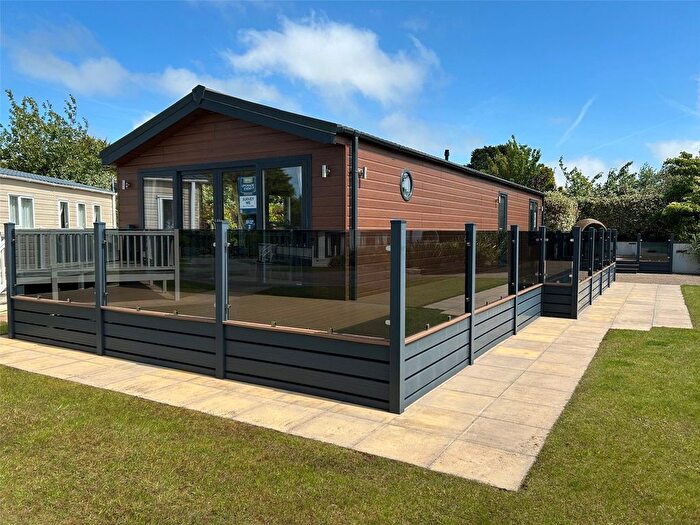
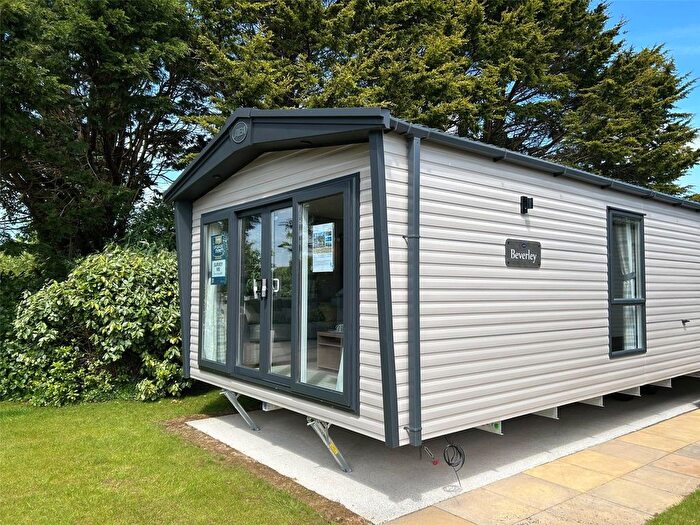
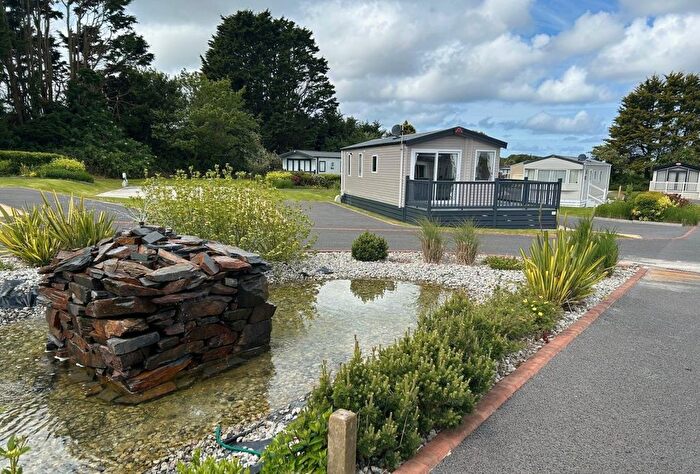
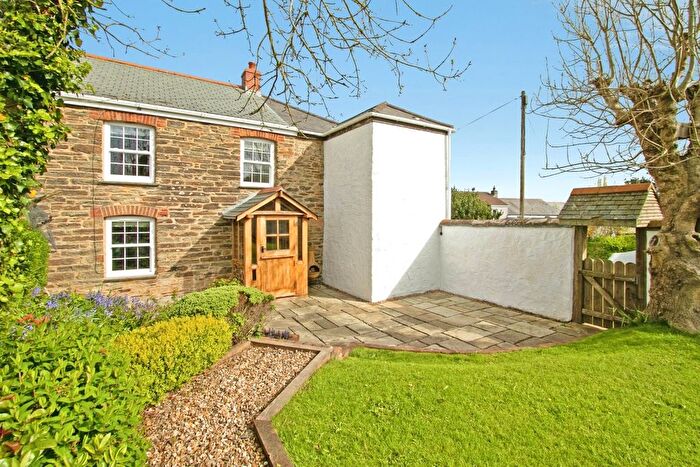
Previously listed properties in Perranporth
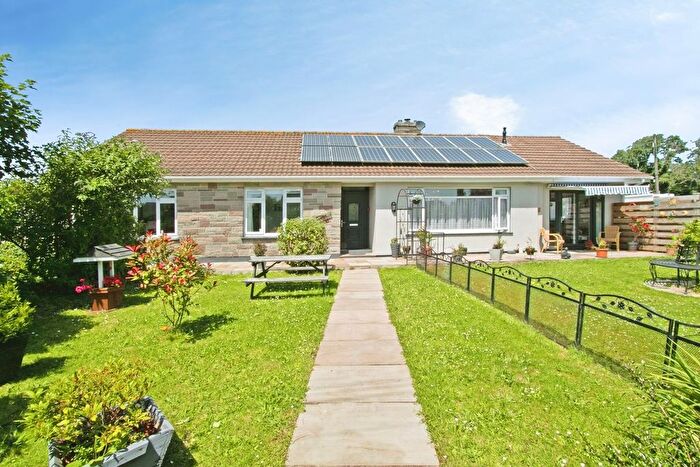
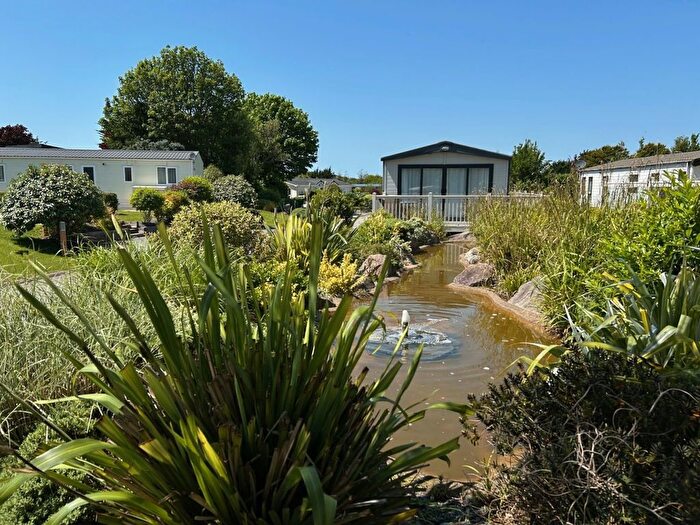
![]()
If you are looking to sell your house, let it out, or receive a property valuation, an expert can help you.
Click the button below to get started.
Roads and Postcodes in Perranporth
Navigate through our locations to find the location of your next house in Perranporth, Newquay for sale or to rent.
| Streets | Postcodes |
|---|---|
| Hendra Croft | TR8 5QJ TR8 5QH TR8 5QL TR8 5QW |
| Holywell Bay | TR8 5PF TR8 5FN |
| TR8 5PZ TR8 5QF TR8 5QG TR8 5QQ |
Property price trends in Perranporth
According to the latest Land Registry data, the average home in Perranporth sold for £635,000 in 2024. That figure comes from 17 sales logged over the past 29 years.
Prices have fallen back over the last three years. Compared with 2020, when the typical sale came in around £1,050,000, that's a fall of roughly 39.5%.
Looking back five years, average prices are up about 104.8% since 2018, a gain of around £325,000 in cash terms.
Zoom out to the past decade for the fuller picture. Back in 2012, homes here averaged £415,000, so the typical sold price has climbed about 53% since then, roughly 3.6% a year. Stretch the view to fifteen years and that annual pace edges up closer to 4.6%.
Frequently asked questions about Perranporth
What is the average price for a property for sale in Perranporth?
The average price for a property for sale in Perranporth is £635,000. This amount is 73% higher than the average price in Newquay. There are 612 property listings for sale in Perranporth.
Which train stations are available in or near Perranporth?
Some of the train stations available in or near Perranporth are Newquay, Quintrell Downs and Truro.
Property Price Paid in Perranporth by Year
The average sold property price by year was:
| Year | Average Sold Price | Price Change |
Sold Properties
|
|---|---|---|---|
| 2024 | £635,000 | -120% |
2 Properties |
| 2022 | £1,400,000 | 25% |
1 Property |
| 2020 | £1,050,000 | 70% |
1 Property |
| 2018 | £310,000 | -44% |
1 Property |
| 2016 | £445,000 | 7% |
2 Properties |
| 2012 | £415,000 | 22% |
2 Properties |
| 2009 | £322,000 | 4% |
1 Property |
| 2005 | £310,000 | 55% |
1 Property |
| 2002 | £140,000 | -64% |
2 Properties |
| 2000 | £230,000 | 44% |
1 Property |
Property Price per Property Type in Perranporth
Here you can find historic sold price data in order to help with your property search.
The average Property Paid Price for specific property types in the last three years are:
| Property Type | Average Sold Price | Sold Properties |
|---|---|---|
| Detached House | £635,000.00 | 2 Detached Houses |
