
Houses for sale & to rent in Newquay, Cornwall
House Prices in Newquay
Properties in Newquay have an average house price of £367k and had 1,872 Property Transactions within the last 3 years.¹
Newquay is an area in Cornwall with 12,133 households², where the most expensive property was sold for £9.5M.
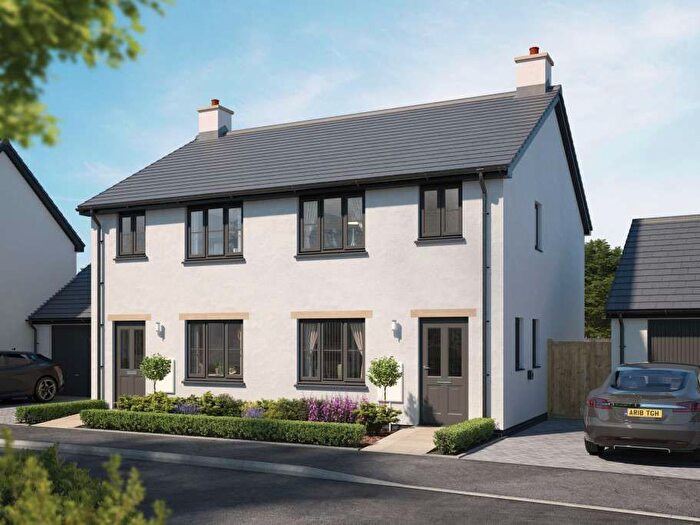
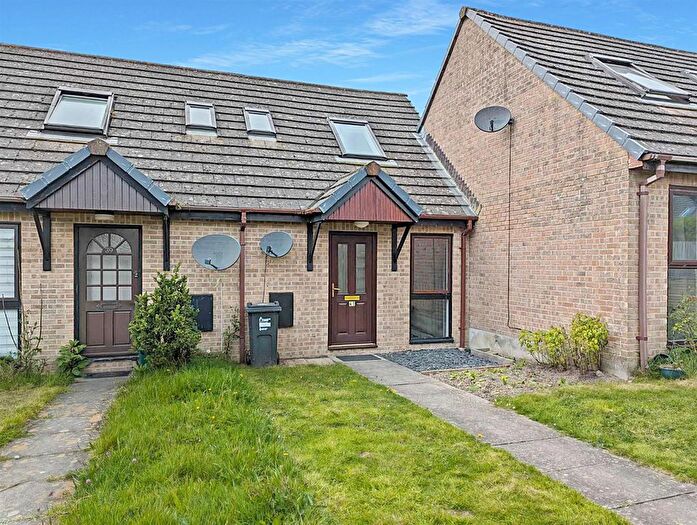
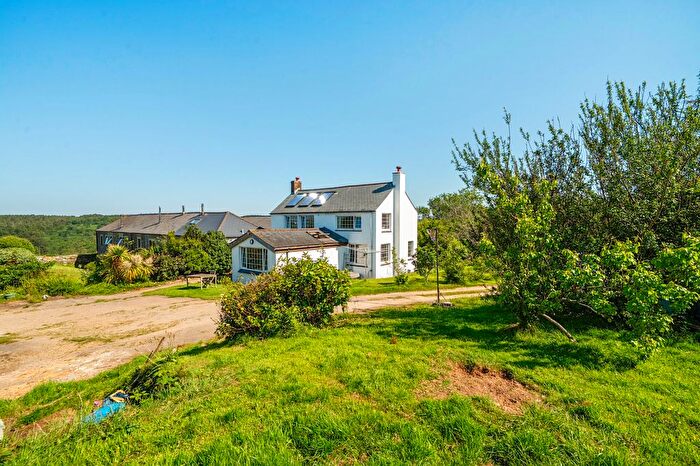
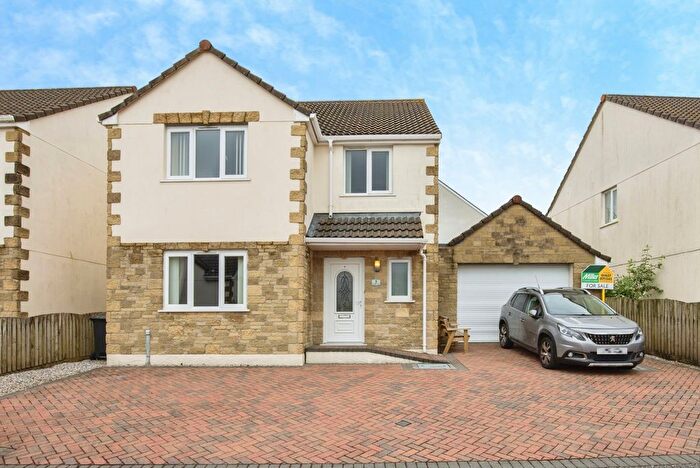
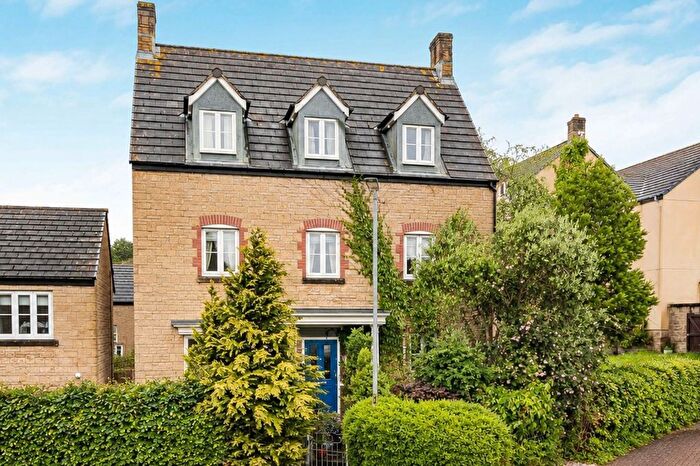
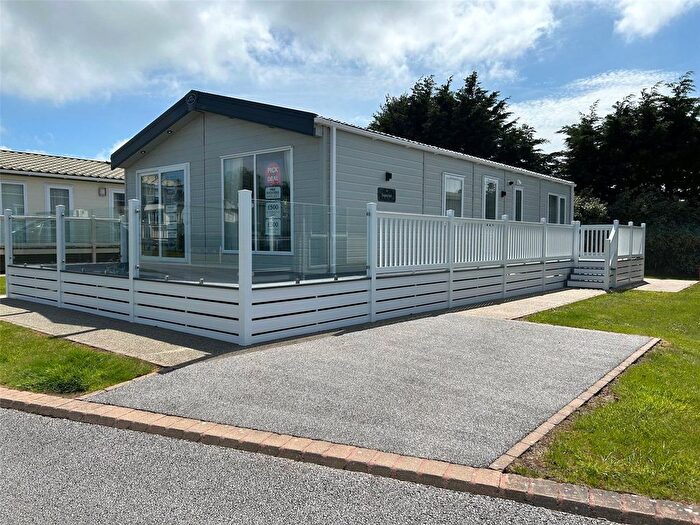
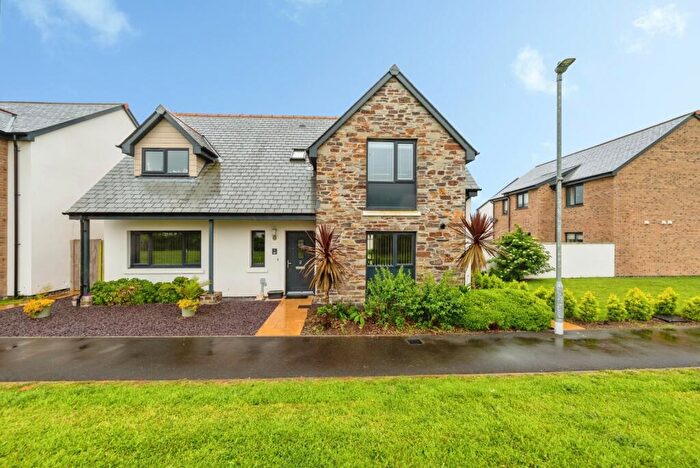
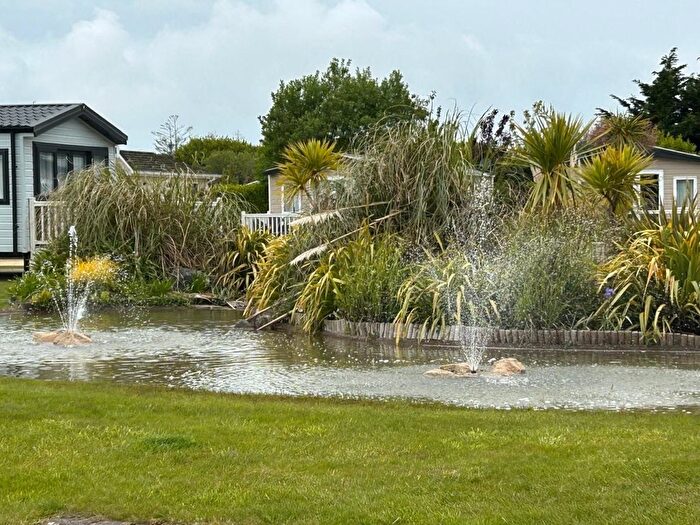
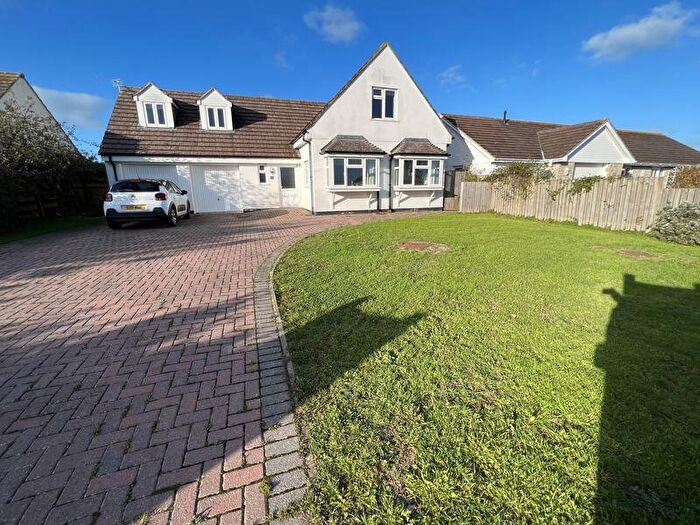
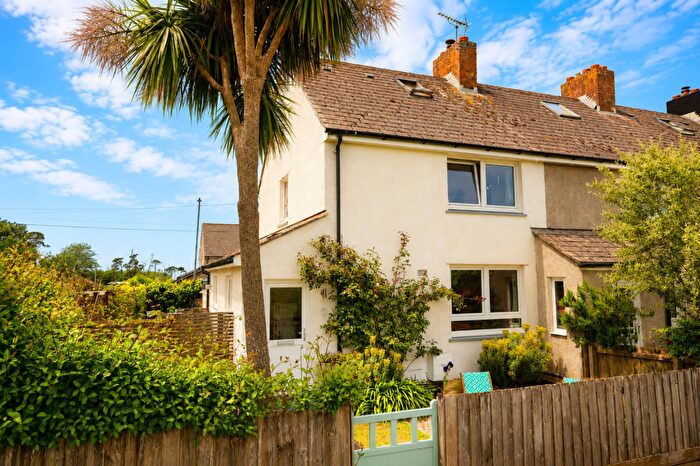
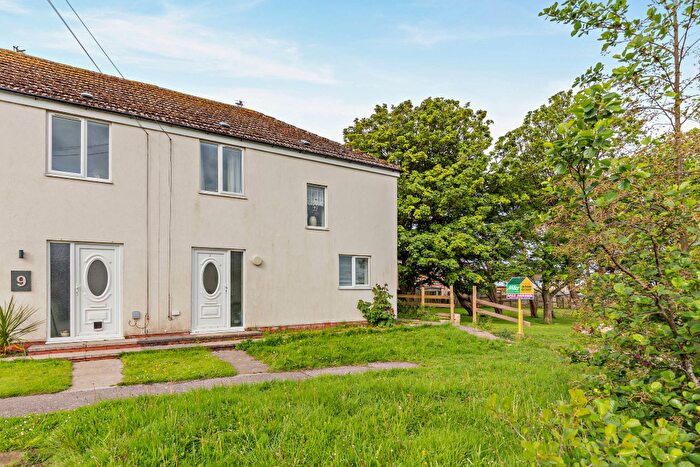
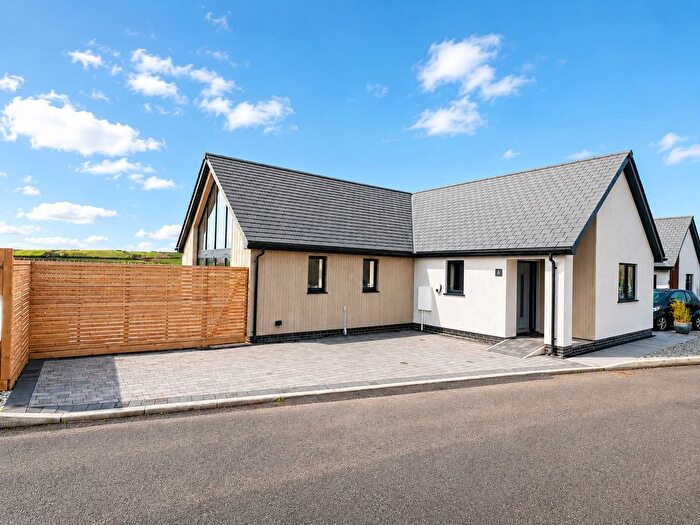
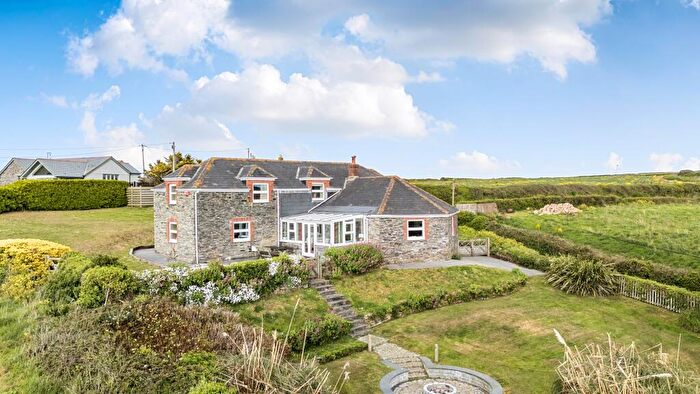
Properties for sale in Newquay
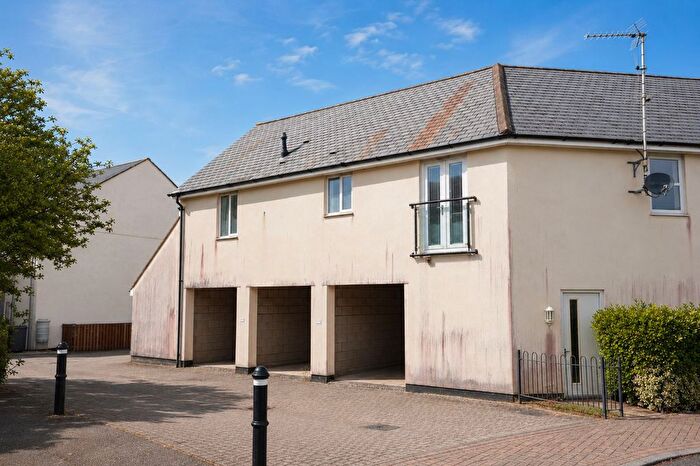
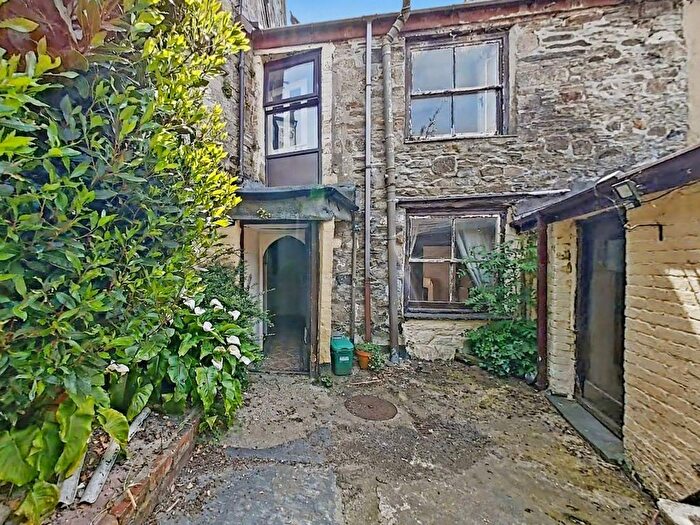
![]()
If you are looking to sell your house, let it out, or receive a property valuation, an expert can help you.
Click the button below to get started.
Neighbourhoods in Newquay
Navigate through our locations to find the location of your next house in Newquay, Cornwall for sale or to rent.
- Ladock, St Clement And St Erme
- Newlyn And Goonhavern
- Newquay Central
- Newquay Pentire
- Newquay Treloggan
- Newquay Tretherras
- Newquay Treviglas
- Perranporth
- St Columb Major
- St Enoder
- St Mawgan And Colan
- Newquay Porth & Tretherras
- Newquay Central & Pentire
- Newquay Trenance
- St Columb Minor & Colan
- St Columb Major, St Mawgan & St Wenn
- St Newlyn East, Cubert & Goonhavern
Transport in Newquay
Please see below transportation links in this area:

- FAQ
- Price Paid By Year
- Property Type Price
Frequently asked questions about Newquay
What is the average price for a property for sale in Newquay?
The average price for a property for sale in Newquay is £366,530. This amount is 6% higher than the average price in Cornwall. There are 6,077 property listings for sale in Newquay.
What locations have the most expensive properties for sale in Newquay?
The locations with the most expensive properties for sale in Newquay are Perranporth at an average of £635,000, Newlyn And Goonhavern at an average of £428,133 and St Mawgan And Colan at an average of £402,813.
What locations have the most affordable properties for sale in Newquay?
The locations with the most affordable properties for sale in Newquay are St Columb Major at an average of £168,071, Newquay Treloggan at an average of £300,727 and Newquay Central at an average of £325,325.
Which train stations are available in or near Newquay?
Some of the train stations available in or near Newquay are Newquay, Quintrell Downs and St.Columb Road.
Property Price Paid in Newquay by Year
The average sold property price by year was:
| Year | Average Sold Price | Price Change |
Sold Properties
|
|---|---|---|---|
| 2026 | £395,900 | 11% |
31 Properties |
| 2025 | £353,326 | -8% |
631 Properties |
| 2024 | £382,784 | 5% |
628 Properties |
| 2023 | £361,743 | -6% |
582 Properties |
| 2022 | £382,759 | 7% |
649 Properties |
| 2021 | £355,807 | 10% |
854 Properties |
| 2020 | £319,006 | 12% |
790 Properties |
| 2019 | £281,832 | 4% |
832 Properties |
| 2018 | £269,718 | 5% |
934 Properties |
| 2017 | £256,420 | 4% |
835 Properties |
| 2016 | £246,234 | 4% |
915 Properties |
| 2015 | £235,231 | 4% |
781 Properties |
| 2014 | £225,389 | 7% |
808 Properties |
| 2013 | £208,586 | -2% |
613 Properties |
| 2012 | £212,656 | -3% |
507 Properties |
| 2011 | £218,735 | -7% |
502 Properties |
| 2010 | £235,039 | 8% |
450 Properties |
| 2009 | £215,965 | -3% |
432 Properties |
| 2008 | £222,146 | -9% |
408 Properties |
| 2007 | £241,273 | 11% |
775 Properties |
| 2006 | £213,724 | 2% |
783 Properties |
| 2005 | £209,394 | 8% |
622 Properties |
| 2004 | £193,273 | 17% |
831 Properties |
| 2003 | £159,502 | 16% |
792 Properties |
| 2002 | £133,286 | 20% |
802 Properties |
| 2001 | £106,570 | 19% |
763 Properties |
| 2000 | £86,775 | 7% |
759 Properties |
| 1999 | £80,353 | 13% |
799 Properties |
| 1998 | £69,993 | 9% |
645 Properties |
| 1997 | £63,360 | 4% |
641 Properties |
| 1996 | £60,702 | 9% |
649 Properties |
| 1995 | £54,991 | - |
443 Properties |
Property Price per Property Type in Newquay
Here you can find historic sold price data in order to help with your property search.
The average Property Paid Price for specific property types in the last three years are:
| Property Type | Average Sold Price | Sold Properties |
|---|---|---|
| Semi Detached House | £333,298.00 | 402 Semi Detached Houses |
| Terraced House | £303,355.00 | 492 Terraced Houses |
| Detached House | £563,045.00 | 504 Detached Houses |
| Flat | £251,337.00 | 474 Flats |