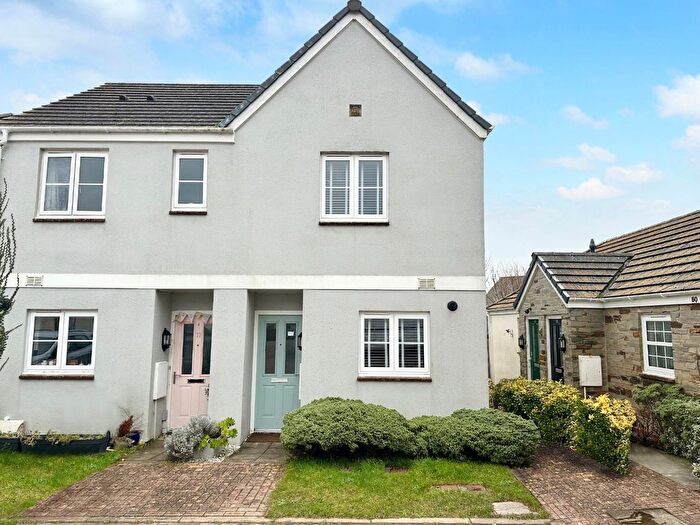
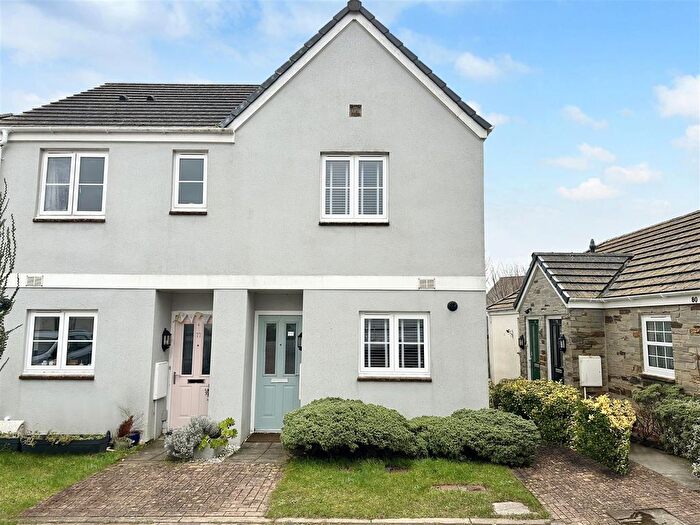
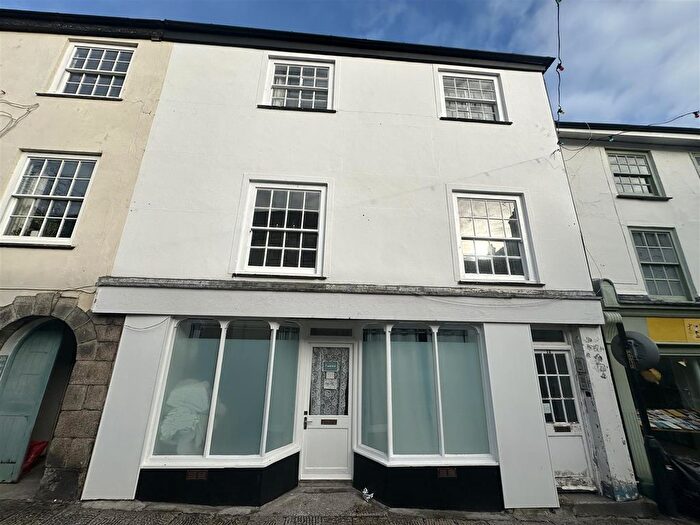
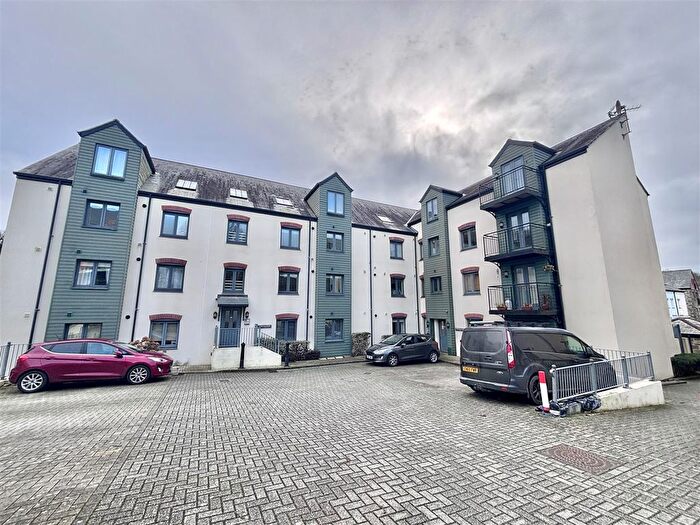
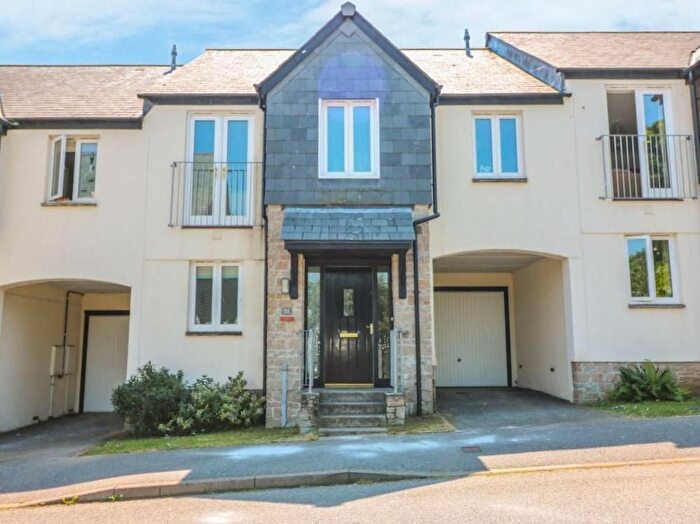
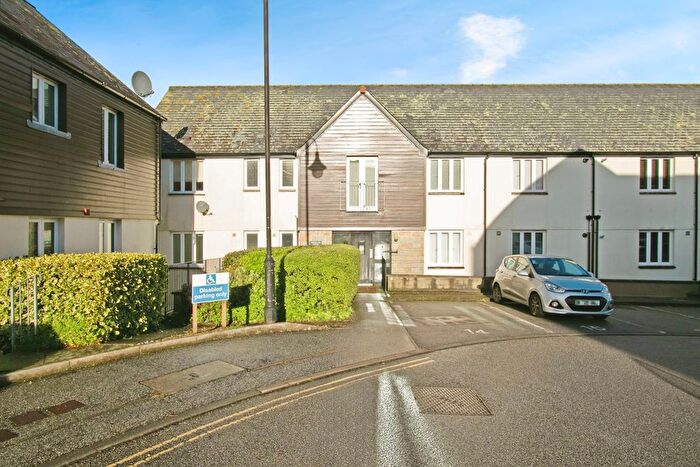
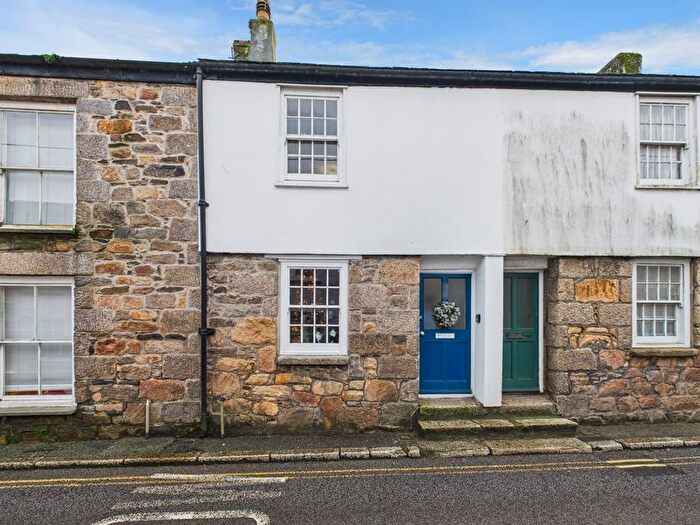
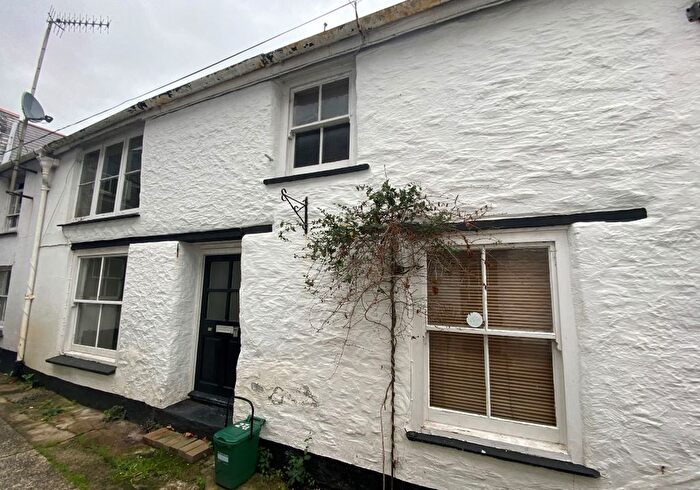
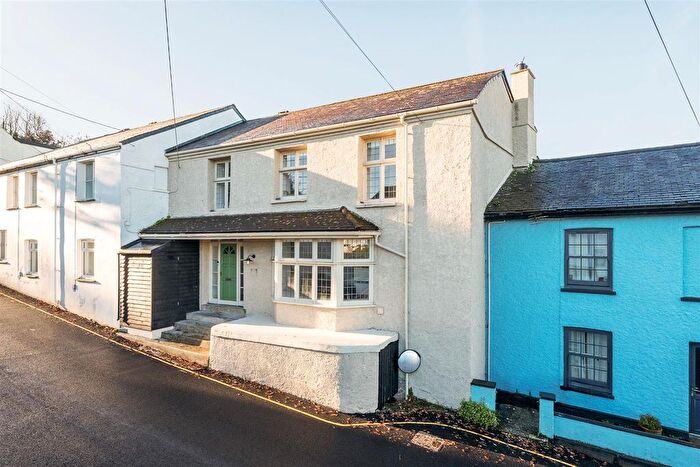
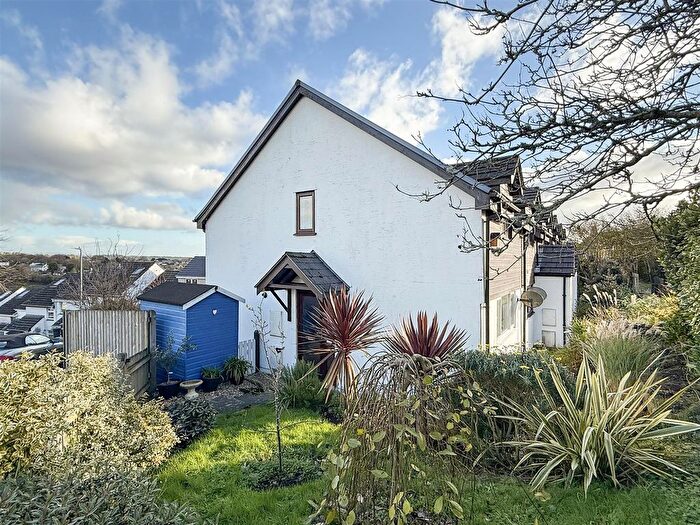
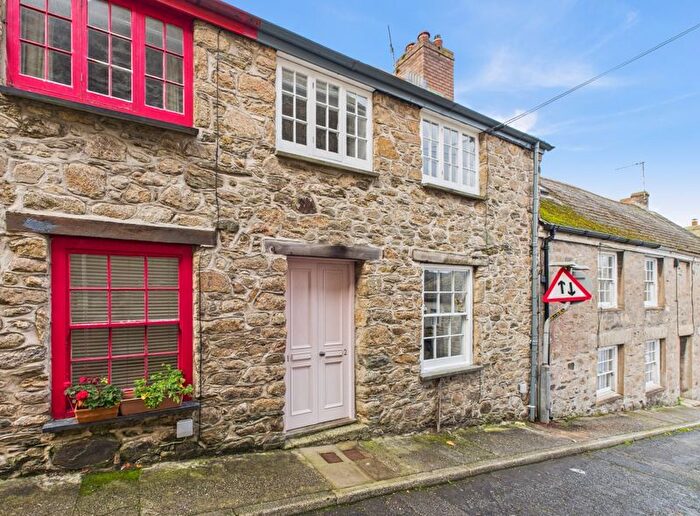
Houses for sale & to rent in Penryn East And Mylor, Penryn
House Prices in Penryn East And Mylor
Properties in Penryn East And Mylor have an average house price of £316,238.00 and had 134 Property Transactions within the last 3 years¹.
Penryn East And Mylor is an area in Penryn, Cornwall with 1,177 households², where the most expensive property was sold for £1,750,000.00.
Properties for sale in Penryn East And Mylor
Previously listed properties in Penryn East And Mylor
Roads and Postcodes in Penryn East And Mylor
Navigate through our locations to find the location of your next house in Penryn East And Mylor, Penryn for sale or to rent.
| Streets | Postcodes |
|---|---|
| Anchor Quay | TR10 8GX TR10 8GY TR10 8GZ |
| Anchor Terrace | TR10 8GW |
| Belhay | TR10 8DF |
| Bella Vista Gardens | TR10 8AN |
| Bennett Cottages | TR10 8BN |
| Bohelland Rise | TR10 8DS TR10 8DT |
| Bohelland Road | TR10 8DX TR10 8DY |
| Bohelland Villas | TR10 8BX |
| Bohelland Way | TR10 8DZ |
| Bohill | TR10 8JF TR10 8JG |
| Broad Street | TR10 8JH TR10 8JL |
| Broads Lane | TR10 9LD |
| Bronescombe Close | TR10 8LE |
| Brook Place | TR10 8LJ |
| Carn Rock | TR10 8LQ |
| Challacombe Gardens | TR10 8EJ |
| Chandler Park | TR10 9FL |
| Charter Close | TR10 8LZ |
| Church Hill | TR10 8AJ |
| Church Road | TR10 8BZ TR10 8DA TR10 8BA TR10 8BY |
| College Green | TR10 8FL |
| College Hill | TR10 8FE TR10 8LG TR10 8LH TR10 8LX |
| Commercial Road | TR10 8AE TR10 8AG TR10 8AR TR10 8AF TR10 8AH TR10 8AL TR10 8AQ TR10 8FG TR10 8SB |
| Durgan Lane | TR10 8DD TR10 8DG |
| Eastwood Road | TR10 8JZ TR10 8LA |
| Enys | TR10 9LB |
| Enys Hill | TR10 9BA |
| Erow Glas | TR10 8AY |
| Falmouth Road | TR10 8AB TR10 8AD TR10 8BD TR10 8BE |
| Fox Stanton Drive | TR10 8GB |
| Foxs Yard | TR10 8GF |
| Glasney Place | TR10 8LL TR10 8LN |
| Glasney Terrace | TR10 8LD |
| Grays Yard | TR10 8GJ |
| Harbour Village | TR10 8GE TR10 8GG TR10 8GH |
| Helland Gardens | TR10 8LY |
| Hillhead | TR10 8JT TR10 8JU TR10 8JX TR10 8JY |
| Hillside Meadow | TR10 8LB |
| Islington Wharf | TR10 8AT |
| Jacks Close | TR10 8GA |
| Lower Market Street | TR10 8BG TR10 8BH TR10 8BQ |
| New Street | TR10 8EB |
| Old Quay Ope | TR10 8FA |
| Old Well Gardens | TR10 9LF |
| Parc Briwer | TR10 8LF |
| Permarin Road | TR10 8BU |
| Praze Meadow | TR10 8DE |
| Quay Hill | TR10 8GU TR10 8JE |
| Round Ring | TR10 9LA |
| Round Ring Gardens | TR10 9BQ TR10 9DE |
| Russells Way | TR10 8RZ |
| South Harbour | TR10 8LR TR10 8SH |
| South View | TR10 8EA |
| St Gluvias Parc | TR10 8HZ |
| St Gluvias Street | TR10 8BJ TR10 8BL |
| St Thomas Street | TR10 8JP TR10 8JW |
| The Praze | TR10 8DQ |
| The Quay | TR10 8LS |
| The Retreat | TR10 8JJ |
| The Square | TR10 8JQ |
| Truro Hill | TR10 8DB TR10 8GD |
| Truro Lane | TR10 8BT TR10 8BW |
| Vinery Meadow | TR10 8FJ |
| Waterside Court | TR10 8AW |
| TR10 9LH TR10 9LQ TR10 9FP TR10 9LJ |
Transport near Penryn East And Mylor
- FAQ
- Price Paid By Year
- Property Type Price
Frequently asked questions about Penryn East And Mylor
What is the average price for a property for sale in Penryn East And Mylor?
The average price for a property for sale in Penryn East And Mylor is £316,238. This amount is 2% higher than the average price in Penryn. There are 819 property listings for sale in Penryn East And Mylor.
What streets have the most expensive properties for sale in Penryn East And Mylor?
The streets with the most expensive properties for sale in Penryn East And Mylor are Enys Hill at an average of £1,750,000, Enys at an average of £805,000 and Erow Glas at an average of £600,000.
What streets have the most affordable properties for sale in Penryn East And Mylor?
The streets with the most affordable properties for sale in Penryn East And Mylor are Brook Place at an average of £172,000, Anchor Terrace at an average of £187,475 and The Retreat at an average of £192,750.
Which train stations are available in or near Penryn East And Mylor?
Some of the train stations available in or near Penryn East And Mylor are Penryn, Penmere and Falmouth Town.
Property Price Paid in Penryn East And Mylor by Year
The average sold property price by year was:
| Year | Average Sold Price | Price Change |
Sold Properties
|
|---|---|---|---|
| 2025 | £305,736 | -9% |
38 Properties |
| 2024 | £333,120 | 9% |
53 Properties |
| 2023 | £304,712 | 5% |
43 Properties |
| 2022 | £289,023 | 2% |
60 Properties |
| 2021 | £283,946 | 17% |
73 Properties |
| 2020 | £234,379 | -14% |
49 Properties |
| 2019 | £267,214 | 11% |
67 Properties |
| 2018 | £239,022 | -12% |
98 Properties |
| 2017 | £267,920 | 20% |
68 Properties |
| 2016 | £214,407 | 2% |
90 Properties |
| 2015 | £210,969 | 12% |
82 Properties |
| 2014 | £186,313 | -2% |
66 Properties |
| 2013 | £189,909 | 3% |
47 Properties |
| 2012 | £184,673 | -1% |
64 Properties |
| 2011 | £187,168 | -12% |
80 Properties |
| 2010 | £209,954 | 21% |
54 Properties |
| 2009 | £166,023 | -10% |
36 Properties |
| 2008 | £182,748 | 8% |
39 Properties |
| 2007 | £168,777 | - |
97 Properties |
| 2006 | £168,779 | -9% |
67 Properties |
| 2005 | £184,626 | 6% |
74 Properties |
| 2004 | £174,046 | 14% |
50 Properties |
| 2003 | £150,381 | 20% |
56 Properties |
| 2002 | £120,687 | 22% |
72 Properties |
| 2001 | £94,676 | 8% |
71 Properties |
| 2000 | £86,706 | 17% |
41 Properties |
| 1999 | £71,884 | 21% |
101 Properties |
| 1998 | £56,471 | 1% |
54 Properties |
| 1997 | £56,149 | 3% |
52 Properties |
| 1996 | £54,287 | 12% |
45 Properties |
| 1995 | £47,594 | - |
36 Properties |
Property Price per Property Type in Penryn East And Mylor
Here you can find historic sold price data in order to help with your property search.
The average Property Paid Price for specific property types in the last three years are:
| Property Type | Average Sold Price | Sold Properties |
|---|---|---|
| Semi Detached House | £276,276.00 | 21 Semi Detached Houses |
| Detached House | £552,543.00 | 30 Detached Houses |
| Terraced House | £277,465.00 | 45 Terraced Houses |
| Flat | £197,683.00 | 38 Flats |

