Houses for sale & to rent in Penryn East And Mylor, Falmouth
House Prices in Penryn East And Mylor
Properties in Penryn East And Mylor have an average house price of £609,778.00 and had 135 Property Transactions within the last 3 years¹.
Penryn East And Mylor is an area in Falmouth, Cornwall with 1,119 households², where the most expensive property was sold for £3,900,000.00.
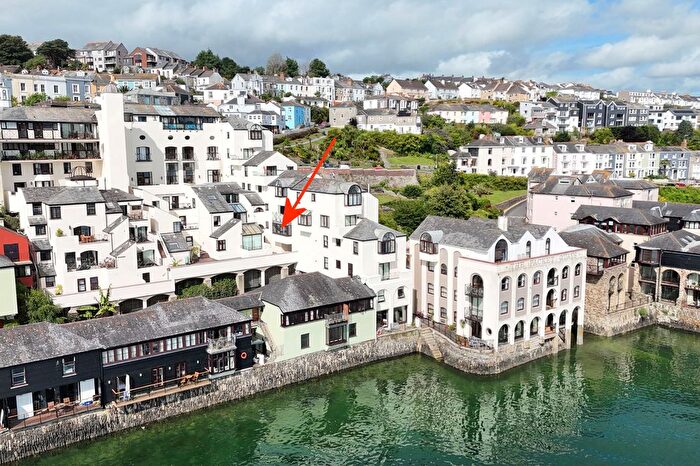
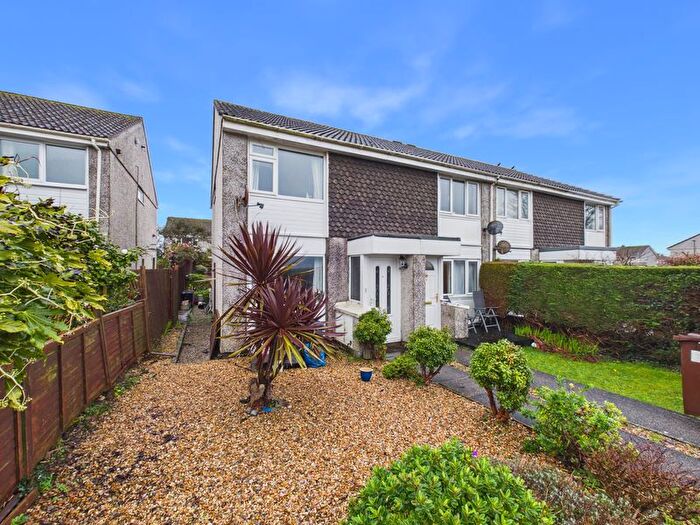
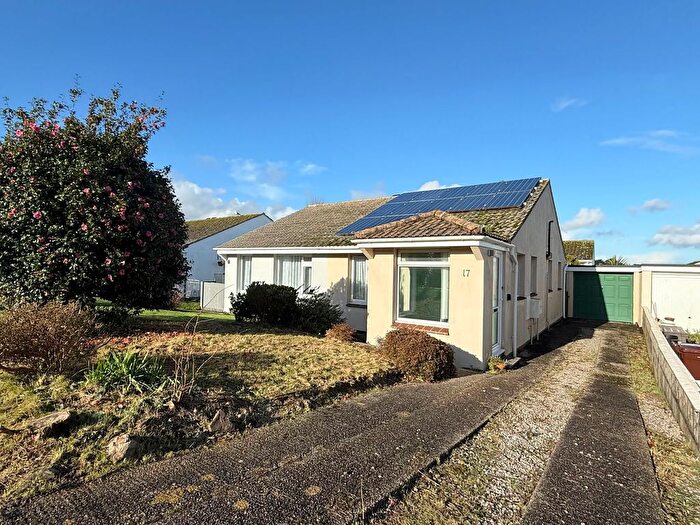
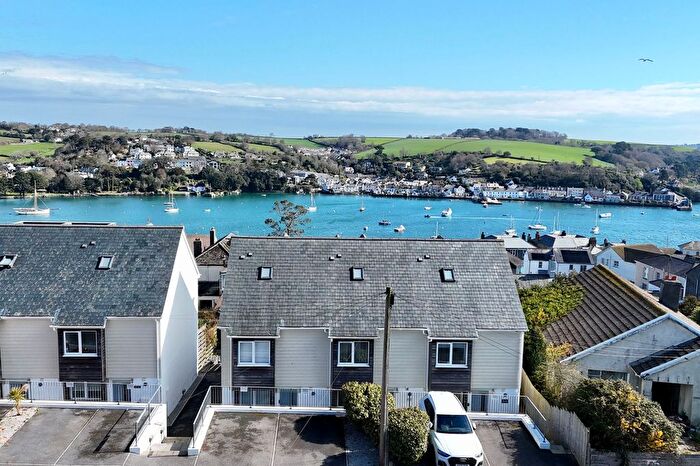
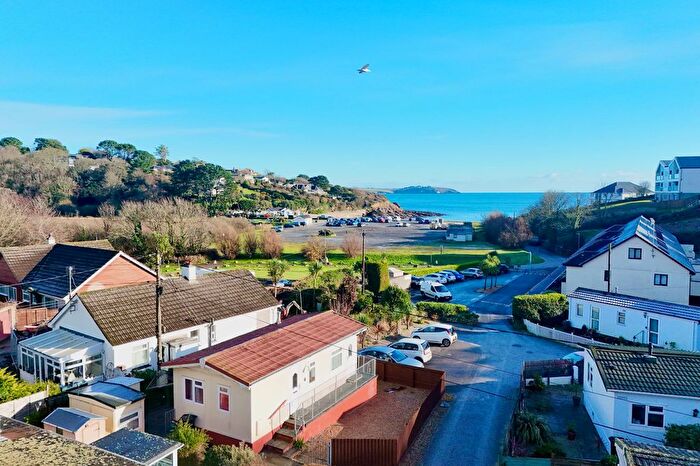
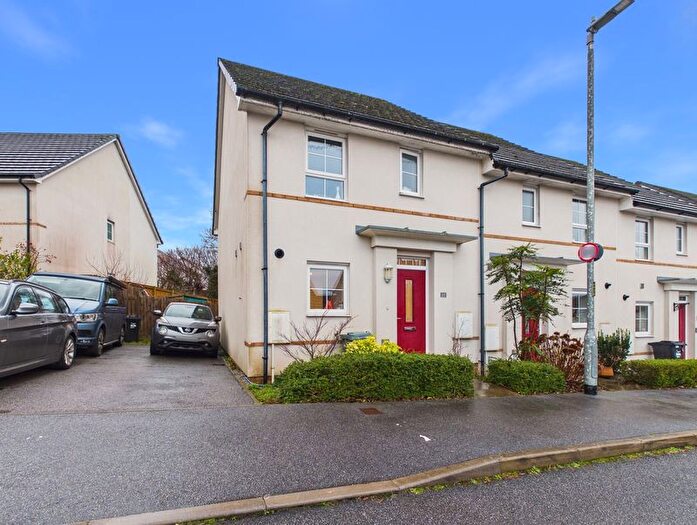
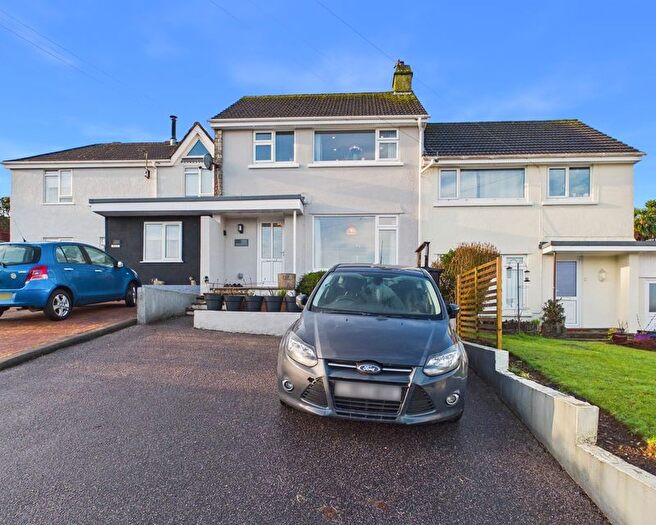
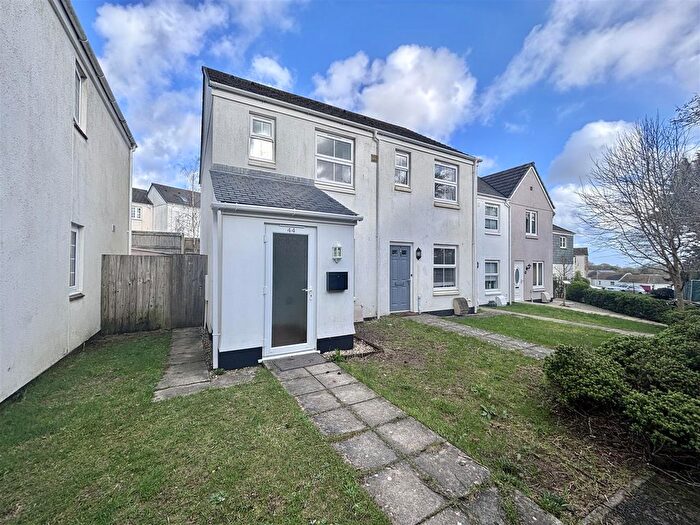
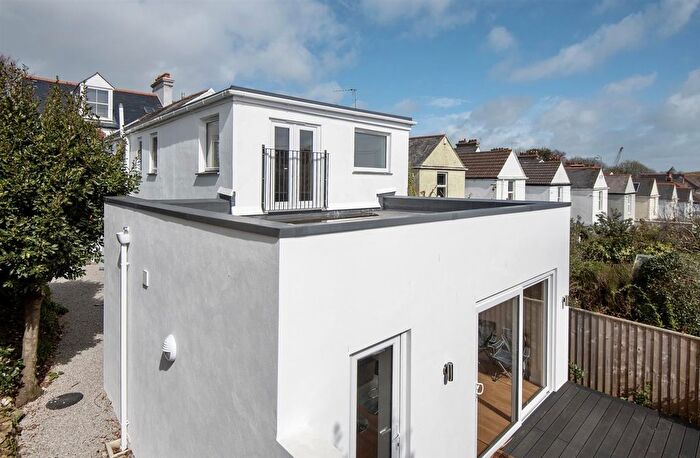
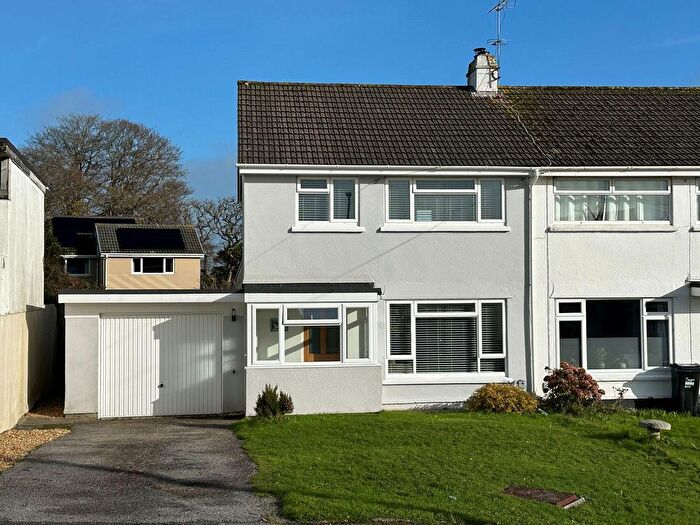
Properties for sale in Penryn East And Mylor
Roads and Postcodes in Penryn East And Mylor
Navigate through our locations to find the location of your next house in Penryn East And Mylor, Falmouth for sale or to rent.
| Streets | Postcodes |
|---|---|
| Angarrick | TR11 5NU TR11 5NX |
| Arnhem Villas | TR11 5TW |
| Avallen Close | TR11 5SX |
| Bells Hill | TR11 5SH TR11 5SQ |
| Bonython Close | TR11 5NF |
| Broads Lane | TR11 5SD |
| Carclew Road | TR11 5UN |
| Church Lane | TR11 5UH |
| Church Road | TR11 5NL |
| Cogos Avenue | TR11 5FY |
| Cogos Park | TR11 5SF |
| Comfort Road | TR11 5SE |
| Coventry Road | TR11 5TX |
| Edmonton Close | TR11 5UT |
| Eglos Meadow | TR11 5SY |
| Ganges Close | TR11 5UG |
| Greatwood | TR11 5SR |
| Kersey Close | TR11 5TS |
| Kersey Road | TR11 5TR |
| Lemon Hill | TR11 5NA TR11 5NT TR11 5ND |
| Lemon Hill Gardens | TR11 5NR |
| Little Falmouth | TR11 5TJ |
| Meadowbank | TR11 5SW |
| Mylor Bridge | TR11 5LU TR11 5LX TR11 5LY |
| Mylor Gardens | TR11 5FZ |
| New Row | TR11 5NB |
| Olivey Place | TR11 5RX |
| Orchard Vale | TR11 5TT |
| Parc Peneglos | TR11 5SL |
| Passage Hill | TR11 5SA TR11 5SN |
| Penarrow Road | TR11 5UD TR11 5UF |
| Penmorvah | TR11 5NP |
| Penoweth | TR11 5NQ |
| Pillars Road | TR11 5NJ |
| Pitick Terrace | TR11 5UA |
| Poplar Terrace | TR11 5TL |
| Restronguet | TR11 5ST |
| Restronguet Weir | TR11 5SS |
| River View | TR11 5TN |
| Robert Rundle Way | TR11 5US |
| Rose Hill | TR11 5LZ |
| Salt Box Close | TR11 5NN |
| Salt Box Road | TR11 5NW |
| Springfield Park | TR11 5SJ |
| St Johns Gardens | TR11 5TU |
| St Peters Hill | TR11 5TP |
| St Peters Road | TR11 5UP |
| The Close | TR11 5SZ |
| Trefusis Road | TR11 5TY TR11 5TZ TR11 5UB |
| Tregatreath | TR11 5NS |
| Tregew Close | TR11 5TQ |
| Tregew Meadow | TR11 5FN |
| Tregew Road | TR11 5TF TR11 5TG TR11 5TH TR11 5SB |
| Trevellan Road | TR11 5NE |
| Trevissome | TR11 5TA |
| Waterings Road | TR11 5NG TR11 5NH |
| Wayfield Road | TR11 5UE |
| Willow Close | TR11 5SG |
| TR11 5SU TR11 5TB TR11 5UL TR11 5UW TR11 2SE TR11 5SP TR11 5TD TR11 5TE TR11 5UQ |
Transport near Penryn East And Mylor
- FAQ
- Price Paid By Year
- Property Type Price
Frequently asked questions about Penryn East And Mylor
What is the average price for a property for sale in Penryn East And Mylor?
The average price for a property for sale in Penryn East And Mylor is £609,778. This amount is 38% higher than the average price in Falmouth. There are 2,817 property listings for sale in Penryn East And Mylor.
What streets have the most expensive properties for sale in Penryn East And Mylor?
The streets with the most expensive properties for sale in Penryn East And Mylor are Penarrow Road at an average of £1,870,000, Trefusis Road at an average of £1,136,045 and Broads Lane at an average of £1,064,000.
What streets have the most affordable properties for sale in Penryn East And Mylor?
The streets with the most affordable properties for sale in Penryn East And Mylor are Trevissome at an average of £98,750, Cogos Avenue at an average of £140,000 and Orchard Vale at an average of £267,000.
Which train stations are available in or near Penryn East And Mylor?
Some of the train stations available in or near Penryn East And Mylor are Penryn, Penmere and Falmouth Docks.
Property Price Paid in Penryn East And Mylor by Year
The average sold property price by year was:
| Year | Average Sold Price | Price Change |
Sold Properties
|
|---|---|---|---|
| 2025 | £554,474 | -2% |
29 Properties |
| 2024 | £563,561 | -26% |
62 Properties |
| 2023 | £711,352 | 9% |
44 Properties |
| 2022 | £649,395 | 18% |
44 Properties |
| 2021 | £534,521 | -8% |
64 Properties |
| 2020 | £577,638 | 6% |
59 Properties |
| 2019 | £544,710 | 0,3% |
51 Properties |
| 2018 | £543,255 | -7% |
54 Properties |
| 2017 | £583,666 | 27% |
53 Properties |
| 2016 | £427,020 | 14% |
48 Properties |
| 2015 | £367,731 | -18% |
66 Properties |
| 2014 | £434,466 | 17% |
63 Properties |
| 2013 | £362,507 | 10% |
46 Properties |
| 2012 | £327,250 | 2% |
48 Properties |
| 2011 | £319,620 | -26% |
54 Properties |
| 2010 | £403,932 | -1% |
45 Properties |
| 2009 | £406,732 | -8% |
49 Properties |
| 2008 | £437,604 | 11% |
33 Properties |
| 2007 | £390,169 | 10% |
45 Properties |
| 2006 | £352,558 | 0,3% |
51 Properties |
| 2005 | £351,666 | -1% |
42 Properties |
| 2004 | £356,686 | 16% |
50 Properties |
| 2003 | £299,450 | 11% |
55 Properties |
| 2002 | £265,430 | 35% |
61 Properties |
| 2001 | £171,296 | 13% |
60 Properties |
| 2000 | £148,431 | 10% |
83 Properties |
| 1999 | £132,871 | 4% |
59 Properties |
| 1998 | £127,177 | 15% |
55 Properties |
| 1997 | £107,974 | 7% |
93 Properties |
| 1996 | £99,971 | 12% |
85 Properties |
| 1995 | £88,348 | - |
49 Properties |
Property Price per Property Type in Penryn East And Mylor
Here you can find historic sold price data in order to help with your property search.
The average Property Paid Price for specific property types in the last three years are:
| Property Type | Average Sold Price | Sold Properties |
|---|---|---|
| Semi Detached House | £349,176.00 | 17 Semi Detached Houses |
| Detached House | £792,891.00 | 73 Detached Houses |
| Terraced House | £415,300.00 | 35 Terraced Houses |
| Flat | £396,750.00 | 10 Flats |

