Houses for sale & to rent in Redruth South, Redruth
House Prices in Redruth South
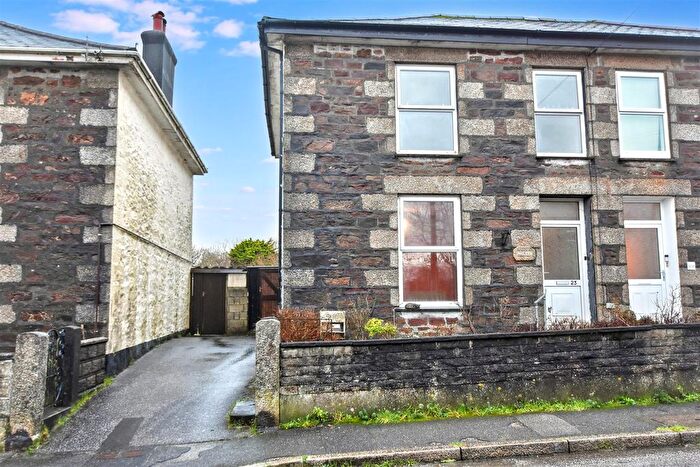
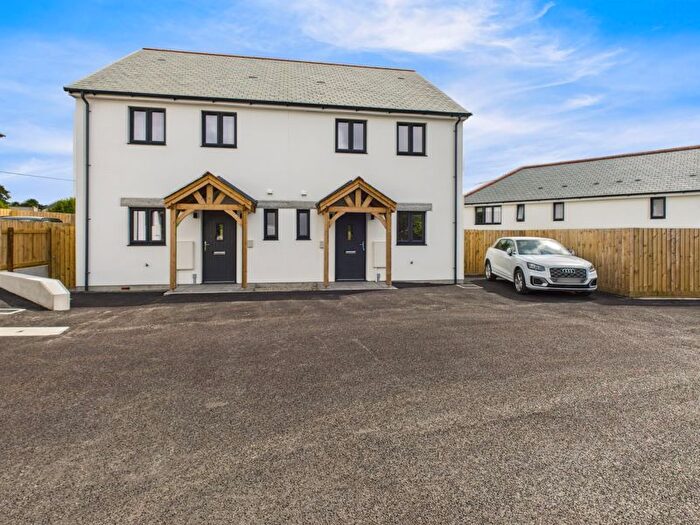
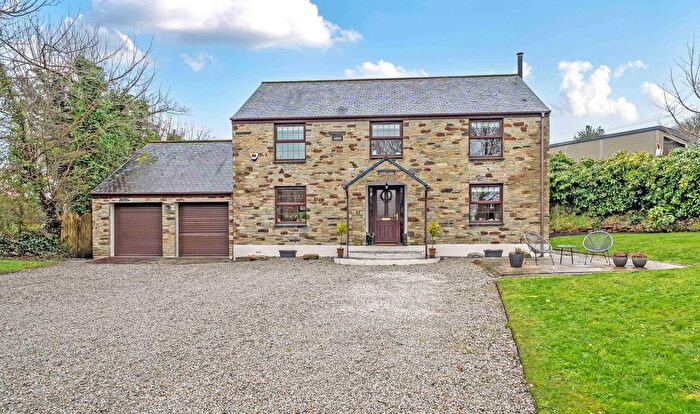
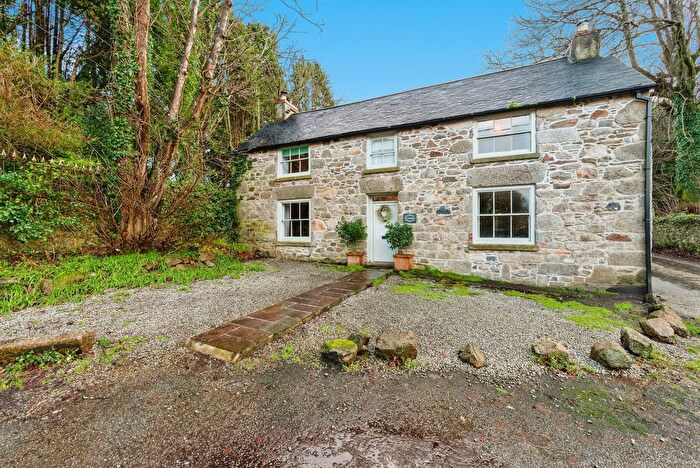
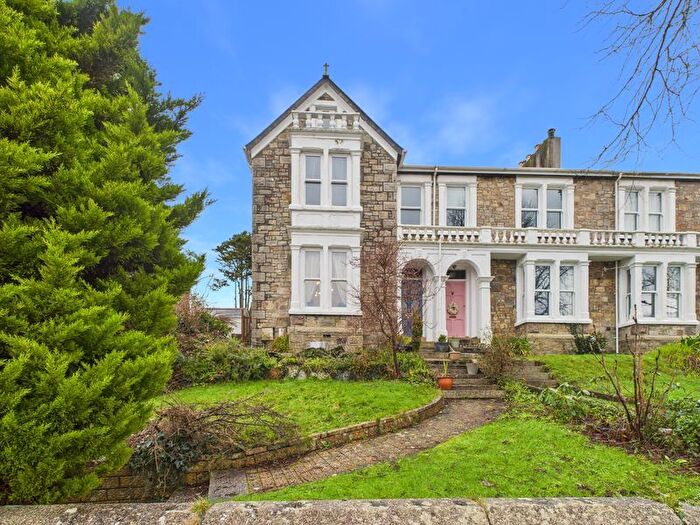
Properties in Redruth South have an average house price of £274,602.00 and had 196 Property Transactions within the last 3 years¹.
Redruth South is an area in Redruth, Cornwall with 1,703 households², where the most expensive property was sold for £775,000.00.
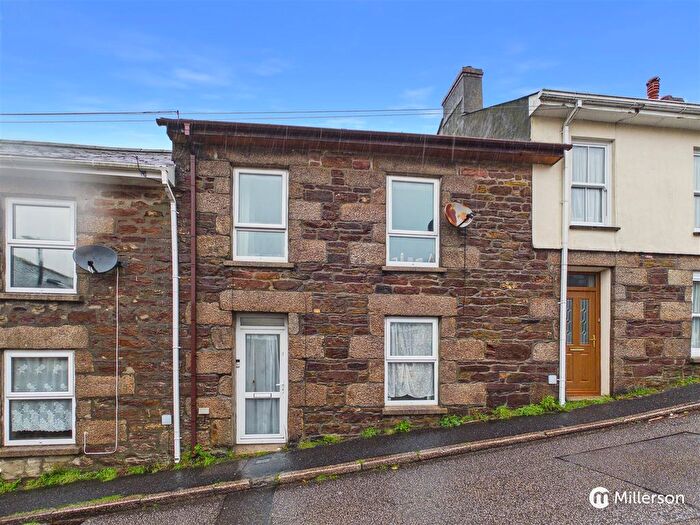
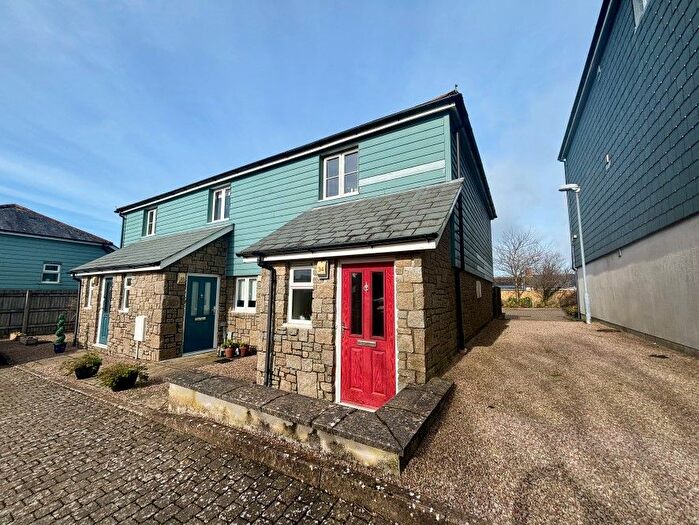
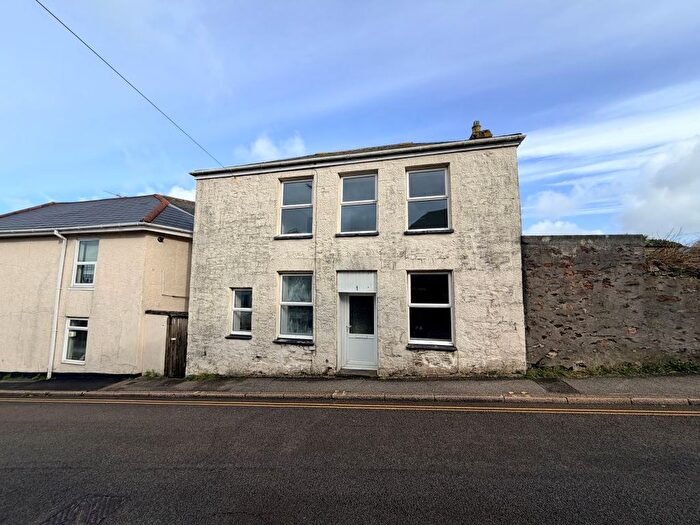
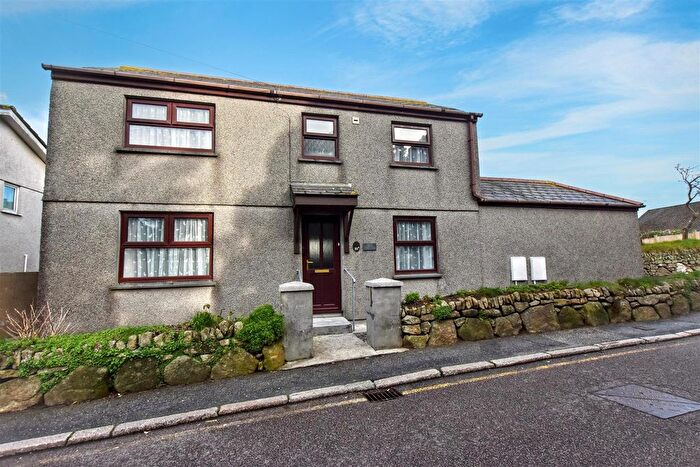
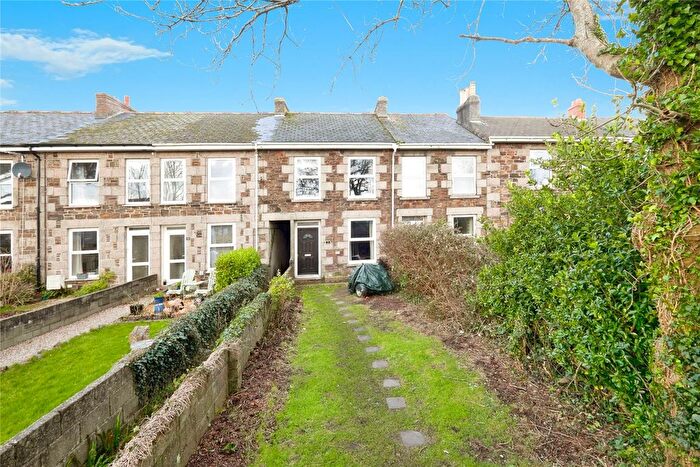
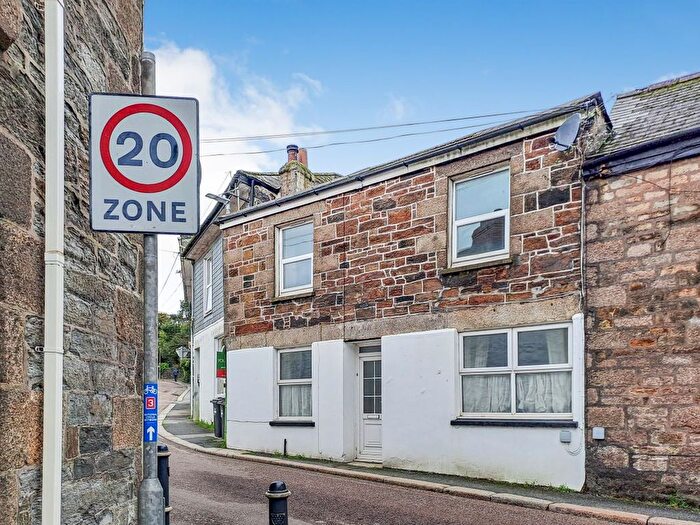
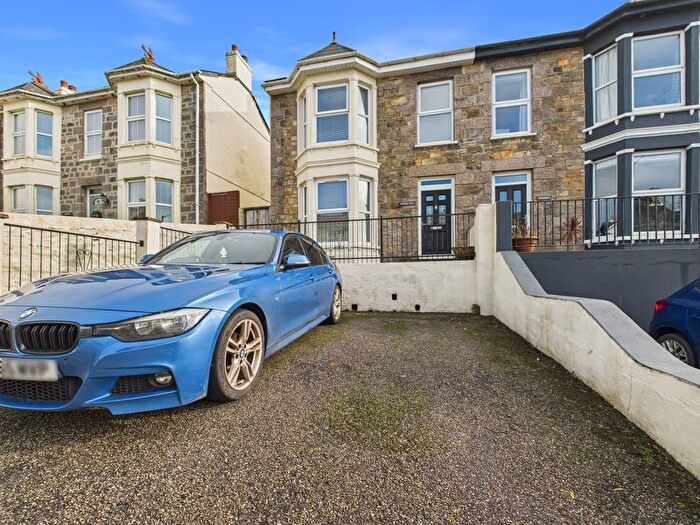
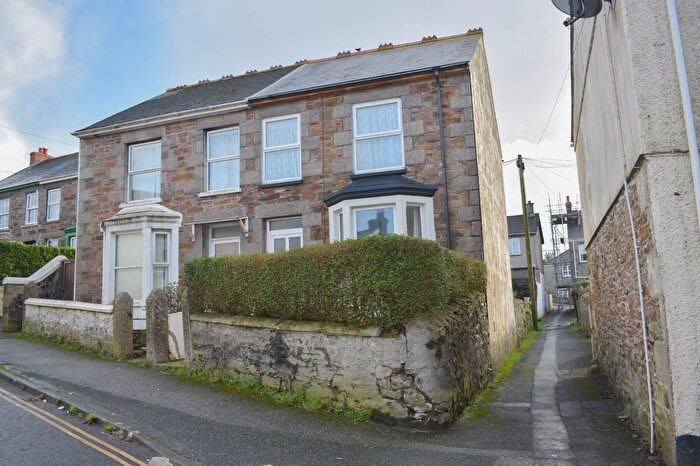
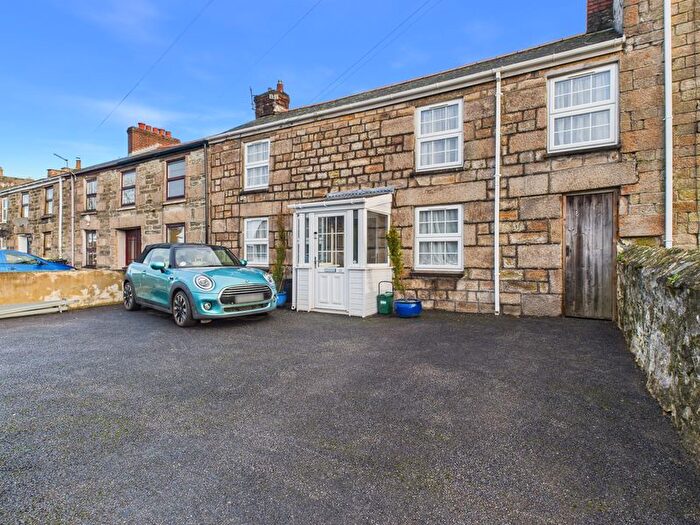
Properties for sale in Redruth South
Previously listed properties in Redruth South
Roads and Postcodes in Redruth South
Navigate through our locations to find the location of your next house in Redruth South, Redruth for sale or to rent.
| Streets | Postcodes |
|---|---|
| Adelaide Road | TR15 2HQ |
| Albany Close | TR15 2HX |
| Albany Court | TR15 2NY |
| Albany Gardens | TR15 2PA |
| Albany Lane | TR15 2XF |
| Albany Road | TR15 2HU TR15 2HY TR15 2HZ TR15 2JB |
| Bucketts Hill | TR16 6RW |
| Buller Hill | TR16 6SR TR16 6SS |
| Carknown Gardens | TR15 2LG |
| Church Coombe | TR16 6RT |
| Churchtown | TR15 3BT |
| Clijah Close | TR15 2NS |
| Clijah Terrace | TR15 2RD |
| Clinton Close | TR15 2LR |
| Clinton Road | TR15 2LL TR15 2LP TR15 2LT TR15 2LW TR15 2QE TR15 2QG TR15 2QH TR15 2FX |
| Coach Lane | TR15 2TP |
| Copper Close | TR15 1FR |
| Copper Lane | TR16 6SD |
| Coronation Road | TR15 2JY |
| Euny Close | TR15 3DB |
| Falmouth Road | TR15 2QJ TR15 2QP TR15 2QT TR15 2QU TR15 2QW TR15 2QX TR15 2RA TR15 2RB TR15 2QN TR15 2QY |
| Forth An Ryn | TR15 2JT |
| Garby Lane | TR15 2NU |
| Gilly Fields | TR15 2TF |
| Gilly Hill | TR15 2RN TR15 2RW |
| Glendale Crescent | TR15 2JR |
| Halvana | TR15 2FG |
| Heanton Villas | TR15 2HT |
| Higher Sentry | TR15 2TN |
| Langarth Court | TR15 2FP |
| Little Gilly Hill | TR15 2RP |
| Lyn Meynek | TR15 2JQ |
| Mount Carbis Gardens | TR15 2JZ |
| Mount Carbis Road | TR15 2LB TR15 2LD TR15 2QQ |
| Old Sandy Lane | TR16 5BW |
| Parc Vean | TR15 2TT |
| Park Road | TR15 2JD TR15 2JF TR15 2JG |
| Redvers Heights | TR15 2XQ |
| Sandy Lane | TR16 5SU TR16 5SS |
| Seleggan Hill | TR16 6RS |
| South Albany Road | TR15 2PB TR15 2PE |
| South Turnpike | TR15 2LZ |
| Southgate Street | TR15 2LU TR15 2LY TR15 2NA TR15 2NB TR15 2ND TR15 2NE |
| Sparnon Close | TR15 2EW TR15 2RJ |
| Sparnon Court | TR15 2RE |
| Sparnon Hill | TR15 2RH |
| Sparnon Terrace | TR15 2RF TR15 2RG |
| The Old Tram Way | TR15 2FF |
| The Paddock | TR15 2BN |
| Town Farm | TR15 2XG |
| Trefusis Road | TR15 2JH TR15 2JL TR15 2JN |
| Treruffe Hill | TR15 2PS TR15 2PY |
| Treruffe Terrace | TR15 2FW |
| Trevingey Close | TR15 3BX |
| Trevingey Crescent | TR15 3DF |
| Trevingey Farm Gardens | TR15 3DA |
| Trevingey Lane | TR15 3DL |
| Trevingey Parc | TR15 3BZ |
| Trevingey Road | TR15 3DG TR15 3DH TR15 3DQ |
| Trewirgie Gardens | TR15 2TL |
| Trewirgie Hill | TR15 2TB TR15 3TB TR16 6FB |
| Trewirgie Road | TR15 2SX TR15 2SZ |
| Trewirgie Vean | TR15 2RR |
| Wentworth Close | TR15 2NJ |
| West Trevingey | TR15 3DJ |
| West Trewirgie Road | TR15 2TJ |
| Westborne Heights | TR15 2TQ |
| Wheal Dance | TR15 2LE |
| Wheal Trelawney | TR15 2LQ |
| Wheal Uny | TR15 2TD |
| Wheal Vor | TR15 2LF |
| Wilkinson Gardens | TR15 2FB TR15 2FD |
| TR16 6RA TR16 6ST TR15 2FT TR15 2HP TR16 6JT TR16 6RP |
Transport near Redruth South
-
Redruth Station
-
Camborne Station
-
Perranwell Station
-
Penryn Station
-
Truro Station
-
Penmere Station
-
Falmouth Town Station
-
Hayle Station
-
Falmouth Docks Station
-
Lelant Station
- FAQ
- Price Paid By Year
- Property Type Price
Frequently asked questions about Redruth South
What is the average price for a property for sale in Redruth South?
The average price for a property for sale in Redruth South is £274,602. This amount is 2% higher than the average price in Redruth. There are 878 property listings for sale in Redruth South.
What streets have the most expensive properties for sale in Redruth South?
The streets with the most expensive properties for sale in Redruth South are Langarth Court at an average of £725,000, Wheal Uny at an average of £582,500 and Trewirgie Hill at an average of £494,166.
What streets have the most affordable properties for sale in Redruth South?
The streets with the most affordable properties for sale in Redruth South are Little Gilly Hill at an average of £95,000, Sparnon Close at an average of £114,000 and Heanton Villas at an average of £114,000.
Which train stations are available in or near Redruth South?
Some of the train stations available in or near Redruth South are Redruth, Camborne and Perranwell.
Property Price Paid in Redruth South by Year
The average sold property price by year was:
| Year | Average Sold Price | Price Change |
Sold Properties
|
|---|---|---|---|
| 2025 | £263,817 | -6% |
53 Properties |
| 2024 | £279,171 | 0,4% |
69 Properties |
| 2023 | £278,064 | 9% |
74 Properties |
| 2022 | £251,921 | -9% |
57 Properties |
| 2021 | £273,678 | 24% |
100 Properties |
| 2020 | £208,632 | -1% |
83 Properties |
| 2019 | £210,432 | 1% |
83 Properties |
| 2018 | £207,354 | 1% |
73 Properties |
| 2017 | £205,753 | 10% |
106 Properties |
| 2016 | £185,678 | 4% |
90 Properties |
| 2015 | £177,742 | 2% |
81 Properties |
| 2014 | £174,142 | 6% |
102 Properties |
| 2013 | £164,221 | 5% |
85 Properties |
| 2012 | £156,691 | -11% |
83 Properties |
| 2011 | £173,173 | 3% |
59 Properties |
| 2010 | £168,559 | 7% |
46 Properties |
| 2009 | £156,554 | -5% |
56 Properties |
| 2008 | £164,512 | -11% |
49 Properties |
| 2007 | £182,271 | 1% |
83 Properties |
| 2006 | £180,850 | 13% |
108 Properties |
| 2005 | £157,136 | -3% |
98 Properties |
| 2004 | £161,961 | 14% |
78 Properties |
| 2003 | £139,016 | 26% |
109 Properties |
| 2002 | £102,667 | 22% |
92 Properties |
| 2001 | £79,681 | 17% |
111 Properties |
| 2000 | £65,746 | 14% |
91 Properties |
| 1999 | £56,656 | 3% |
99 Properties |
| 1998 | £55,002 | 8% |
84 Properties |
| 1997 | £50,680 | 18% |
74 Properties |
| 1996 | £41,525 | -10% |
61 Properties |
| 1995 | £45,658 | - |
49 Properties |
Property Price per Property Type in Redruth South
Here you can find historic sold price data in order to help with your property search.
The average Property Paid Price for specific property types in the last three years are:
| Property Type | Average Sold Price | Sold Properties |
|---|---|---|
| Semi Detached House | £283,978.00 | 50 Semi Detached Houses |
| Detached House | £354,830.00 | 69 Detached Houses |
| Terraced House | £214,447.00 | 61 Terraced Houses |
| Flat | £128,657.00 | 16 Flats |

