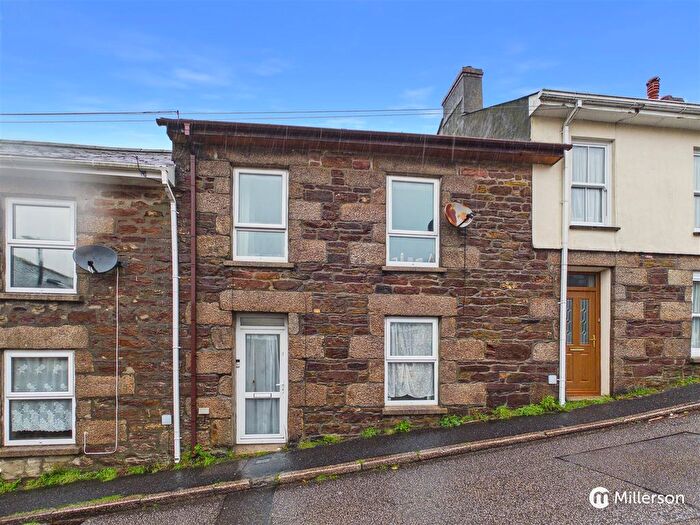
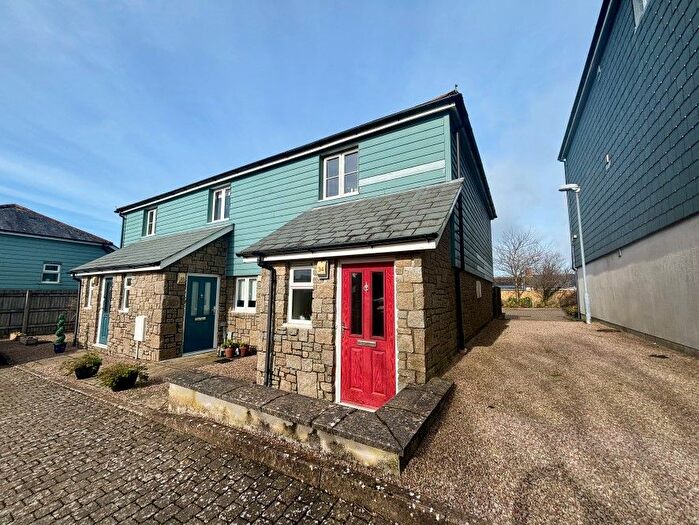
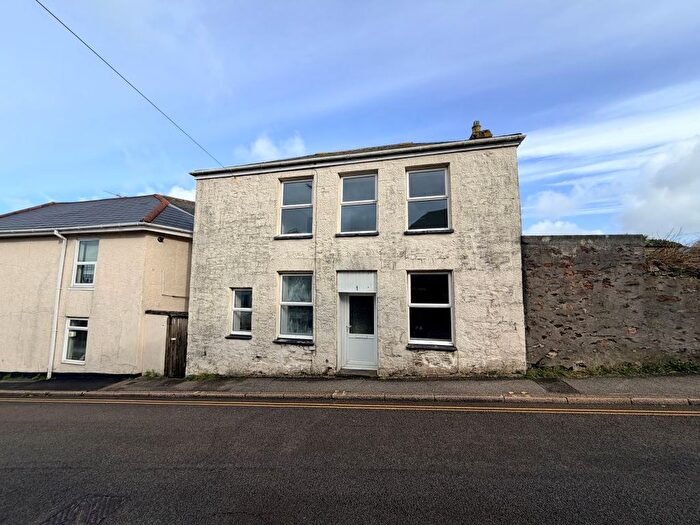
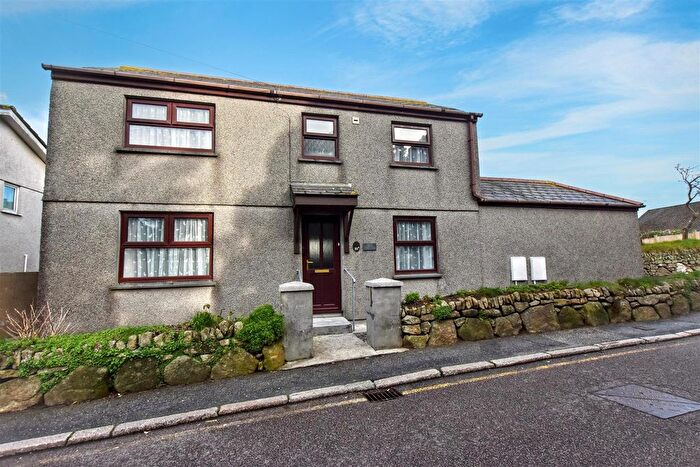
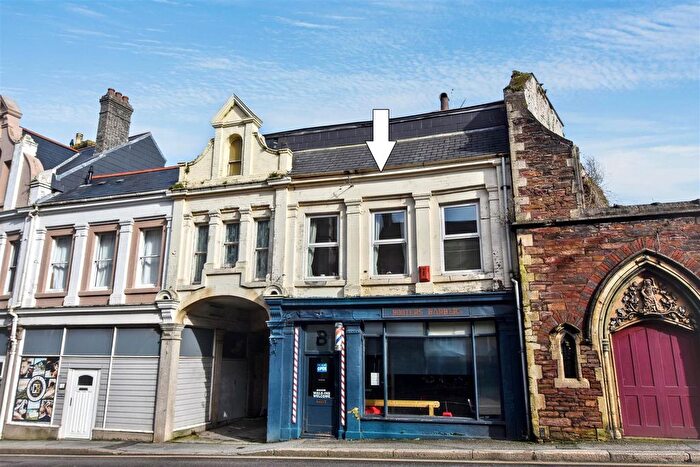
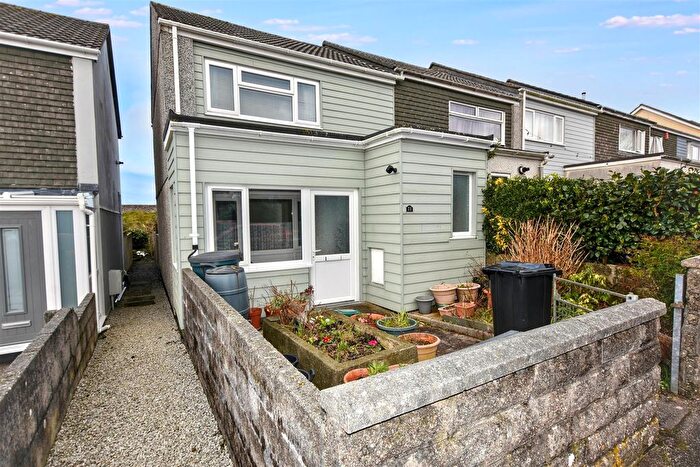
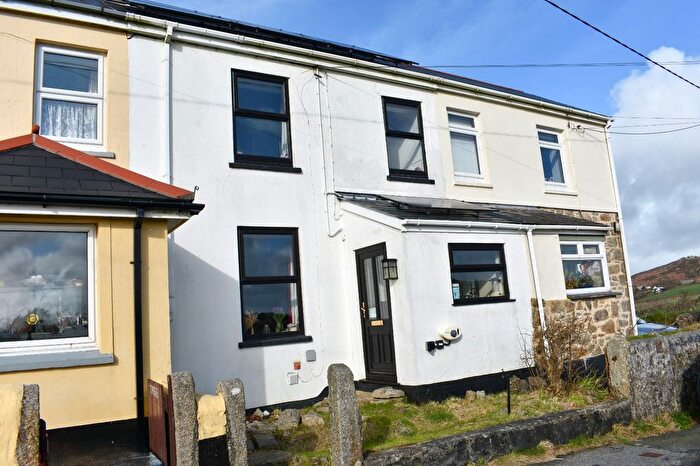
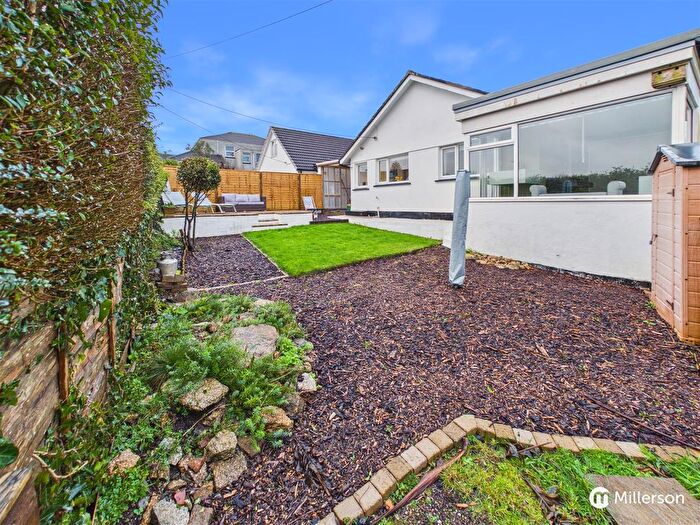
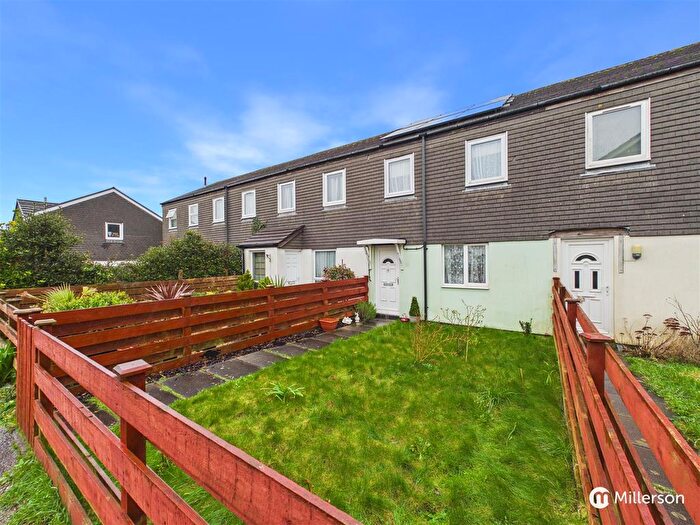
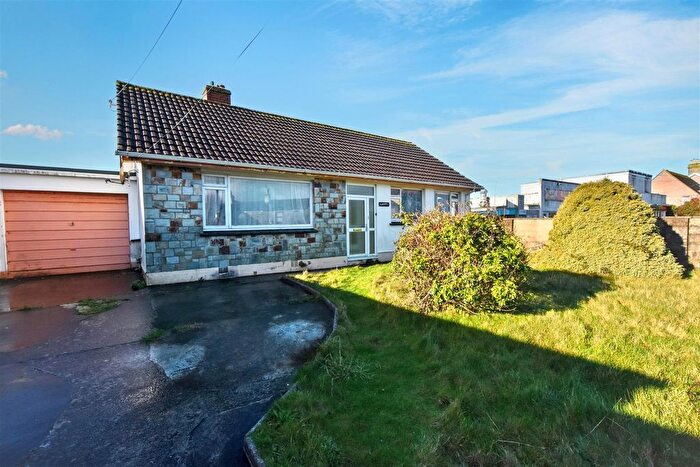
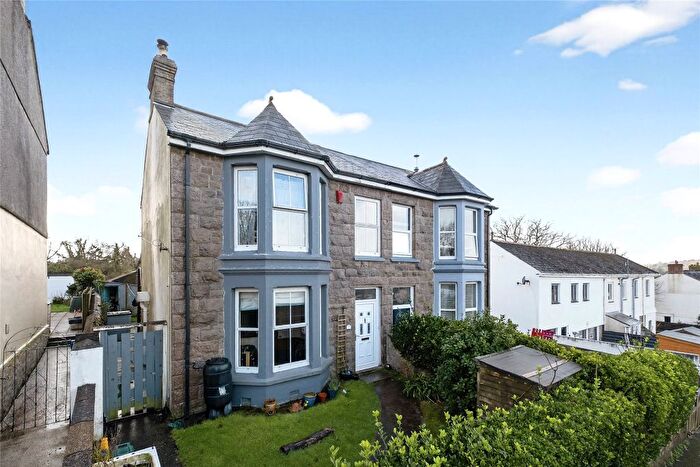
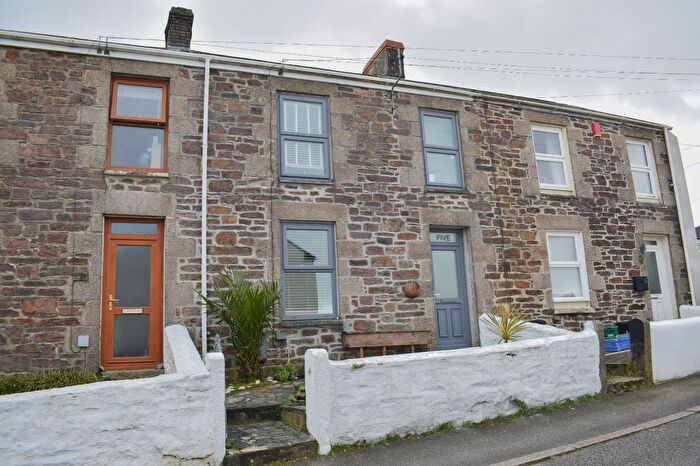
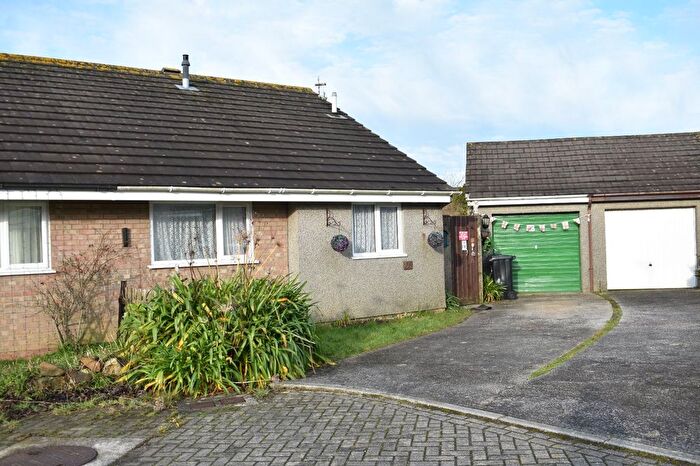
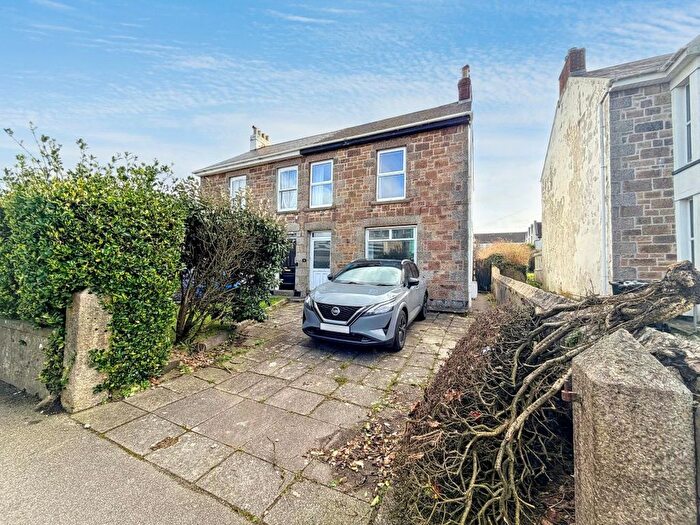
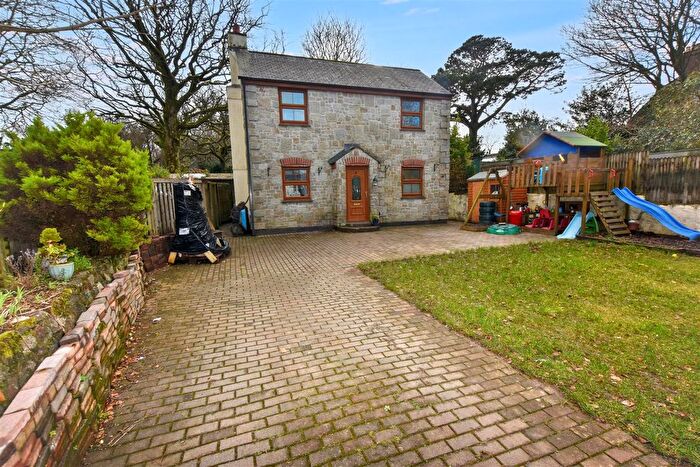
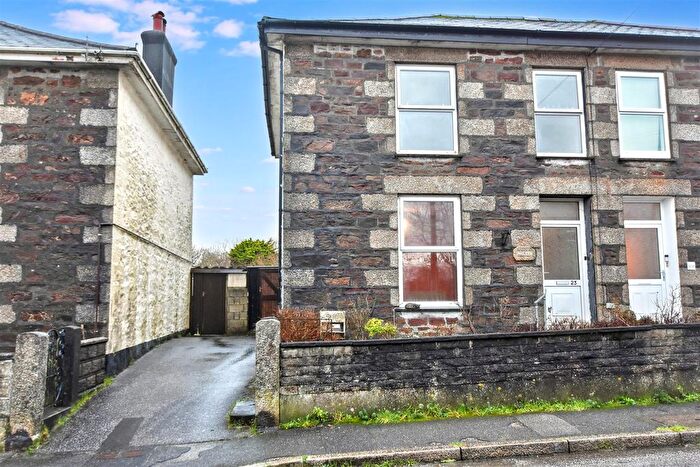
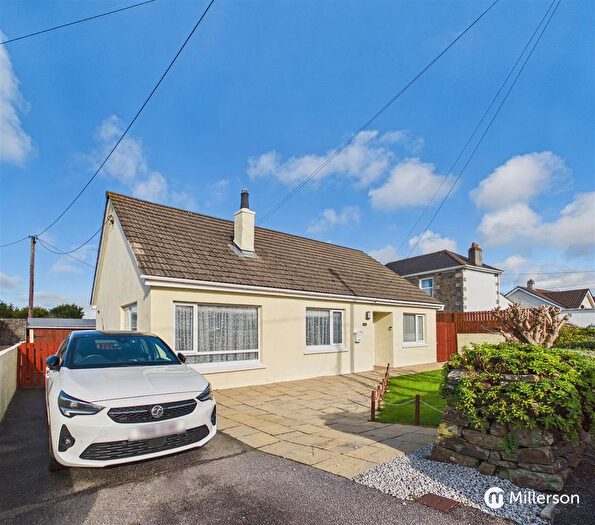
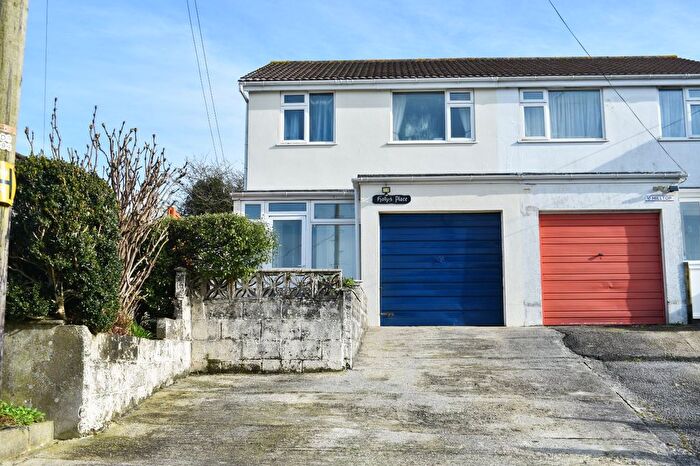
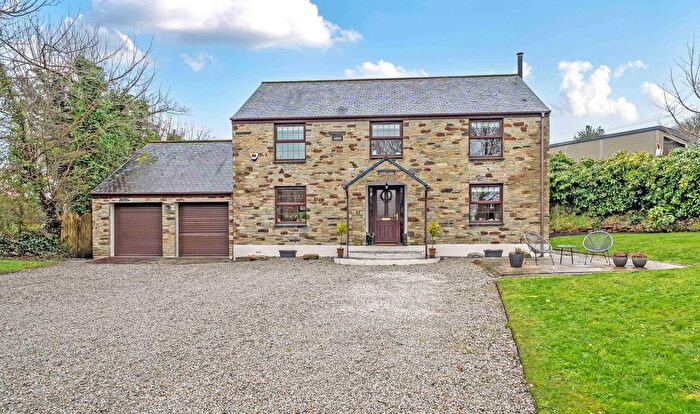
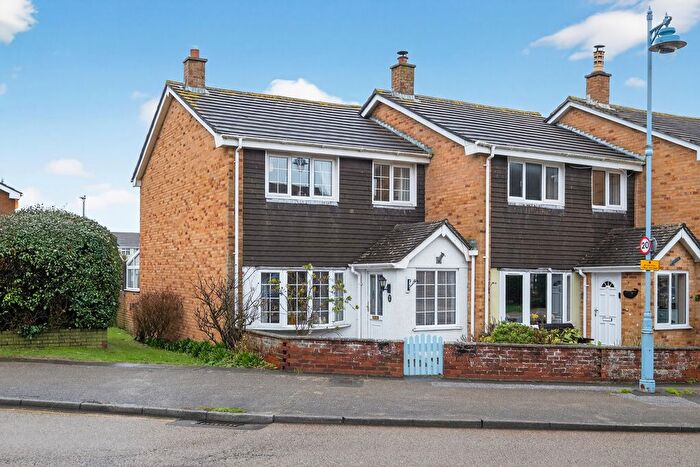
Houses for sale & to rent in Redruth, Cornwall
House Prices in Redruth
Properties in Redruth have an average house price of £270,260.00 and had 1,483 Property Transactions within the last 3 years.¹
Redruth is an area in Cornwall with 14,875 households², where the most expensive property was sold for £4,800,000.00.
Properties for sale in Redruth
Neighbourhoods in Redruth
Navigate through our locations to find the location of your next house in Redruth, Cornwall for sale or to rent.
- Carharrack, Gwennap And St Day
- Chacewater, Kenwyn And Baldhu
- Crowan And Wendron
- Four Lanes
- Illogan
- Lanner And Stithians
- Mount Hawke And Portreath
- Pool And Tehidy
- Redruth Central
- Redruth North
- Redruth South
- Pool & Tehidy
- Illogan & Portreath
- Redruth Central, Carharrack & St Day
- Perranporth
- Four Lanes, Beacon & Troon
Transport in Redruth
Please see below transportation links in this area:
-
Redruth Station
-
Camborne Station
-
Perranwell Station
-
Penryn Station
-
Truro Station
-
Penmere Station
-
Hayle Station
-
Falmouth Town Station
-
Falmouth Docks Station
-
Lelant Station
- FAQ
- Price Paid By Year
- Property Type Price
Frequently asked questions about Redruth
What is the average price for a property for sale in Redruth?
The average price for a property for sale in Redruth is £270,260. This amount is 22% lower than the average price in Cornwall. There are 5,853 property listings for sale in Redruth.
What locations have the most expensive properties for sale in Redruth?
The locations with the most expensive properties for sale in Redruth are Mount Hawke And Portreath at an average of £367,244, Chacewater, Kenwyn And Baldhu at an average of £335,500 and Crowan And Wendron at an average of £326,264.
What locations have the most affordable properties for sale in Redruth?
The locations with the most affordable properties for sale in Redruth are Redruth North at an average of £222,368, Pool And Tehidy at an average of £229,116 and Redruth Central at an average of £238,239.
Which train stations are available in or near Redruth?
Some of the train stations available in or near Redruth are Redruth, Camborne and Perranwell.
Property Price Paid in Redruth by Year
The average sold property price by year was:
| Year | Average Sold Price | Price Change |
Sold Properties
|
|---|---|---|---|
| 2025 | £259,485 | -4% |
402 Properties |
| 2024 | £268,902 | -4% |
552 Properties |
| 2023 | £279,866 | 2% |
529 Properties |
| 2022 | £274,840 | 9% |
590 Properties |
| 2021 | £249,852 | 13% |
705 Properties |
| 2020 | £218,501 | 4% |
590 Properties |
| 2019 | £210,232 | 4% |
658 Properties |
| 2018 | £201,544 | 1% |
709 Properties |
| 2017 | £200,408 | 6% |
745 Properties |
| 2016 | £187,852 | 8% |
699 Properties |
| 2015 | £172,978 | 0,1% |
654 Properties |
| 2014 | £172,724 | 2% |
680 Properties |
| 2013 | £170,043 | -0,2% |
547 Properties |
| 2012 | £170,385 | -1% |
512 Properties |
| 2011 | £172,290 | 1% |
422 Properties |
| 2010 | £171,082 | 4% |
406 Properties |
| 2009 | £164,477 | -5% |
396 Properties |
| 2008 | £173,037 | -8% |
379 Properties |
| 2007 | £186,116 | 7% |
731 Properties |
| 2006 | £172,781 | 5% |
778 Properties |
| 2005 | £163,888 | 7% |
589 Properties |
| 2004 | £152,396 | 13% |
726 Properties |
| 2003 | £131,960 | 22% |
738 Properties |
| 2002 | £102,867 | 25% |
791 Properties |
| 2001 | £77,405 | 11% |
805 Properties |
| 2000 | £69,272 | 16% |
749 Properties |
| 1999 | £58,490 | 10% |
818 Properties |
| 1998 | £52,447 | 4% |
721 Properties |
| 1997 | £50,156 | 10% |
791 Properties |
| 1996 | £45,186 | 6% |
623 Properties |
| 1995 | £42,263 | - |
468 Properties |
Property Price per Property Type in Redruth
Here you can find historic sold price data in order to help with your property search.
The average Property Paid Price for specific property types in the last three years are:
| Property Type | Average Sold Price | Sold Properties |
|---|---|---|
| Semi Detached House | £258,530.00 | 339 Semi Detached Houses |
| Terraced House | £216,007.00 | 532 Terraced Houses |
| Detached House | £378,087.00 | 480 Detached Houses |
| Flat | £126,946.00 | 132 Flats |

