
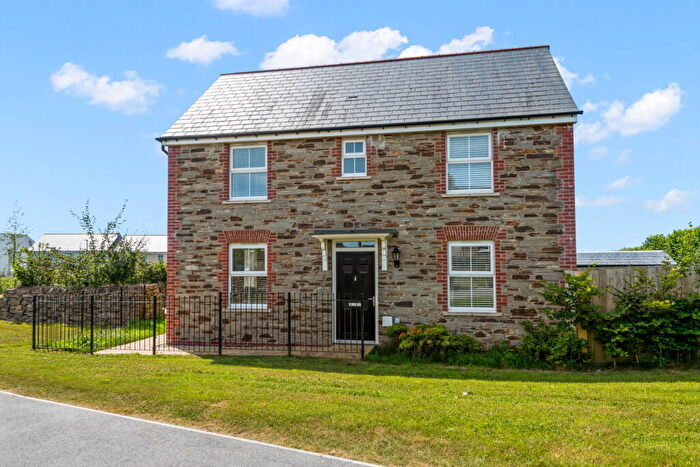
Houses for sale in Saltash, Cornwall
House Prices in Saltash
Properties in Saltash have an average house price of £298k and had 878 Property Transactions within the last 3 years.¹
Saltash is an area in Cornwall with 9,600 households², where the most expensive property was sold for £2.25M.
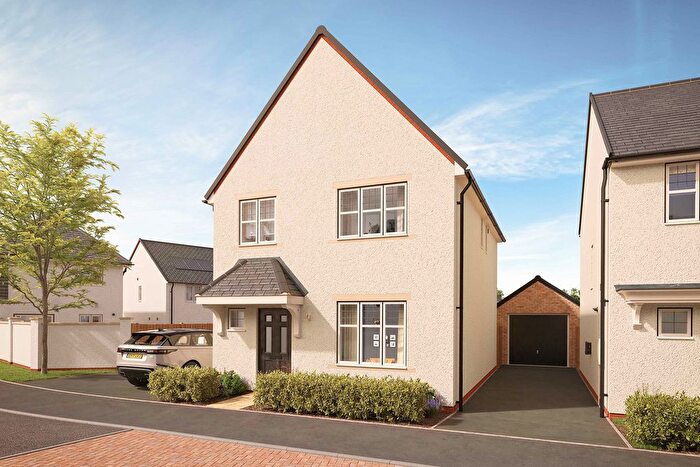
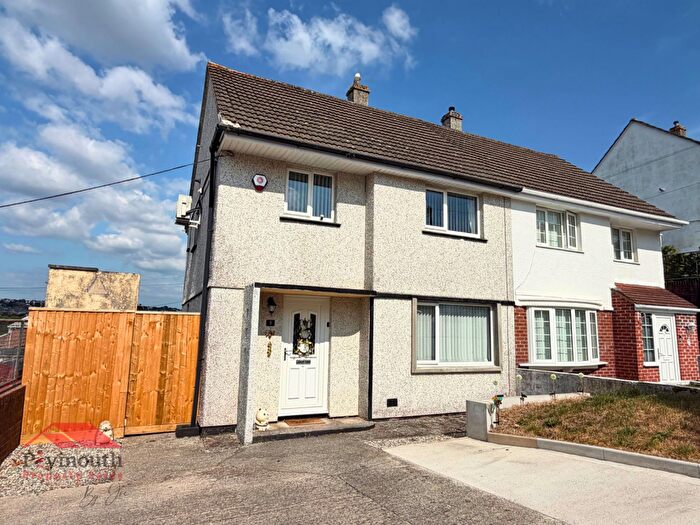
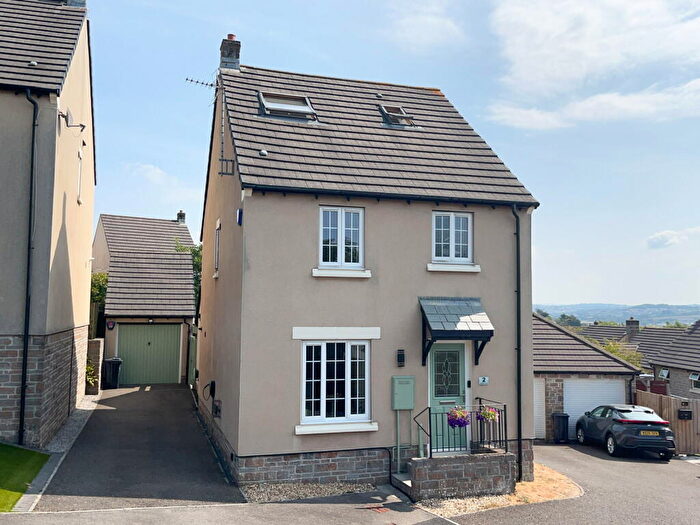
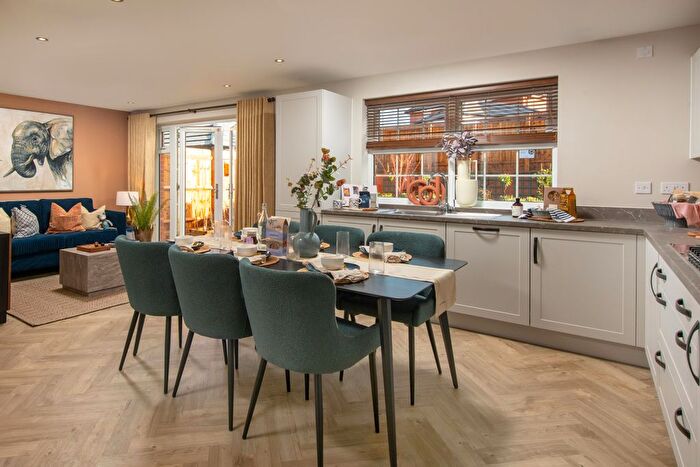
Properties for sale in Saltash
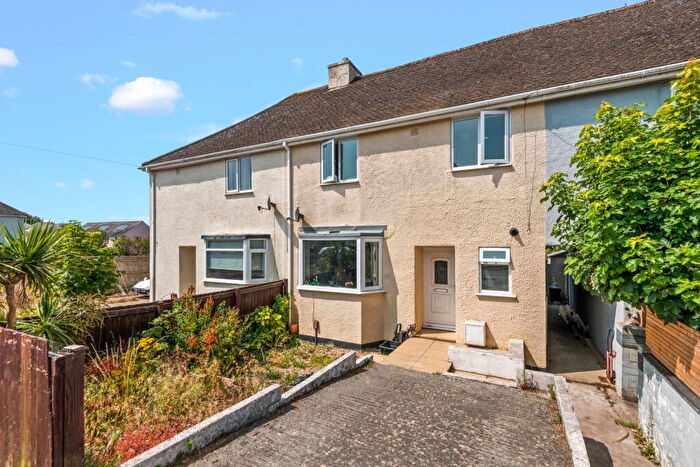
![]()
If you are looking to sell your house, let it out, or receive a property valuation, an expert can help you.
Click the button below to get started.

Neighbourhoods in Saltash
Navigate through our locations to find the location of your next house in Saltash, Cornwall for sale or to rent.
Property price trends in Saltash
According to the latest Land Registry data, the average home in Saltash sold for £328,163 in 2026. That figure comes from a substantial record of 12,625 sales logged over the past 31 years.
Prices have continued to climb over the last three years. Compared with 2023, when the typical sale came in around £293,109, that's a rise of roughly 12%.
Looking back five years, average prices are up about 20.1% since 2021, a gain of around £54,976 in cash terms.
Zoom out to the past decade for the fuller picture. Back in 2016, homes here averaged £220,541, so the typical sold price has climbed about 48.8% since then, roughly 4.1% a year. Stretch the view to fifteen years and that annual pace eases back to about 3.5%.
Frequently asked questions about Saltash
What is the average price for a property for sale in Saltash?
The average price for a property for sale in Saltash is £297,931. This amount is 13% lower than the average price in Cornwall. There are more than 10,000 property listings for sale in Saltash.
What locations have the most expensive properties for sale in Saltash?
The locations with the most expensive properties for sale in Saltash are St Dominick, Harrowbarrow And Kelly Bray at an average of £561,137, Menheniot at an average of £552,437 and St Germans And Landulph at an average of £354,354.
What locations have the most affordable properties for sale in Saltash?
The locations with the most affordable properties for sale in Saltash are Saltash South at an average of £244,673, Saltash North at an average of £262,731 and Saltash East at an average of £269,574.
Which train stations are available in or near Saltash?
Some of the train stations available in or near Saltash are Saltash, St.Budeaux Victoria Road and St.Budeaux Ferry Road.
Property Price Paid in Saltash by Year
The average sold property price by year was:
| Year | Average Sold Price | Price Change |
Sold Properties
|
|---|---|---|---|
| 2026 | £328,163 | 8% |
26 Properties |
| 2025 | £302,428 | 2% |
286 Properties |
| 2024 | £295,375 | 1% |
290 Properties |
| 2023 | £293,109 | -0,1% |
276 Properties |
| 2022 | £293,307 | 7% |
355 Properties |
| 2021 | £273,187 | 9% |
391 Properties |
| 2020 | £249,597 | 5% |
326 Properties |
| 2019 | £237,649 | -1% |
333 Properties |
| 2018 | £239,726 | 12% |
409 Properties |
| 2017 | £212,134 | -4% |
392 Properties |
Property Price per Property Type in Saltash
Here you can find historic sold price data in order to help with your property search.
The average Property Paid Price for specific property types in the last three years are:
| Property Type | Average Sold Price | Sold Properties |
|---|---|---|
| Semi Detached House | £256,948.00 | 213 Semi Detached Houses |
| Detached House | £424,938.00 | 305 Detached Houses |
| Terraced House | £231,065.00 | 289 Terraced Houses |
| Flat | £147,464.00 | 71 Flats |
Transport in Saltash
Please see below transportation links in this area:
