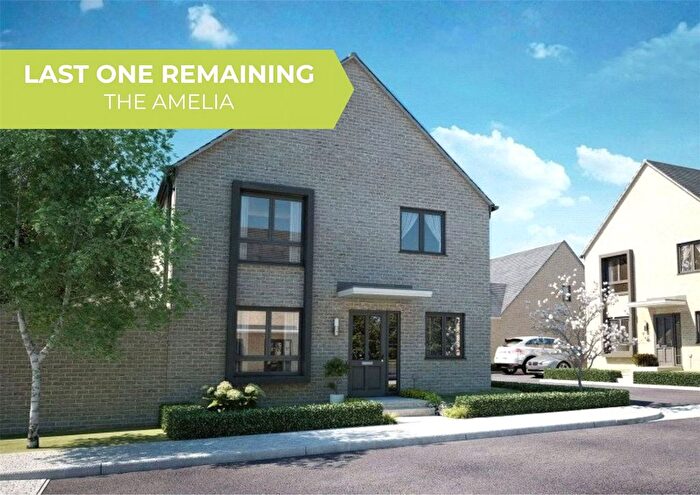
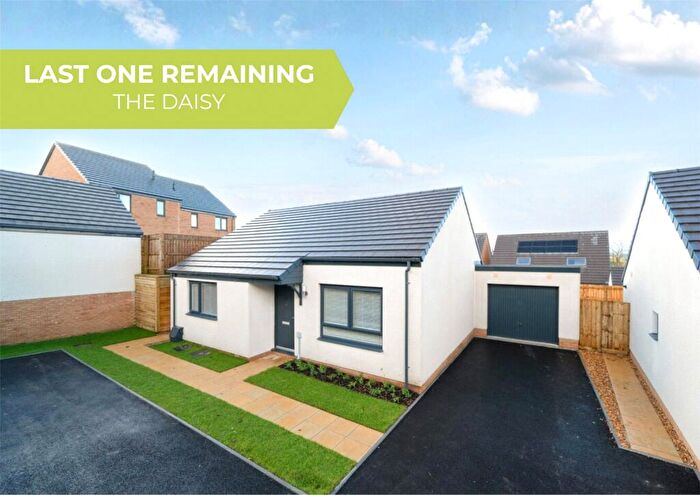
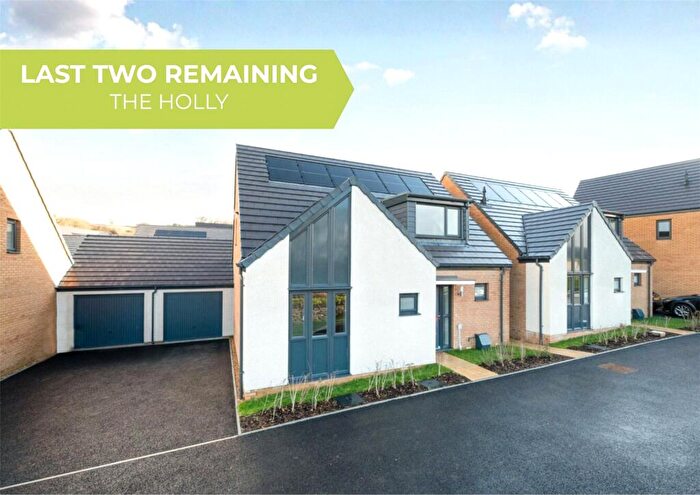
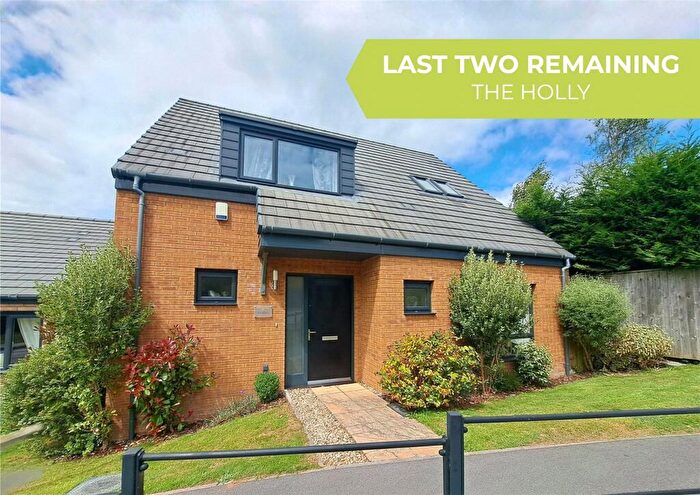
Houses for sale & to rent in Callington, Cornwall
House Prices in Callington
Properties in Callington have an average house price of £286,086.00 and had 410 Property Transactions within the last 3 years.¹
Callington is an area in Cornwall with 4,315 households², where the most expensive property was sold for £810,000.00.
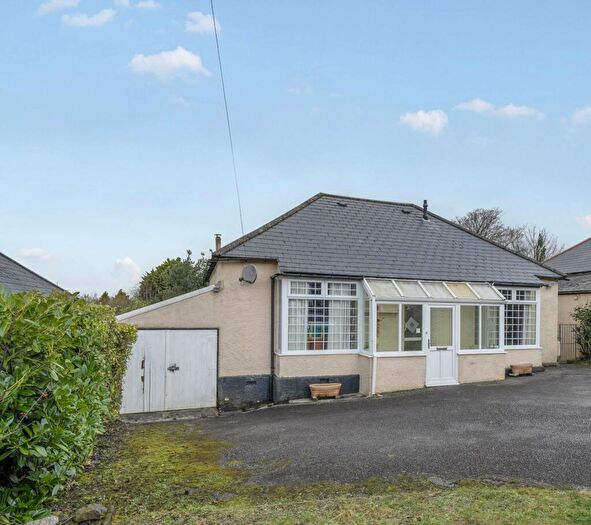
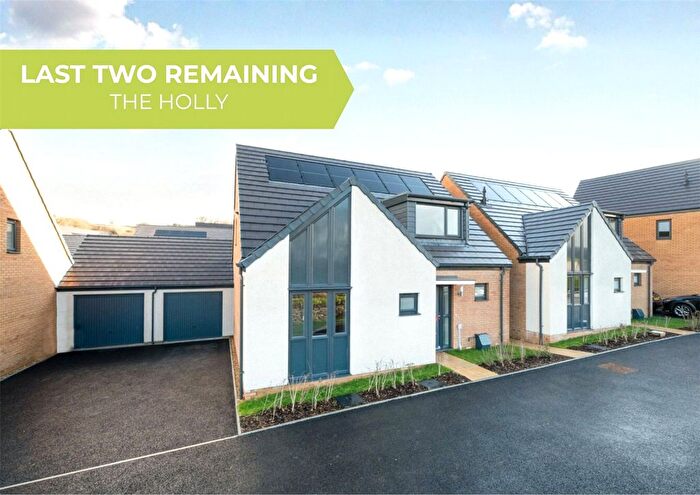
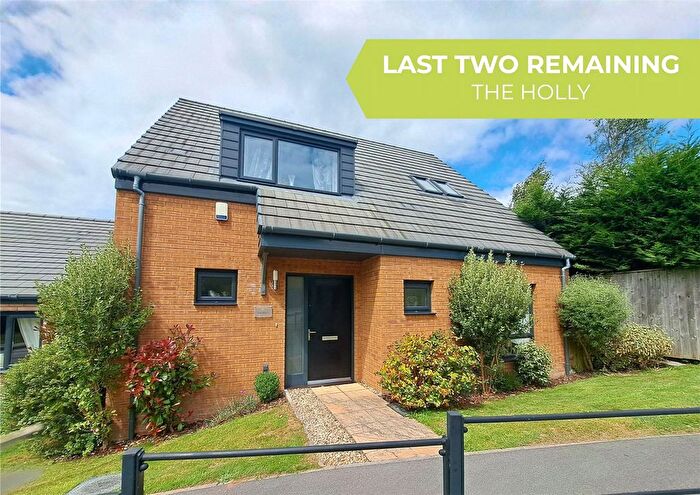
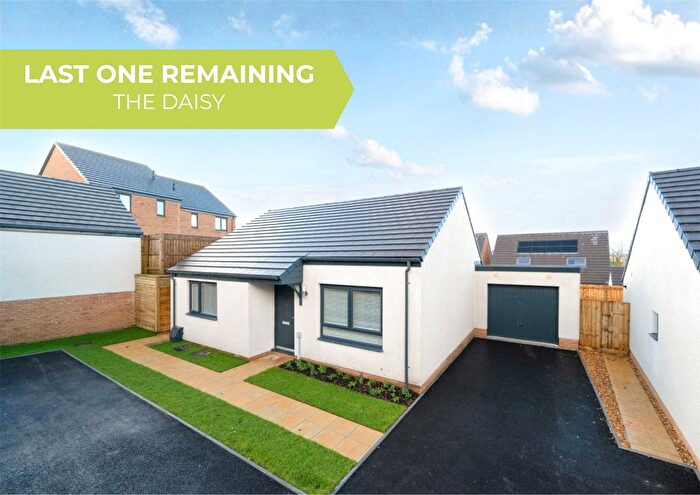
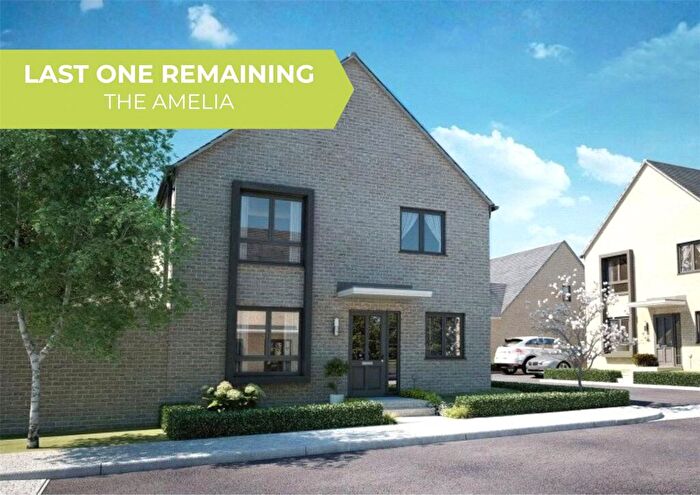
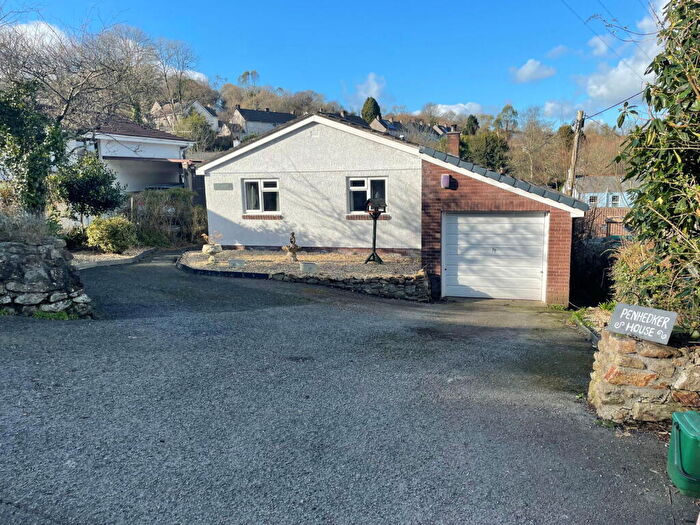
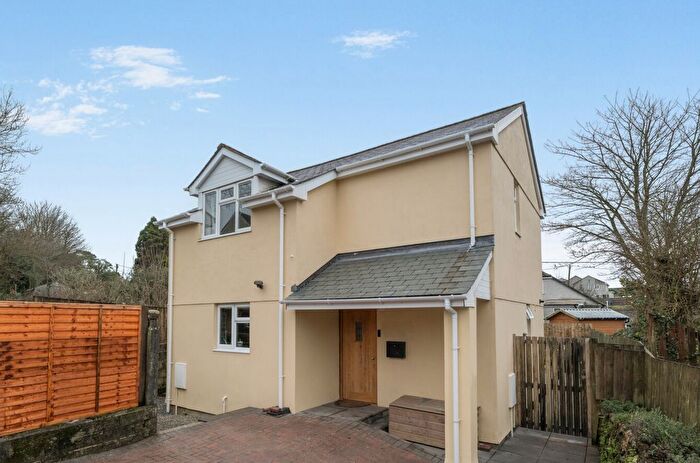
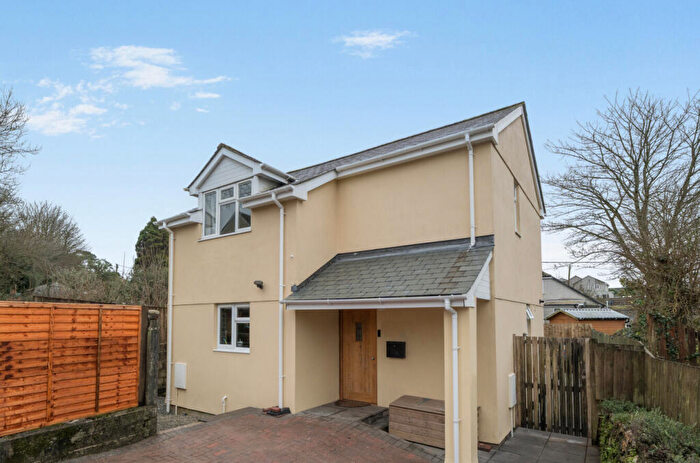
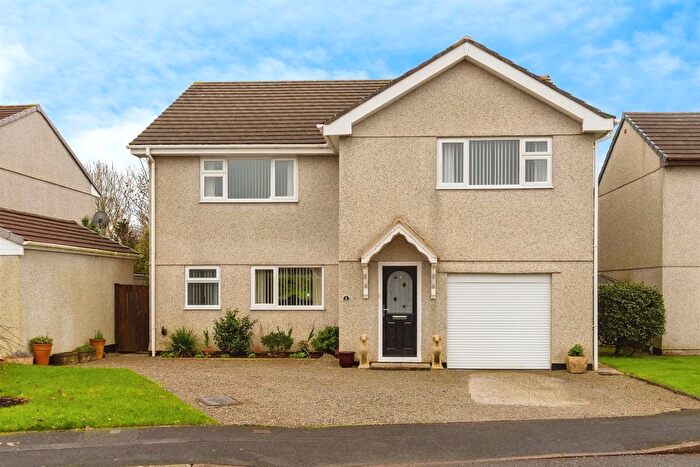
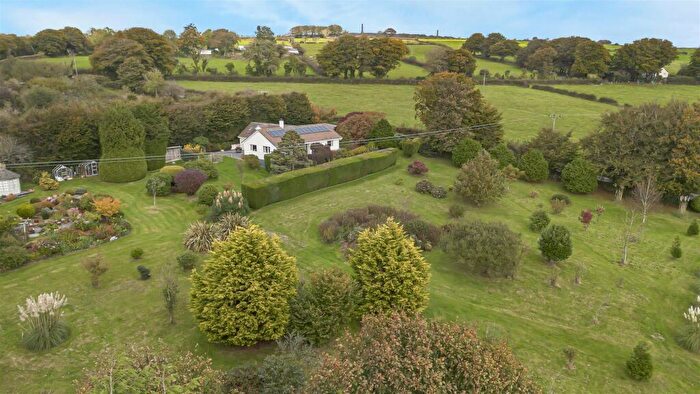
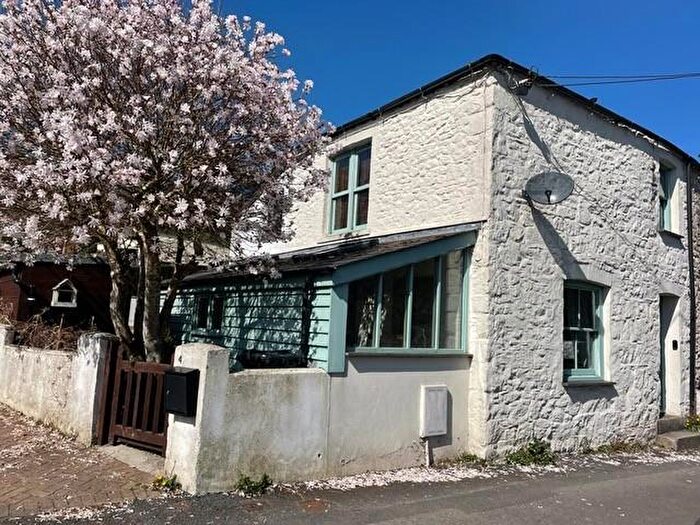
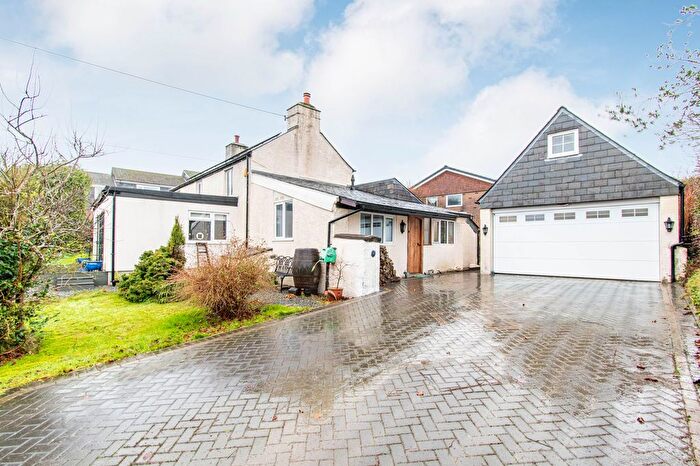
Properties for sale in Callington
Neighbourhoods in Callington
Navigate through our locations to find the location of your next house in Callington, Cornwall for sale or to rent.
Transport in Callington
Please see below transportation links in this area:
-
Gunnislake Station
-
Calstock Station
-
Bere Alston Station
-
Bere Ferrers Station
-
Menheniot Station
-
St.Germans Station
-
Liskeard Station
-
Saltash Station
-
Coombe Junction Halt Station
-
St.Keyne Wishing Well Halt Station
- FAQ
- Price Paid By Year
- Property Type Price
Frequently asked questions about Callington
What is the average price for a property for sale in Callington?
The average price for a property for sale in Callington is £286,086. This amount is 17% lower than the average price in Cornwall. There are 2,433 property listings for sale in Callington.
What locations have the most expensive properties for sale in Callington?
The locations with the most expensive properties for sale in Callington are Stokeclimsland at an average of £409,448, Lynher at an average of £395,091 and St Dominick, Harrowbarrow And Kelly Bray at an average of £301,637.
What locations have the most affordable properties for sale in Callington?
The locations with the most affordable properties for sale in Callington are Gunnislake And Calstock at an average of £78,332 and Callington at an average of £248,755.
Which train stations are available in or near Callington?
Some of the train stations available in or near Callington are Gunnislake, Calstock and Bere Alston.
Property Price Paid in Callington by Year
The average sold property price by year was:
| Year | Average Sold Price | Price Change |
Sold Properties
|
|---|---|---|---|
| 2025 | £292,926 | 4% |
130 Properties |
| 2024 | £282,061 | -1% |
139 Properties |
| 2023 | £283,748 | 4% |
141 Properties |
| 2022 | £273,565 | -1% |
173 Properties |
| 2021 | £277,359 | 8% |
237 Properties |
| 2020 | £255,105 | 14% |
160 Properties |
| 2019 | £218,536 | -10% |
174 Properties |
| 2018 | £241,061 | 10% |
151 Properties |
| 2017 | £218,000 | 5% |
187 Properties |
| 2016 | £207,867 | 5% |
212 Properties |
| 2015 | £196,929 | -1% |
188 Properties |
| 2014 | £199,064 | 1% |
182 Properties |
| 2013 | £197,386 | 1% |
145 Properties |
| 2012 | £194,671 | 2% |
118 Properties |
| 2011 | £191,517 | -11% |
132 Properties |
| 2010 | £213,474 | 14% |
132 Properties |
| 2009 | £184,596 | -10% |
124 Properties |
| 2008 | £202,233 | -4% |
132 Properties |
| 2007 | £210,600 | 7% |
226 Properties |
| 2006 | £195,482 | 5% |
242 Properties |
| 2005 | £186,011 | 7% |
199 Properties |
| 2004 | £173,119 | 18% |
282 Properties |
| 2003 | £141,539 | 10% |
284 Properties |
| 2002 | £126,981 | 22% |
285 Properties |
| 2001 | £98,993 | 19% |
244 Properties |
| 2000 | £79,719 | 11% |
227 Properties |
| 1999 | £70,751 | 3% |
262 Properties |
| 1998 | £68,916 | 9% |
246 Properties |
| 1997 | £62,876 | 3% |
207 Properties |
| 1996 | £61,021 | 4% |
179 Properties |
| 1995 | £58,610 | - |
132 Properties |
Property Price per Property Type in Callington
Here you can find historic sold price data in order to help with your property search.
The average Property Paid Price for specific property types in the last three years are:
| Property Type | Average Sold Price | Sold Properties |
|---|---|---|
| Semi Detached House | £237,413.00 | 94 Semi Detached Houses |
| Detached House | £374,216.00 | 198 Detached Houses |
| Terraced House | £186,436.00 | 96 Terraced Houses |
| Flat | £135,725.00 | 22 Flats |

