
Houses for sale in PL12 4XA, Nancarrows, Saltash West, Saltash
House Prices in PL12 4XA, Nancarrows, Saltash West
Properties in PL12 4XA have no sales history available within the last 3 years. PL12 4XA is a postcode in Nancarrows located in Saltash West, an area in Saltash, Cornwall, with 3 households².
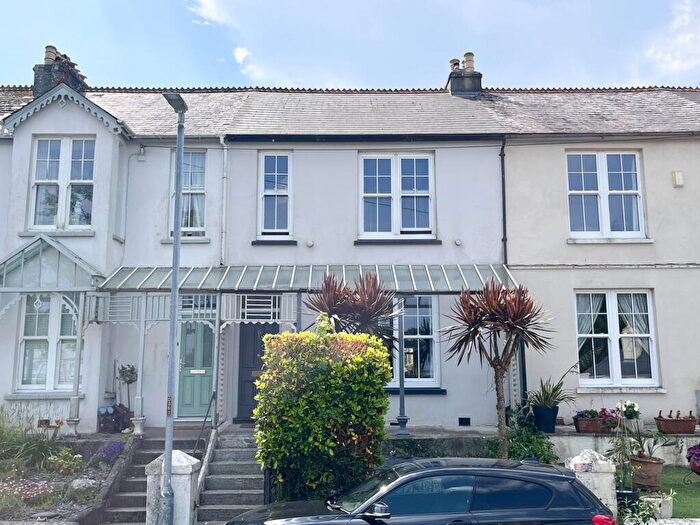
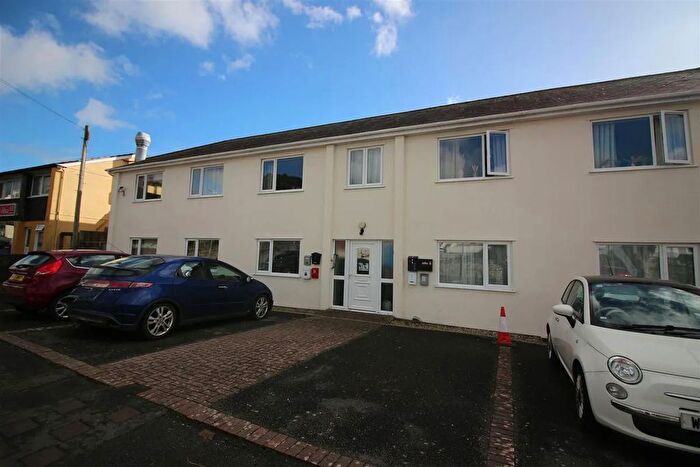
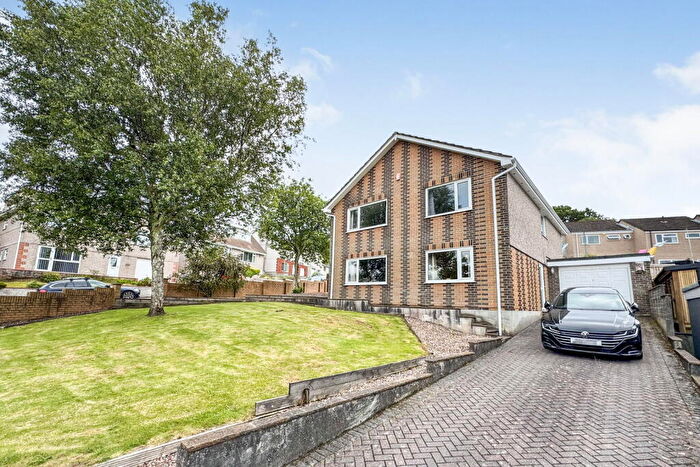
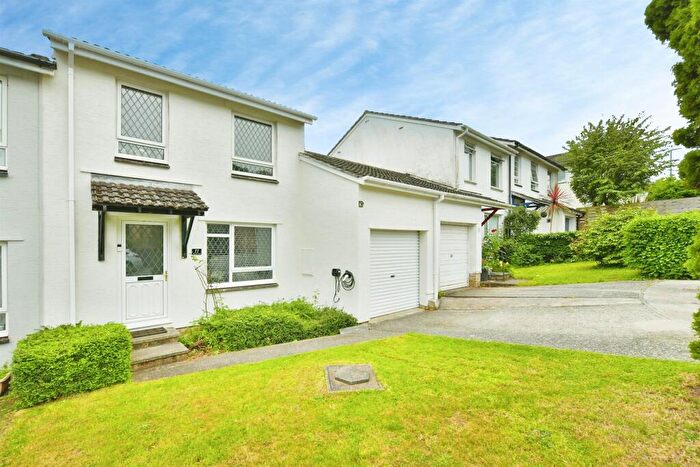
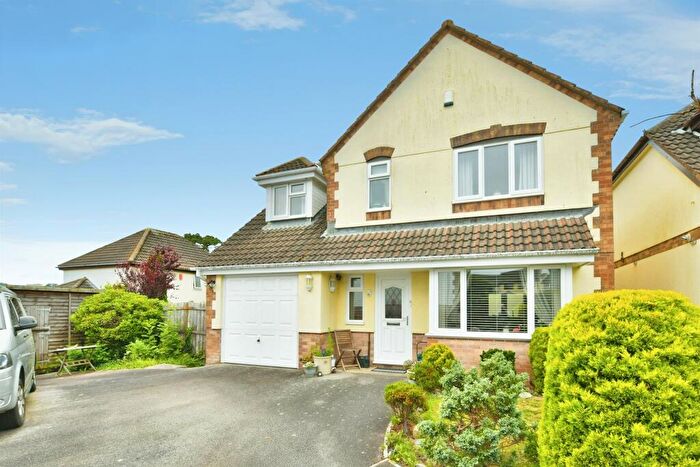
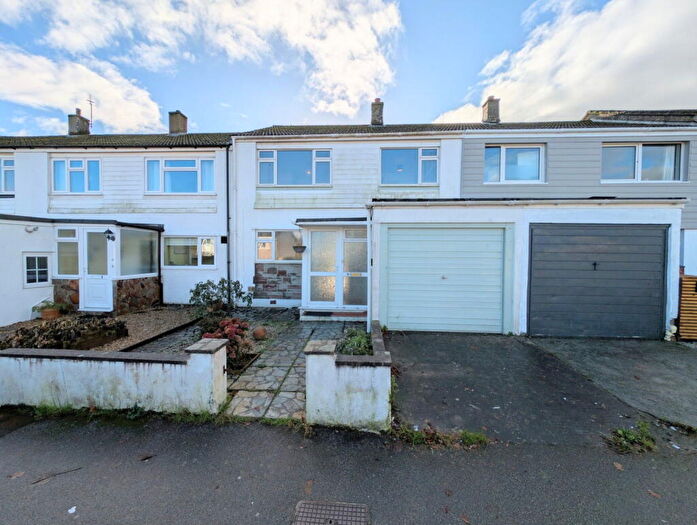
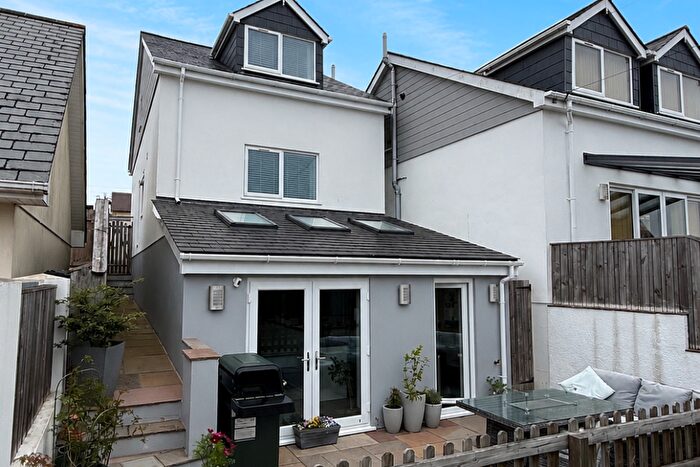
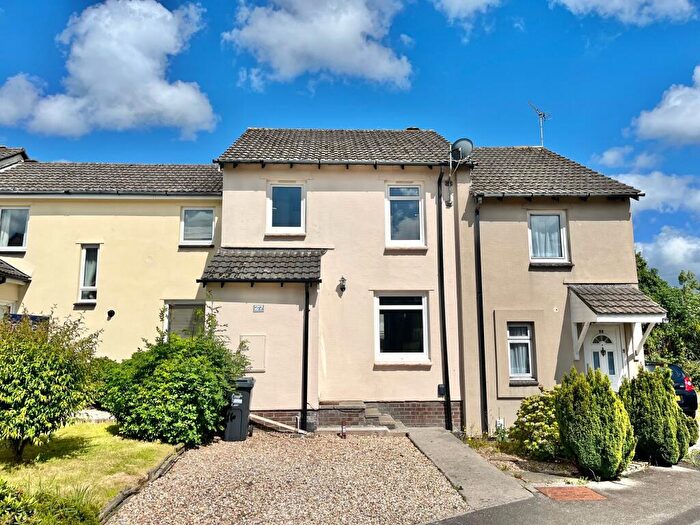
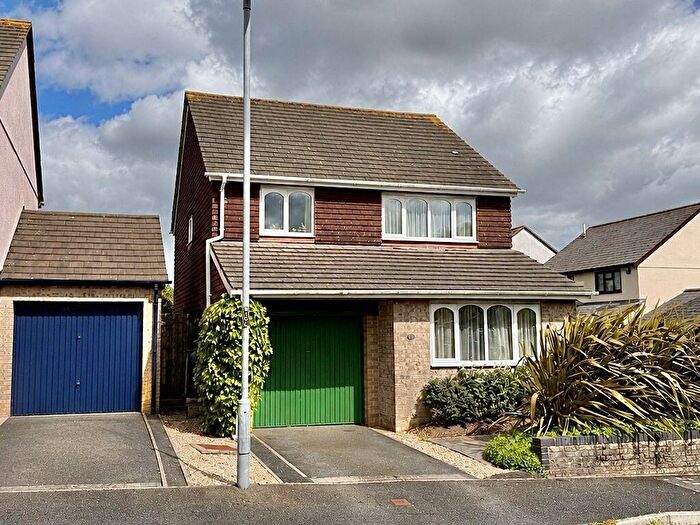
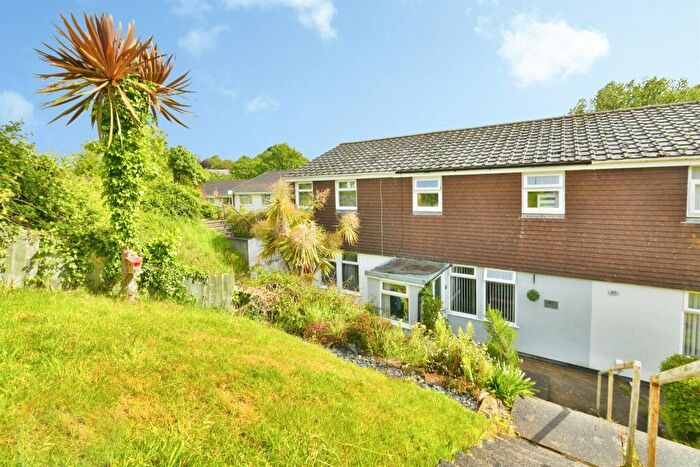
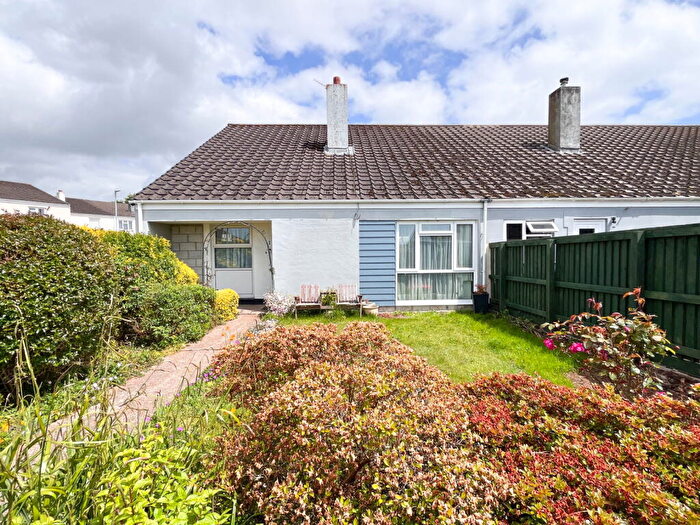
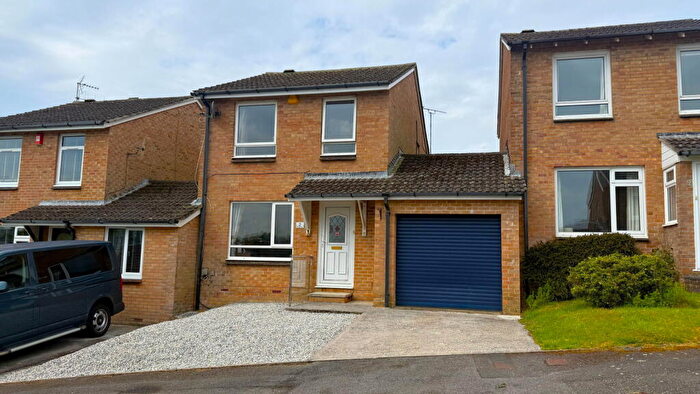
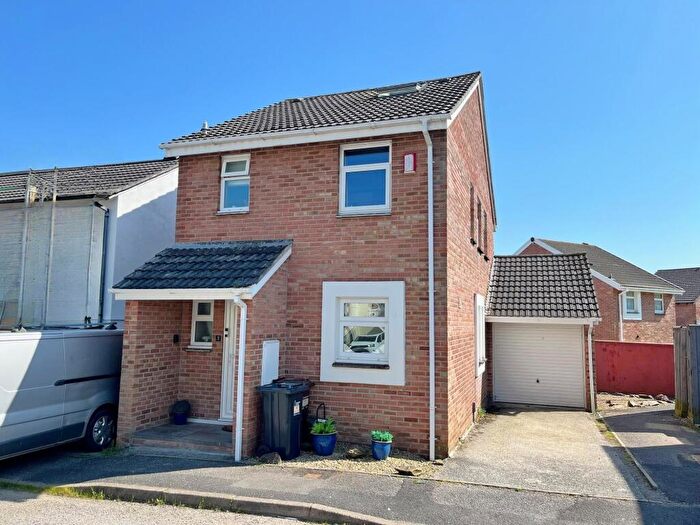
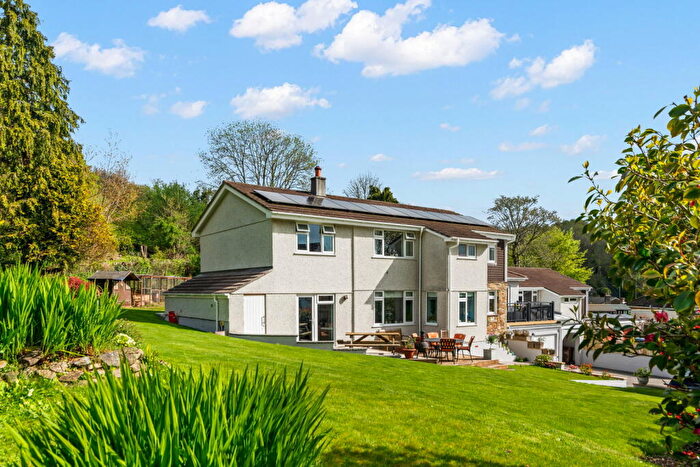
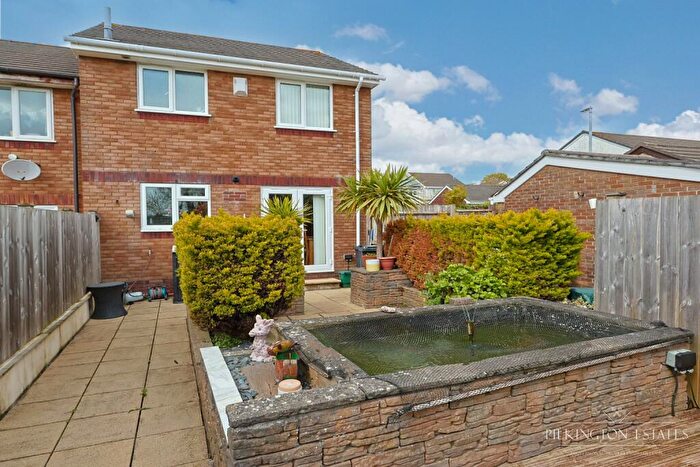
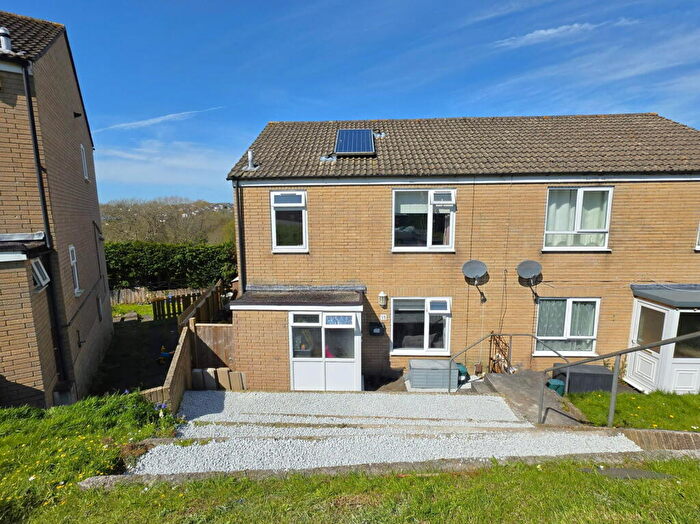
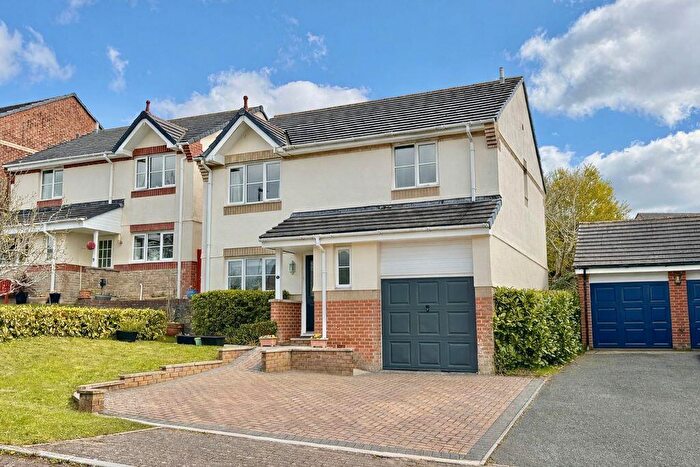
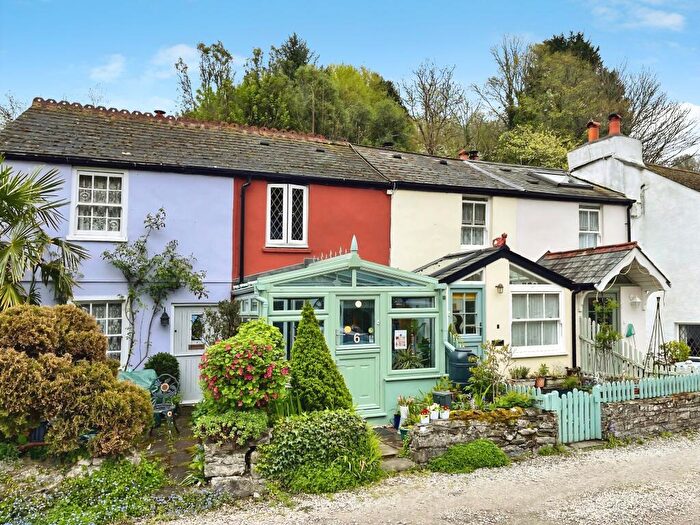
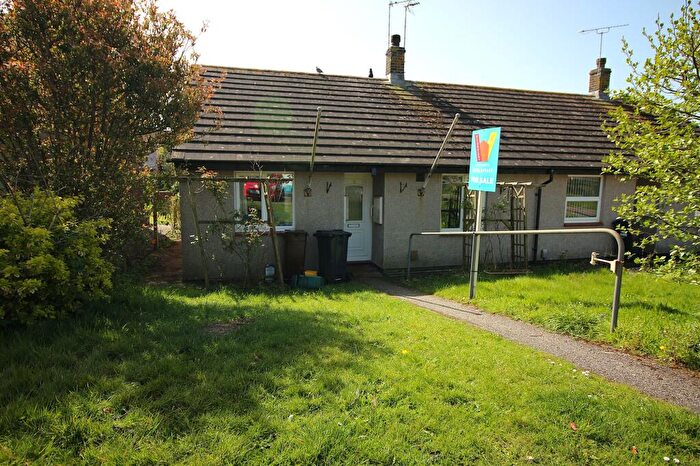
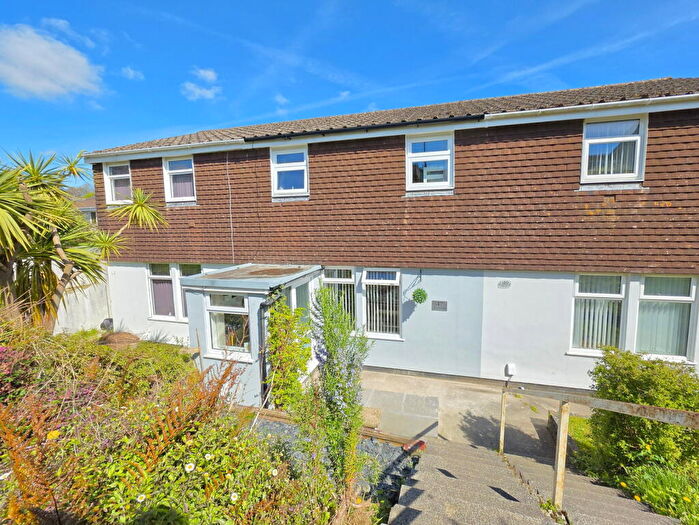
Properties for sale near PL12 4XA, Nancarrows

![]()
If you are looking to sell your house, let it out, or receive a property valuation, an expert can help you.
Click the button below to get started.
Price Paid in Nancarrows, PL12 4XA, Saltash West
6 Nancarrows, PL12 4XA, Saltash West Saltash
Property 6 has been sold 3 times. The last time it was sold was in 04/05/2012 and the sold price was £300,000.00.
This detached house, sold as a freehold on 04/05/2012, is a 182 sqm detached house with an EPC rating of D.
| Date | Price | Property Type | Tenure | Classification |
|---|---|---|---|---|
| 04/05/2012 | £300,000.00 | Detached House | freehold | Established Building |
| 29/09/2003 | £222,000.00 | Detached House | freehold | Established Building |
| 30/06/1995 | £93,000.00 | Detached House | freehold | Established Building |
2 Nancarrows, PL12 4XA, Saltash West Saltash
Property 2 has been sold 2 times. The last time it was sold was in 20/08/2001 and the sold price was £182,950.00.
This is a Detached House which was sold as a freehold in 20/08/2001
| Date | Price | Property Type | Tenure | Classification |
|---|---|---|---|---|
| 20/08/2001 | £182,950.00 | Detached House | freehold | Established Building |
| 04/12/1996 | £125,750.00 | Detached House | freehold | Established Building |
Property price trends in PL12 4XA, Nancarrows
According to the latest Land Registry data, the average home in PL12 4XA, Nancarrows sold for £300,000 in 2012. That figure comes from 5 sales logged over the past 17 years.
Zoom out to the past decade for the fuller picture. Back in 2001, homes here averaged £182,950, so the typical sold price has climbed about 64% since then, roughly 4.6% a year. Stretch the view to fifteen years and that annual pace edges up closer to 5.6%.
Property Price Paid in PL12 4XA, Nancarrows by Year
The average sold property price by year was:
| Year | Average Sold Price | Price Change |
Sold Properties
|
|---|---|---|---|
| 2012 | £300,000 | 26% |
1 Property |
| 2003 | £222,000 | 18% |
1 Property |
| 2001 | £182,950 | 31% |
1 Property |
| 1996 | £125,750 | 26% |
1 Property |
| 1995 | £93,000 | - |
1 Property |
