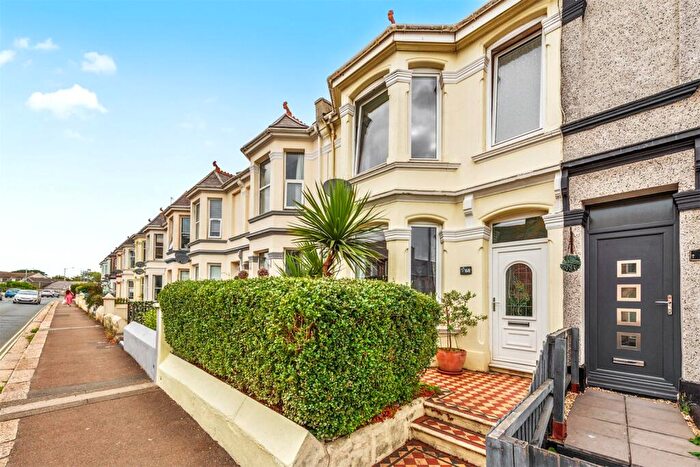
Houses for sale & to rent in Torpoint East, Torpoint
House Prices in Torpoint East
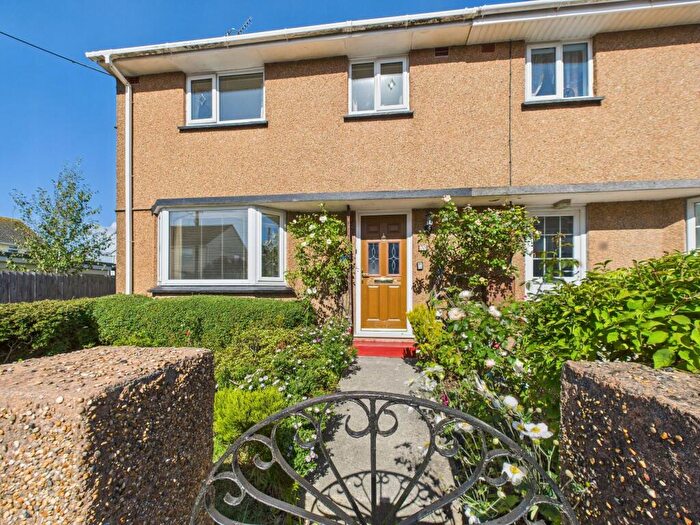
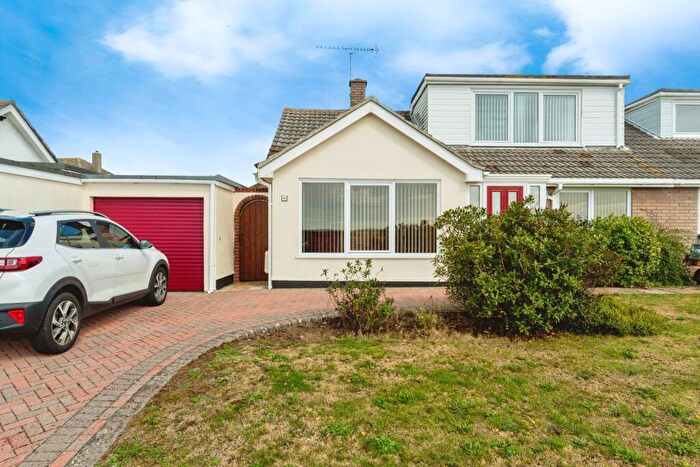
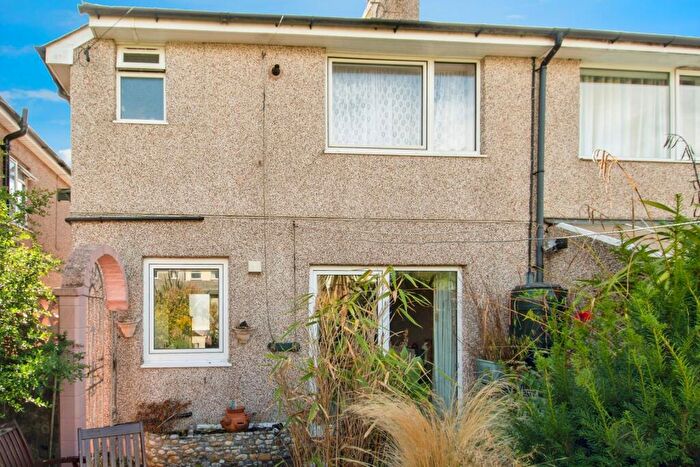
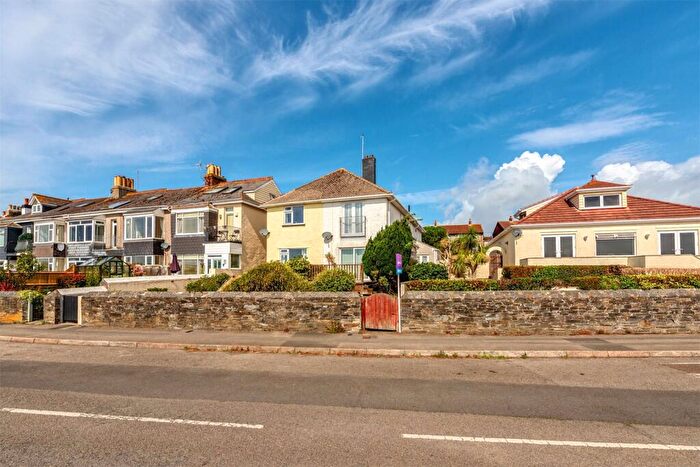
Properties in Torpoint East have an average house price of £216,154.00 and had 167 Property Transactions within the last 3 years¹.
Torpoint East is an area in Torpoint, Cornwall with 1,727 households², where the most expensive property was sold for £667,500.00.
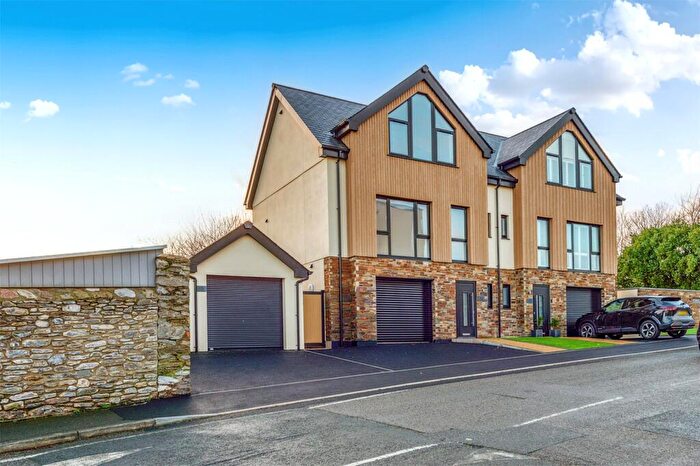
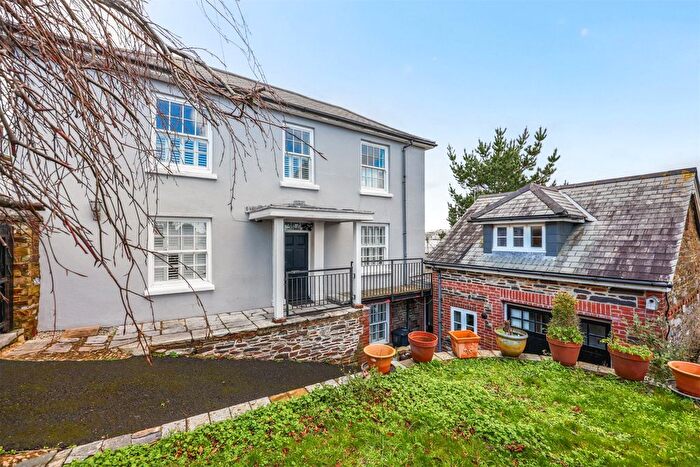
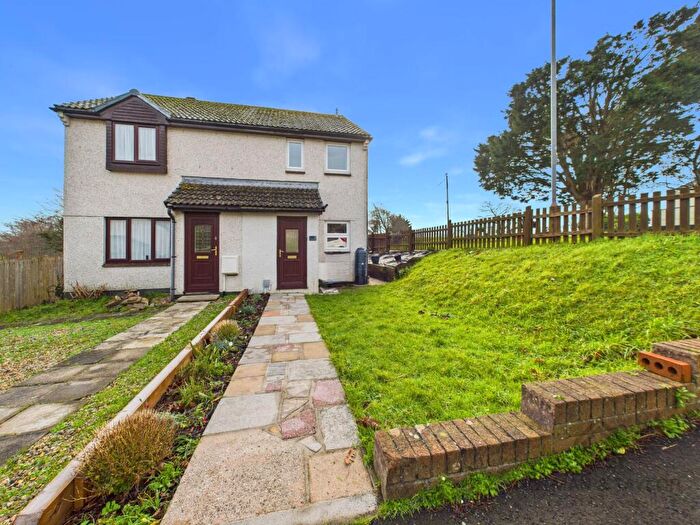
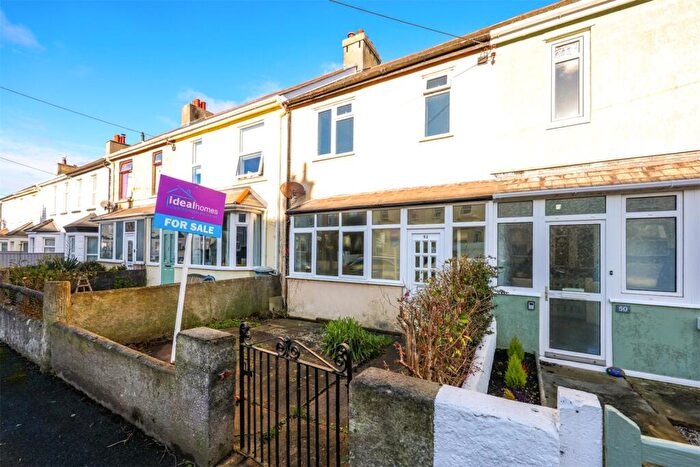
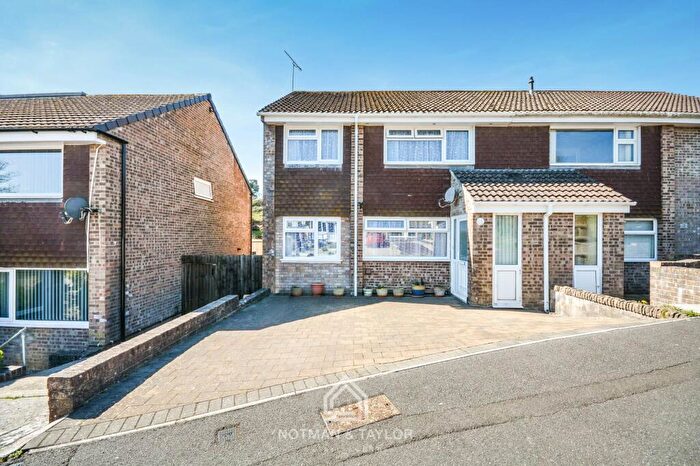
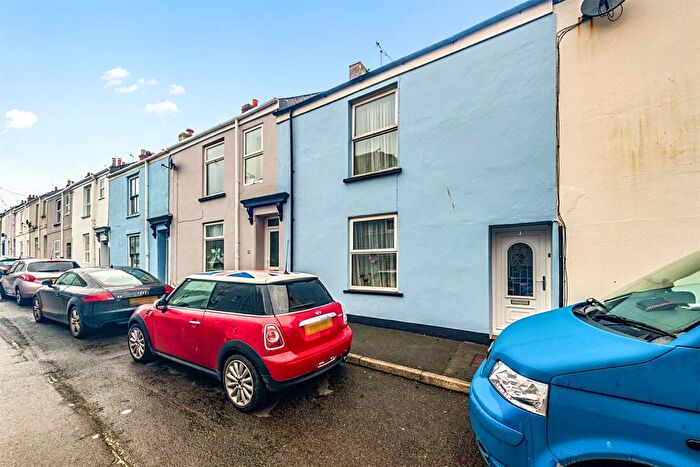
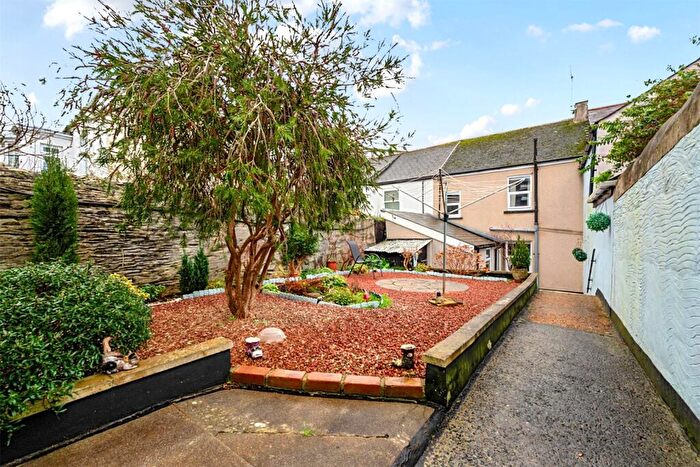
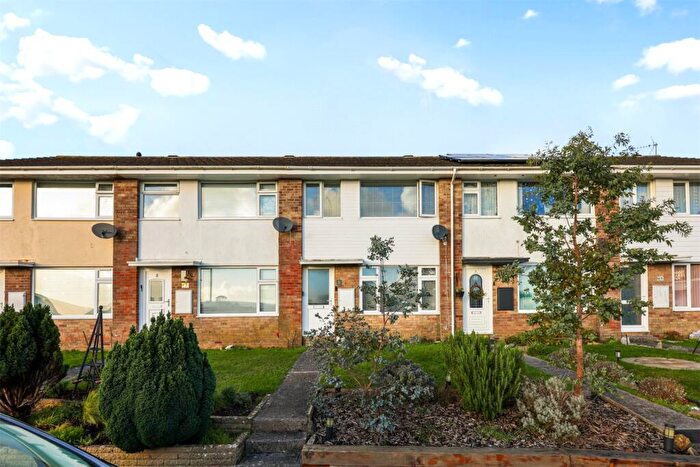
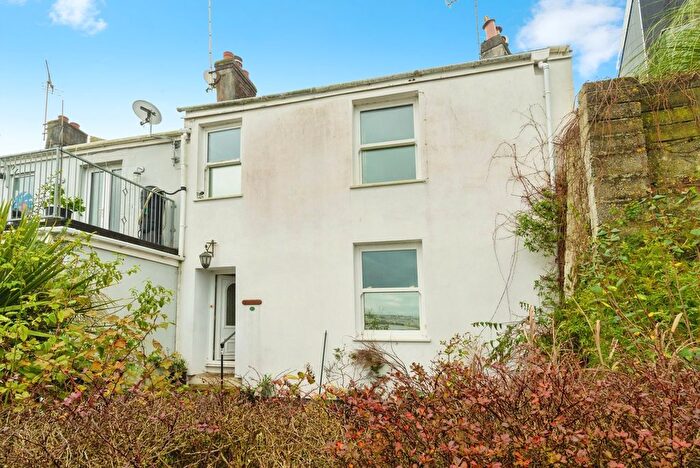
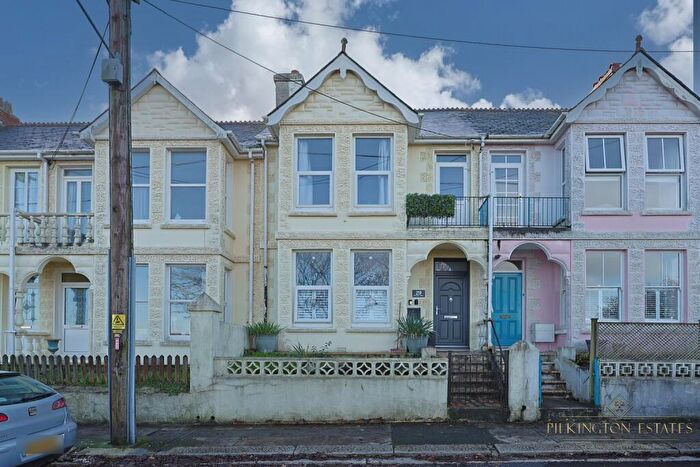
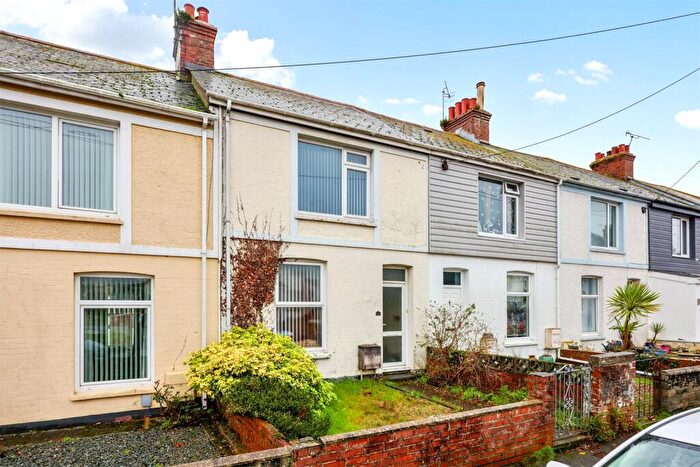
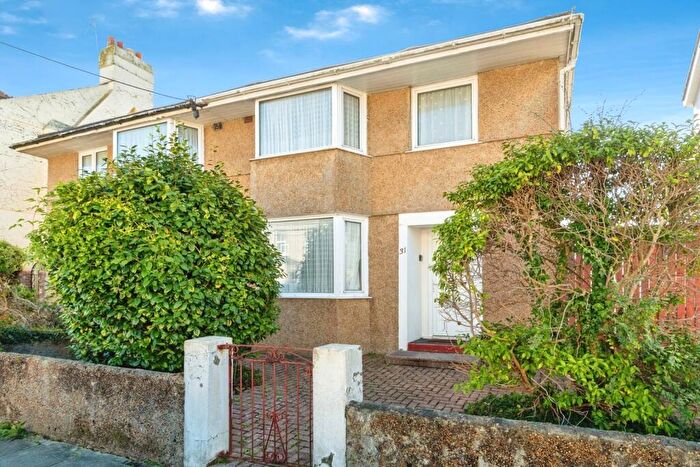
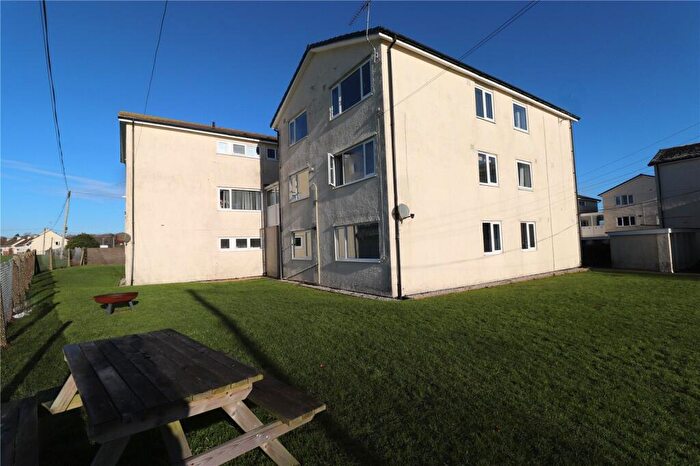
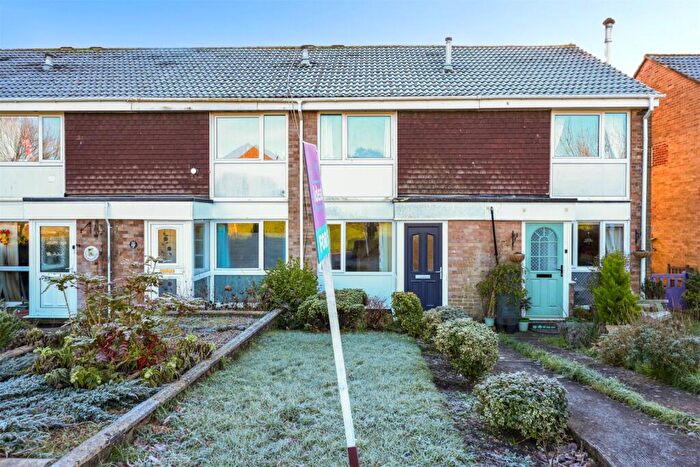
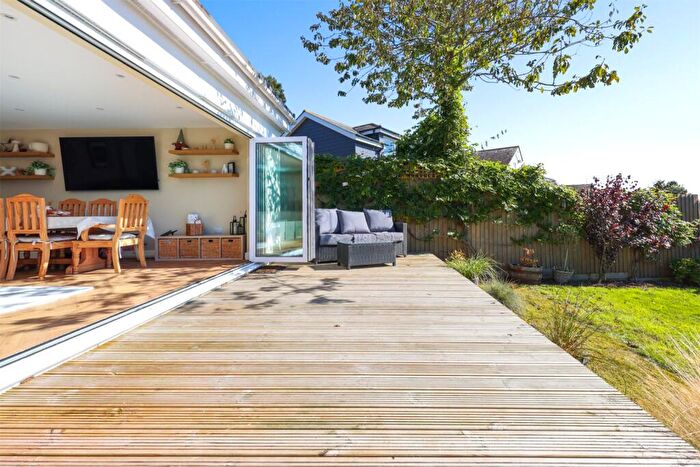
Properties for sale in Torpoint East
Roads and Postcodes in Torpoint East
Navigate through our locations to find the location of your next house in Torpoint East, Torpoint for sale or to rent.
| Streets | Postcodes |
|---|---|
| Adela Road | PL11 2JL |
| Albion Court | PL11 2BN |
| Albion Road | PL11 2LU |
| Antony Road | PL11 2JP PL11 2JR PL11 2JS PL11 2JT PL11 2JU PL11 2JW PL11 2JX PL11 2JY |
| Arthur Terrace | PL11 2BB |
| Barossa Place | PL11 2BT |
| Barossa Road | PL11 2BG |
| Belle Vue | PL11 2BA |
| Bickern Road | PL11 2LQ |
| Buller Close | PL11 2LF |
| Buller Road | PL11 2LD |
| Carbeile Road | PL11 2EA PL11 2EB PL11 2HP PL11 2HR PL11 2HS PL11 2NN |
| Carew Terrace | PL11 2EG PL11 2EQ |
| Carew Wharf Business Centre | PL11 2RF |
| Clarence Road | PL11 2LS PL11 2LT |
| Colwyn Road | PL11 2JA |
| Cremyll Road | PL11 2DX PL11 2DY PL11 2DZ |
| Devonshire Court | PL11 2RH |
| Elliot Square | PL11 2BS |
| Evenden Court | PL11 2QN |
| Ferry Street | PL11 2AX PL11 2AY PL11 2AZ |
| Fore Street | PL11 2AA PL11 2AB PL11 2AD PL11 2AF PL11 2AG |
| Gravesend | PL11 2LX |
| Gravesend Gardens | PL11 2HN |
| Hamoaze Road | PL11 2ED PL11 2EE PL11 2EF |
| Harvey Street | PL11 2BU |
| Jago Avenue | PL11 2HG |
| Kempton Terrace | PL11 2DQ |
| Khyber Close | PL11 2JB |
| King Street | PL11 2AT PL11 2AS |
| Kingsley Avenue | PL11 2HF |
| Liscawn Terrace | PL11 2ER |
| Macey Street | PL11 2AH PL11 2AJ PL11 2AL |
| Marine Drive | PL11 2EH PL11 2EN PL11 2FH PL11 2RB |
| Moor View | PL11 2LH |
| North Road | PL11 2DH PL11 2DJ PL11 2DL PL11 2DU |
| Park Road | PL11 2HD |
| Peacock Avenue | PL11 2ET PL11 2EU PL11 2EX PL11 2EY PL11 2EZ |
| Quarry Street | PL11 2AN PL11 2AP |
| Roberts Avenue | PL11 2HB |
| Roeselare Avenue | PL11 2LL PL11 2LN PL11 2LW |
| Roeselare Close | PL11 2LP |
| Rowe Street | PL11 2LA PL11 2DA |
| Salamanca Street | PL11 2BD PL11 2BE PL11 2DD |
| Sconner Road | PL11 2LJ |
| St James Court | PL11 2BP |
| St James Road | PL11 2BH PL11 2BL PL11 2BQ PL11 2BJ |
| Sydney Road | PL11 2LY PL11 2LZ |
| Tamar Street | PL11 2AW |
| Thanckes Close | PL11 2RA |
| Thanckes Drive | PL11 2JN |
| The Lawns | PL11 2QX |
| Trevol Road | PL11 2LR PL11 2NH PL11 2NJ |
| Vicarage Road | PL11 2BY PL11 2BW PL11 2EP |
| Victoria Street | PL11 2HE |
| Wellington Street | PL11 2DE PL11 2DF PL11 2DG |
| Wesley Court | PL11 2AR |
| Windsor Terrace | PL11 2AU |
| York Road | PL11 2LG |
| PL11 2ES PL11 2HA PL11 2JH |
Transport near Torpoint East
-
Dockyard Station
-
Devonport Station
-
Keyham Station
-
St.Budeaux Ferry Road Station
-
St.Budeaux Victoria Road Station
-
Saltash Station
-
Plymouth Station
- FAQ
- Price Paid By Year
- Property Type Price
Frequently asked questions about Torpoint East
What is the average price for a property for sale in Torpoint East?
The average price for a property for sale in Torpoint East is £216,154. This amount is 30% lower than the average price in Torpoint. There are 243 property listings for sale in Torpoint East.
What streets have the most expensive properties for sale in Torpoint East?
The streets with the most expensive properties for sale in Torpoint East are Albion Road at an average of £568,500, Gravesend Gardens at an average of £550,000 and Gravesend at an average of £504,833.
What streets have the most affordable properties for sale in Torpoint East?
The streets with the most affordable properties for sale in Torpoint East are Harvey Street at an average of £89,875, Fore Street at an average of £96,500 and King Street at an average of £108,000.
Which train stations are available in or near Torpoint East?
Some of the train stations available in or near Torpoint East are Dockyard, Devonport and Keyham.
Property Price Paid in Torpoint East by Year
The average sold property price by year was:
| Year | Average Sold Price | Price Change |
Sold Properties
|
|---|---|---|---|
| 2025 | £234,151 | 11% |
43 Properties |
| 2024 | £208,899 | -1% |
76 Properties |
| 2023 | £211,520 | 5% |
48 Properties |
| 2022 | £201,103 | -0,1% |
54 Properties |
| 2021 | £201,265 | 16% |
60 Properties |
| 2020 | £169,200 | 11% |
52 Properties |
| 2019 | £150,073 | -10% |
61 Properties |
| 2018 | £164,780 | 2% |
52 Properties |
| 2017 | £160,837 | -1% |
67 Properties |
| 2016 | £161,967 | 6% |
46 Properties |
| 2015 | £151,450 | -1% |
72 Properties |
| 2014 | £153,512 | 6% |
60 Properties |
| 2013 | £144,030 | 1% |
47 Properties |
| 2012 | £143,257 | -3% |
37 Properties |
| 2011 | £147,721 | -37% |
51 Properties |
| 2010 | £202,965 | 23% |
36 Properties |
| 2009 | £156,084 | 7% |
42 Properties |
| 2008 | £145,588 | -9% |
31 Properties |
| 2007 | £158,953 | 5% |
86 Properties |
| 2006 | £151,537 | -0,5% |
104 Properties |
| 2005 | £152,224 | 18% |
68 Properties |
| 2004 | £124,074 | 17% |
87 Properties |
| 2003 | £103,097 | 20% |
77 Properties |
| 2002 | £82,498 | 24% |
103 Properties |
| 2001 | £62,857 | 7% |
67 Properties |
| 2000 | £58,386 | 2% |
64 Properties |
| 1999 | £57,445 | 7% |
62 Properties |
| 1998 | £53,675 | 2% |
65 Properties |
| 1997 | £52,743 | 20% |
75 Properties |
| 1996 | £42,380 | -14% |
55 Properties |
| 1995 | £48,115 | - |
40 Properties |
Property Price per Property Type in Torpoint East
Here you can find historic sold price data in order to help with your property search.
The average Property Paid Price for specific property types in the last three years are:
| Property Type | Average Sold Price | Sold Properties |
|---|---|---|
| Semi Detached House | £259,093.00 | 32 Semi Detached Houses |
| Detached House | £323,222.00 | 18 Detached Houses |
| Terraced House | £206,649.00 | 89 Terraced Houses |
| Flat | £128,464.00 | 28 Flats |

