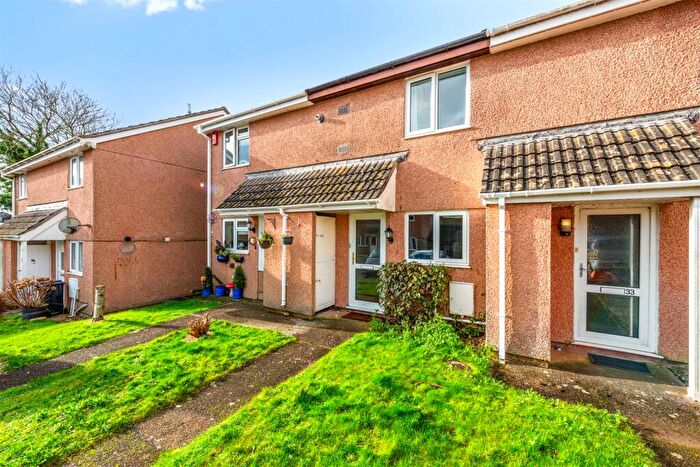
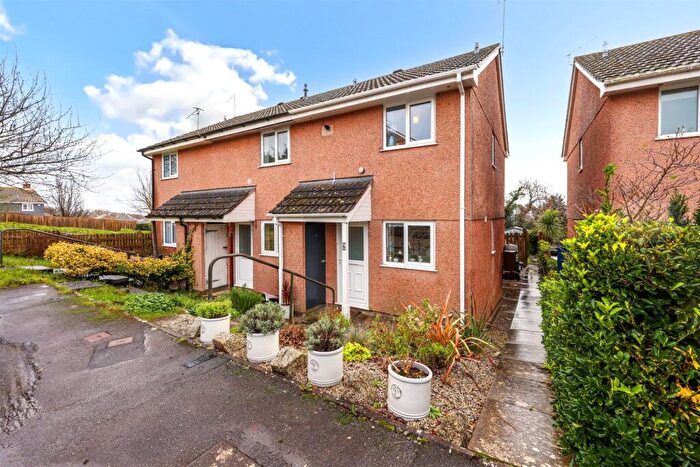
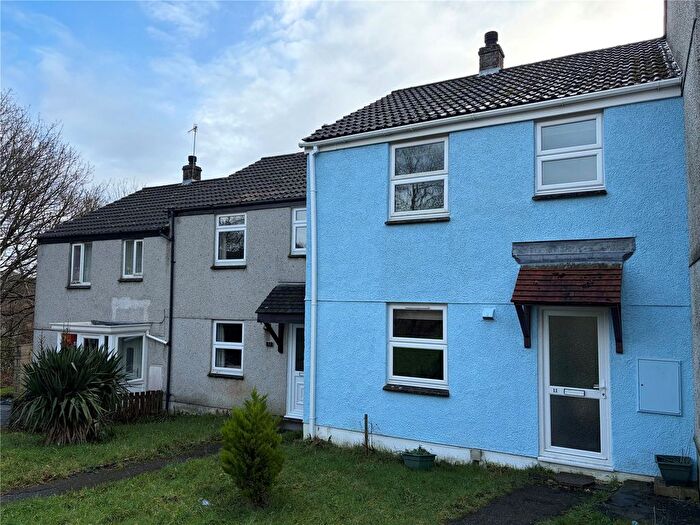
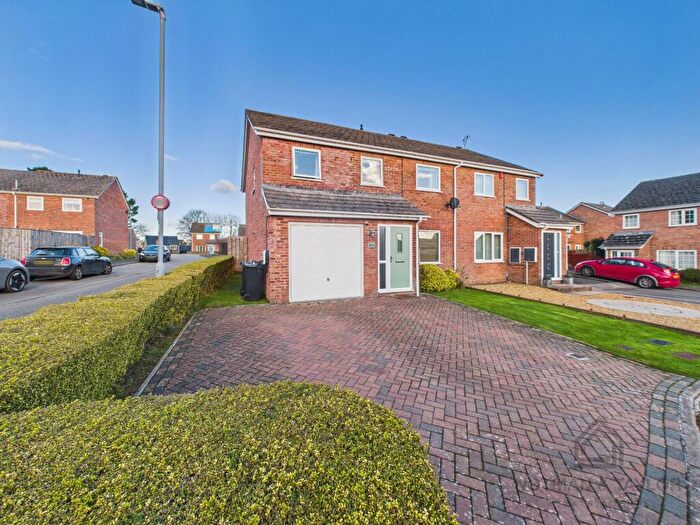
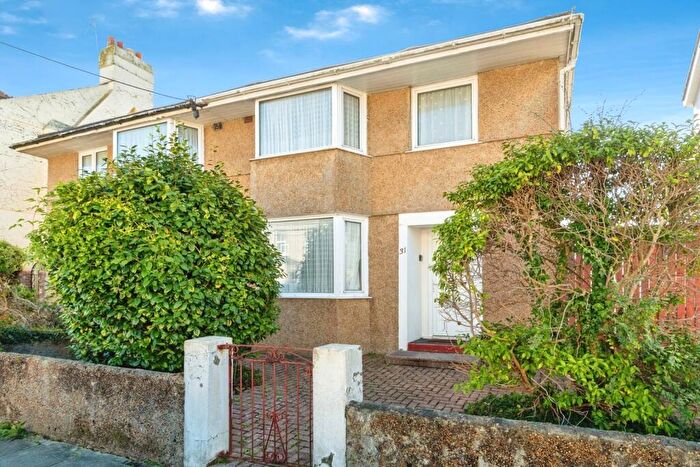
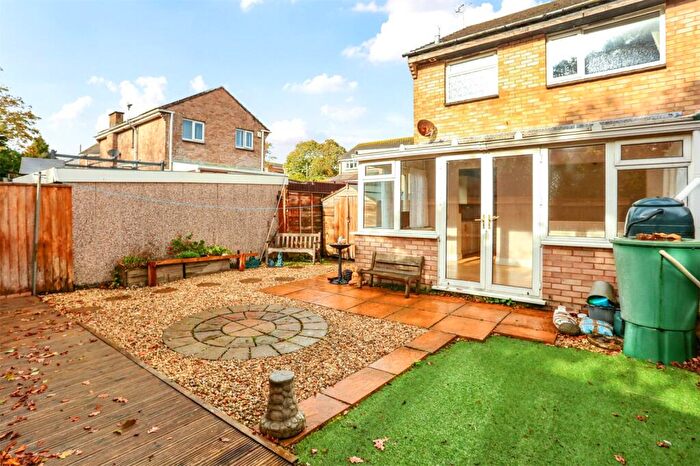
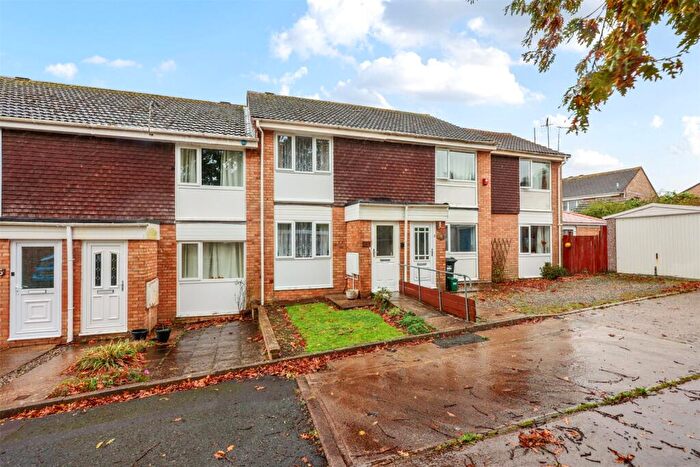
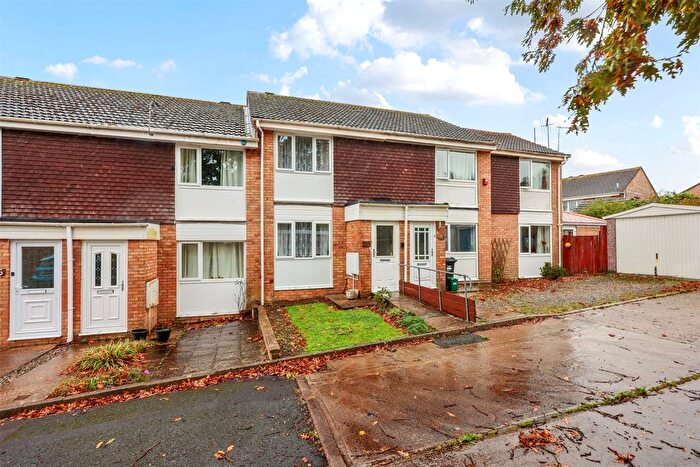
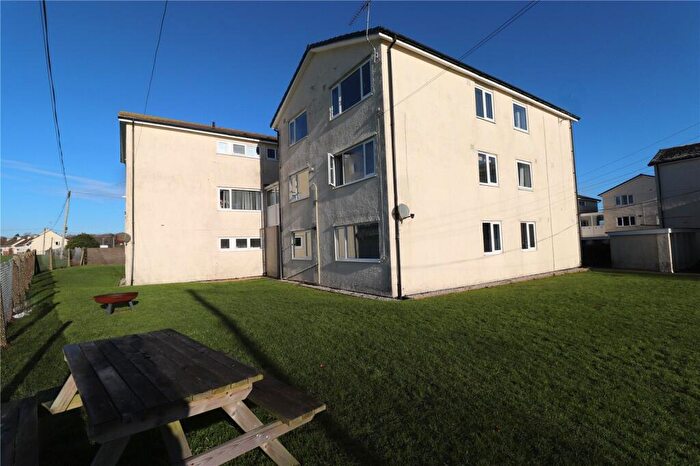
Houses for sale & to rent in Torpoint West, Torpoint
House Prices in Torpoint West
Properties in Torpoint West have an average house price of £218,932.00 and had 165 Property Transactions within the last 3 years¹.
Torpoint West is an area in Torpoint, Cornwall with 1,671 households², where the most expensive property was sold for £485,000.00.
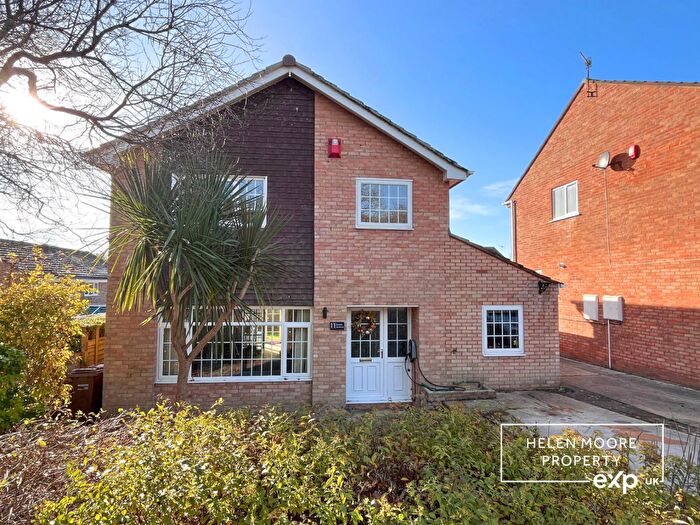
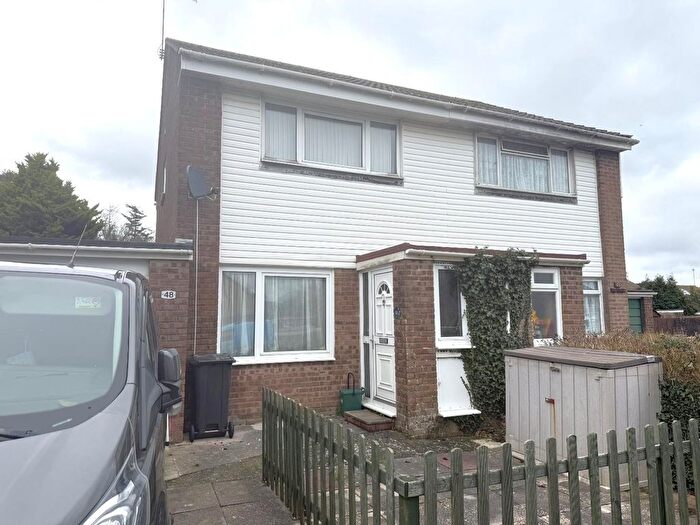
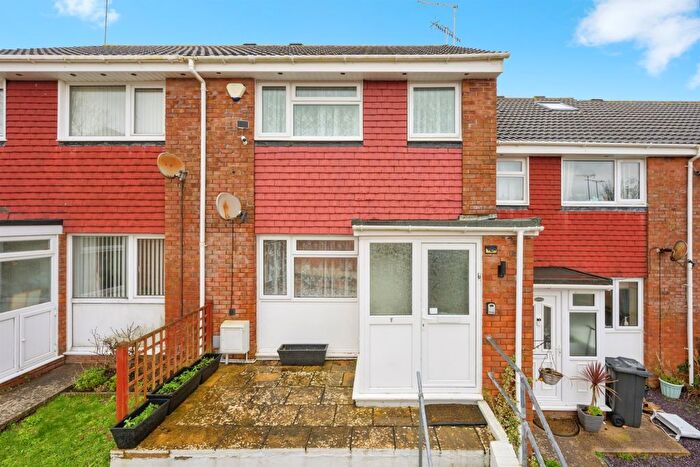
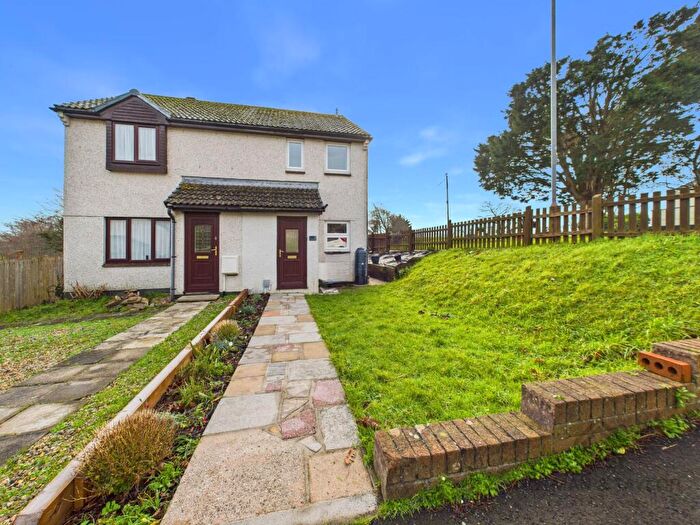
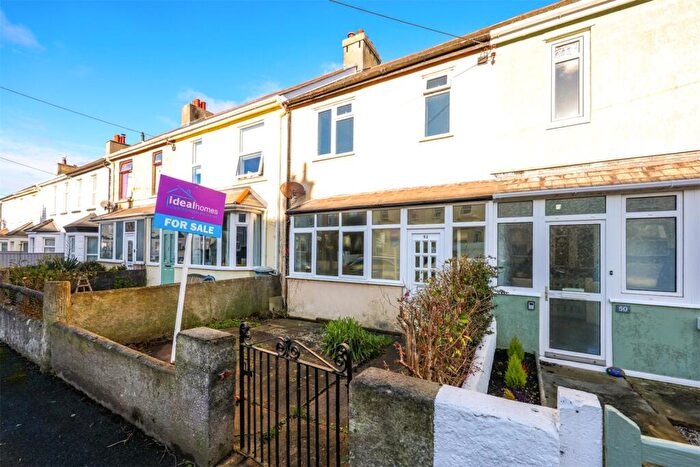
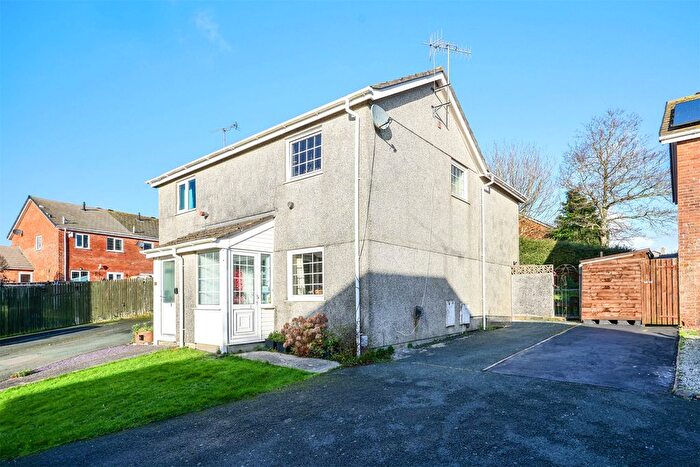
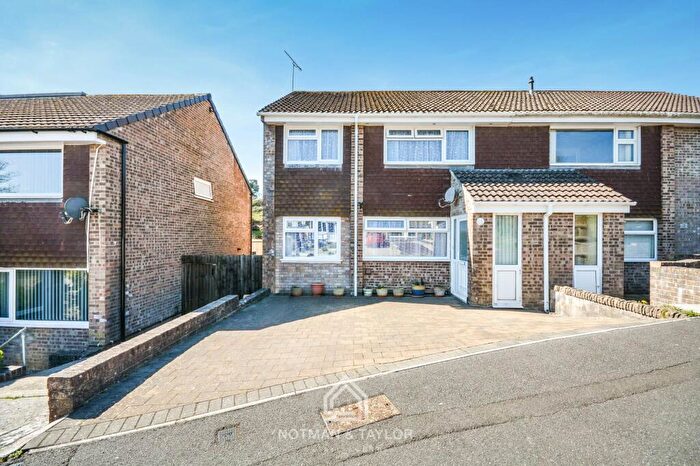
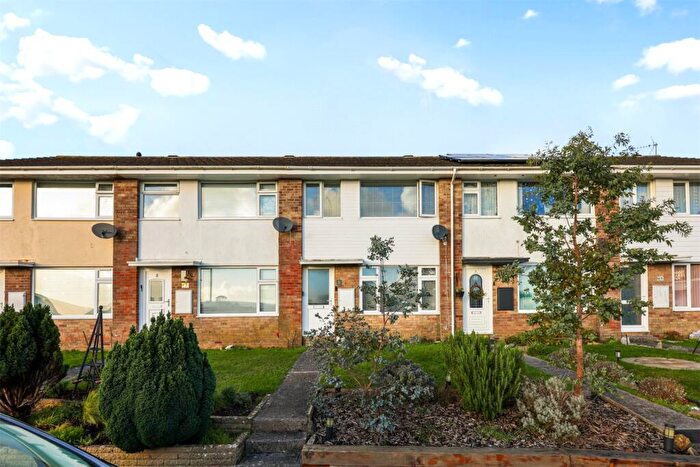
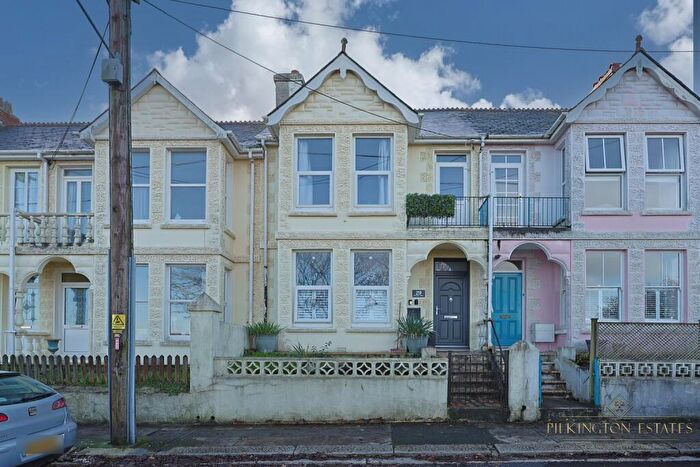
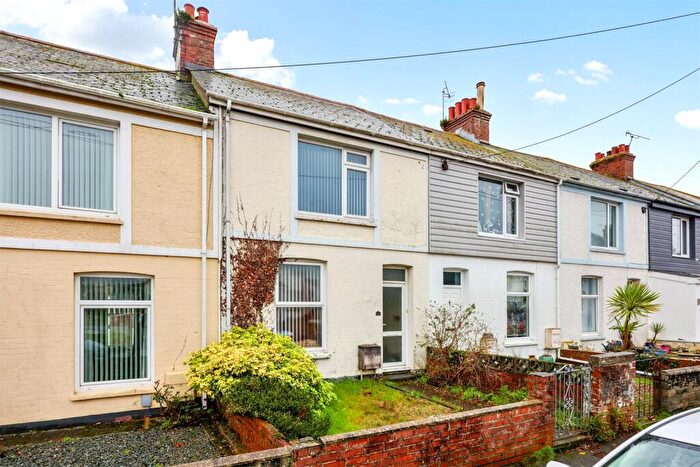
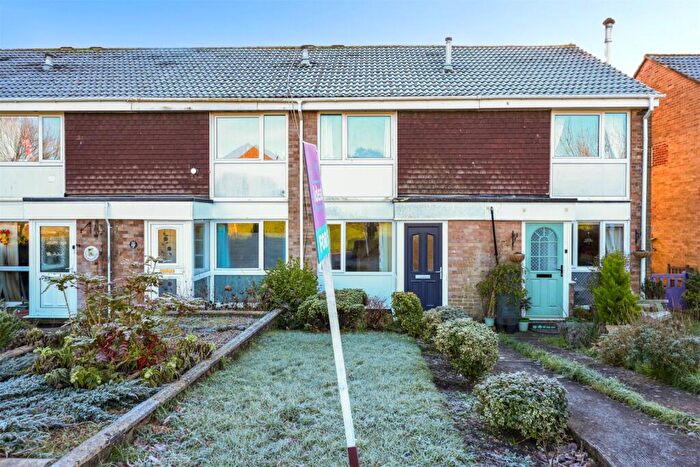
Properties for sale in Torpoint West
Roads and Postcodes in Torpoint West
Navigate through our locations to find the location of your next house in Torpoint West, Torpoint for sale or to rent.
| Streets | Postcodes |
|---|---|
| Adams Close | PL11 2DB |
| Adams Crescent | PL11 2DP |
| Beech Close | PL11 2NF |
| Borough Court | PL11 2QW |
| Borough Park | PL11 2PY |
| Carlyon Close | PL11 2QU |
| Cedar Close | PL11 2QH |
| Cedar Drive | PL11 2QQ |
| Chapeldown Road | PL11 2HT PL11 2HU |
| Chestnut Close | PL11 2NB |
| Clegg Avenue | PL11 2DR |
| Davy Close | PL11 2NQ |
| Fistral Close | PL11 2QT |
| Goad Avenue | PL11 2ND |
| Goad Close | PL11 2DS |
| Grove Park | PL11 2PP |
| Gurney Close | PL11 2PU |
| Gwithian Close | PL11 2QR |
| Hawthorn Avenue | PL11 2NG |
| Ince Close | PL11 2JQ |
| Kernow Close | PL11 2HQ |
| Kynance Close | PL11 2QP |
| Lamorna Park | PL11 2QJ |
| Langdon Down Way | PL11 2HH |
| Maker Road | PL11 2HY PL11 2HZ |
| Maple Avenue | PL11 2NE |
| Mill Lane | PL11 2RE |
| Millhouse Park | PL11 2JD |
| Mullion Close | PL11 2QS |
| Murdock Road | PL11 2DT |
| Pencair Avenue | PL11 2NY |
| Pendennis Close | PL11 2QY |
| Pendilly Avenue | PL11 2NU |
| Penlee Park | PL11 2PZ |
| Pentire Road | PL11 2QZ |
| Primrose Close | PL11 2JF |
| Sango Road | PL11 2HX |
| Sennen Close | PL11 2JJ |
| Sycamore Drive | PL11 2NA |
| The Meadows | PL11 2LB |
| Tregoning Road | PL11 2NX |
| Trelawney Close | PL11 2QF |
| Trelawney Rise | PL11 2HW |
| Trelawney Way | PL11 2QG |
| Trematon Close | PL11 2JG |
| Trengrouse Avenue | PL11 2DN |
| Trevithick Avenue | PL11 2PX |
| Trevol Business Park | PL11 2TB |
| Trevol Place | PL11 2NZ |
| Trevol Road | PL11 2NL |
| Trevorder Close | PL11 2NT |
| Trevorder Road | PL11 2NS |
| Trevorder Villas | PL11 2NR |
| Wavish Park | PL11 2HJ |
| Westlake Close | PL11 2BZ |
| Woodland Way | PL11 2DW PL11 2TQ |
| PL10 1ZW PL11 2PA PL11 2PD PL11 2WW PL11 2YR PL11 3YS |
Transport near Torpoint West
-
Dockyard Station
-
Keyham Station
-
Devonport Station
-
St.Budeaux Ferry Road Station
-
St.Budeaux Victoria Road Station
-
Saltash Station
- FAQ
- Price Paid By Year
- Property Type Price
Frequently asked questions about Torpoint West
What is the average price for a property for sale in Torpoint West?
The average price for a property for sale in Torpoint West is £218,932. This amount is 30% lower than the average price in Torpoint. There are 204 property listings for sale in Torpoint West.
What streets have the most expensive properties for sale in Torpoint West?
The streets with the most expensive properties for sale in Torpoint West are Borough Court at an average of £395,000, Lamorna Park at an average of £338,700 and Chapeldown Road at an average of £311,250.
What streets have the most affordable properties for sale in Torpoint West?
The streets with the most affordable properties for sale in Torpoint West are Kernow Close at an average of £102,500, Clegg Avenue at an average of £117,500 and Trelawney Way at an average of £134,000.
Which train stations are available in or near Torpoint West?
Some of the train stations available in or near Torpoint West are Dockyard, Keyham and Devonport.
Property Price Paid in Torpoint West by Year
The average sold property price by year was:
| Year | Average Sold Price | Price Change |
Sold Properties
|
|---|---|---|---|
| 2025 | £223,357 | 5% |
42 Properties |
| 2024 | £212,102 | -6% |
72 Properties |
| 2023 | £224,931 | 3% |
51 Properties |
| 2022 | £217,470 | 8% |
74 Properties |
| 2021 | £199,581 | 10% |
61 Properties |
| 2020 | £180,023 | -4% |
59 Properties |
| 2019 | £187,189 | 10% |
71 Properties |
| 2018 | £168,590 | 0,4% |
66 Properties |
| 2017 | £167,841 | 10% |
63 Properties |
| 2016 | £150,278 | -5% |
84 Properties |
| 2015 | £157,648 | -1% |
65 Properties |
| 2014 | £158,830 | -1% |
74 Properties |
| 2013 | £160,061 | 5% |
55 Properties |
| 2012 | £152,611 | 1% |
42 Properties |
| 2011 | £151,829 | 0,1% |
44 Properties |
| 2010 | £151,635 | -7% |
55 Properties |
| 2009 | £162,840 | 5% |
43 Properties |
| 2008 | £155,454 | -3% |
35 Properties |
| 2007 | £159,529 | 7% |
84 Properties |
| 2006 | £147,736 | 12% |
116 Properties |
| 2005 | £129,794 | 7% |
99 Properties |
| 2004 | £121,310 | 16% |
118 Properties |
| 2003 | £101,680 | 25% |
86 Properties |
| 2002 | £76,041 | 12% |
147 Properties |
| 2001 | £67,274 | 17% |
113 Properties |
| 2000 | £55,881 | 5% |
124 Properties |
| 1999 | £52,887 | -2% |
124 Properties |
| 1998 | £53,938 | 5% |
118 Properties |
| 1997 | £51,072 | 4% |
111 Properties |
| 1996 | £48,854 | 3% |
96 Properties |
| 1995 | £47,556 | - |
79 Properties |
Property Price per Property Type in Torpoint West
Here you can find historic sold price data in order to help with your property search.
The average Property Paid Price for specific property types in the last three years are:
| Property Type | Average Sold Price | Sold Properties |
|---|---|---|
| Semi Detached House | £235,628.00 | 76 Semi Detached Houses |
| Detached House | £299,400.00 | 25 Detached Houses |
| Terraced House | £189,728.00 | 46 Terraced Houses |
| Flat | £111,308.00 | 18 Flats |

