
Houses for sale & to rent in TR2 4EN, Morrab Terrace, Ladock, St Clement And St Erme, Truro
House Prices in TR2 4EN, Morrab Terrace, Ladock, St Clement And St Erme
Properties in TR2 4EN have an average house price of £290k and had 1 Property Transaction within the last 3 years.¹ TR2 4EN is a postcode in Morrab Terrace located in Ladock, St Clement And St Erme, an area in Truro, Cornwall, with 1 household², where the most expensive property was sold for £290k.
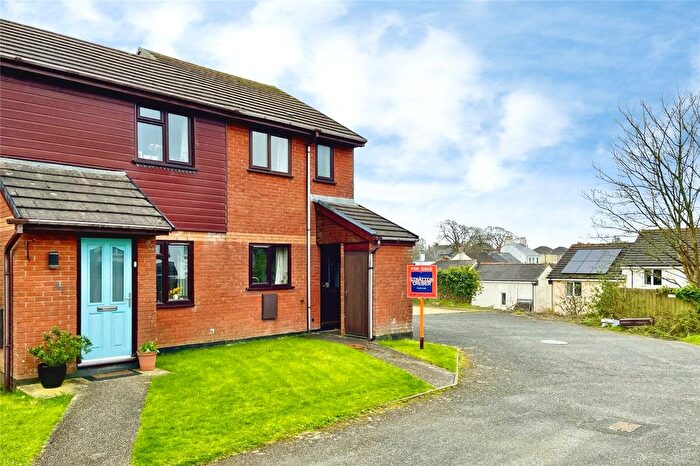
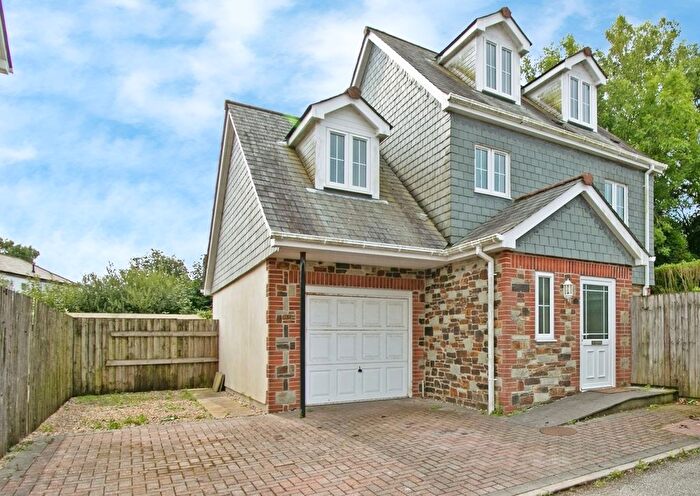
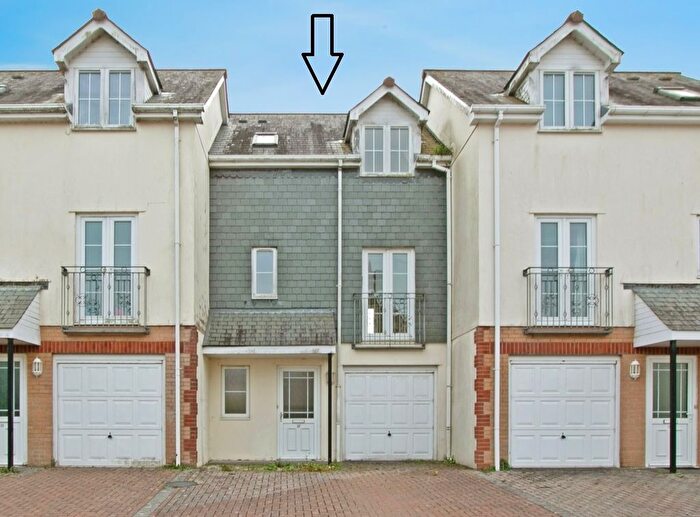
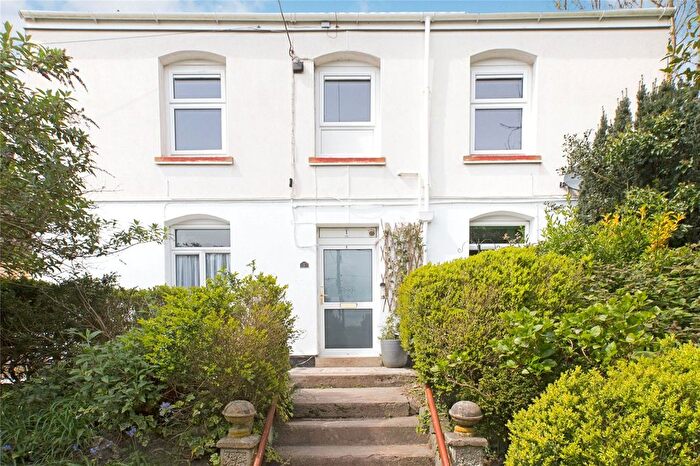
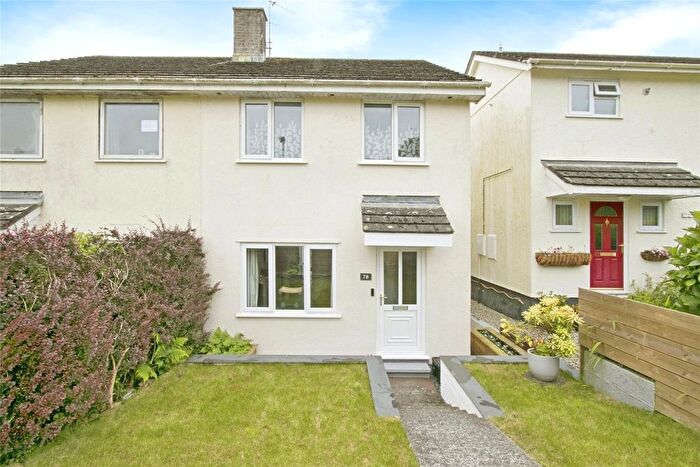
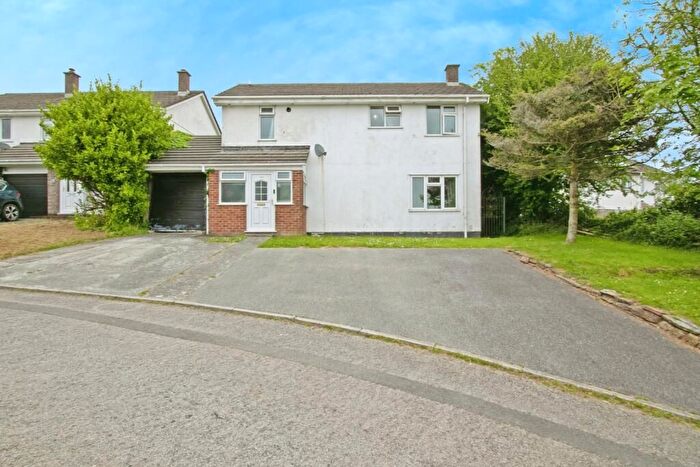
Properties for sale near TR2 4EN, Morrab Terrace
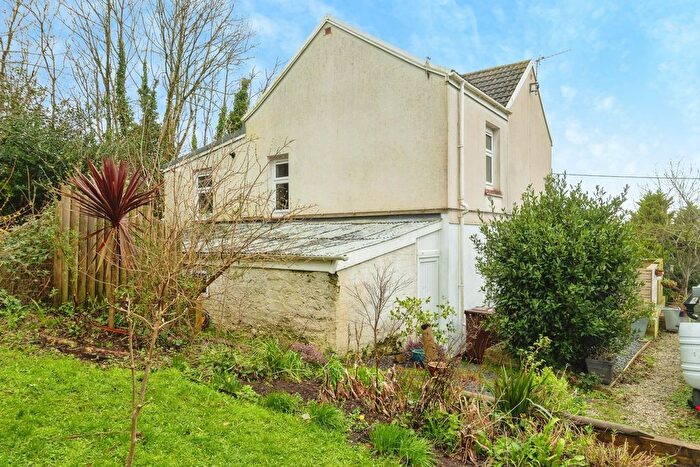
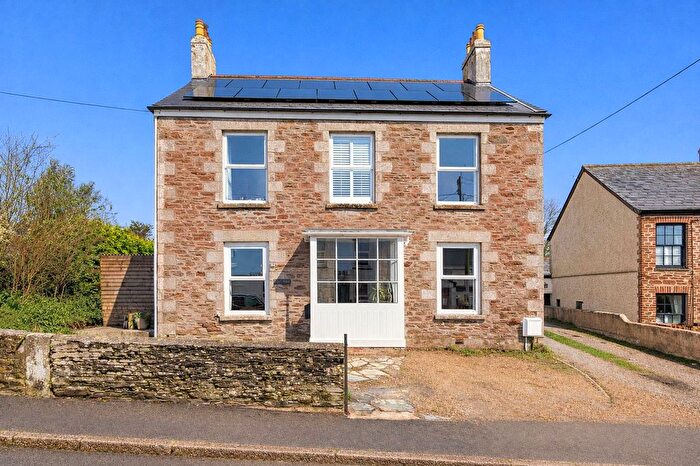
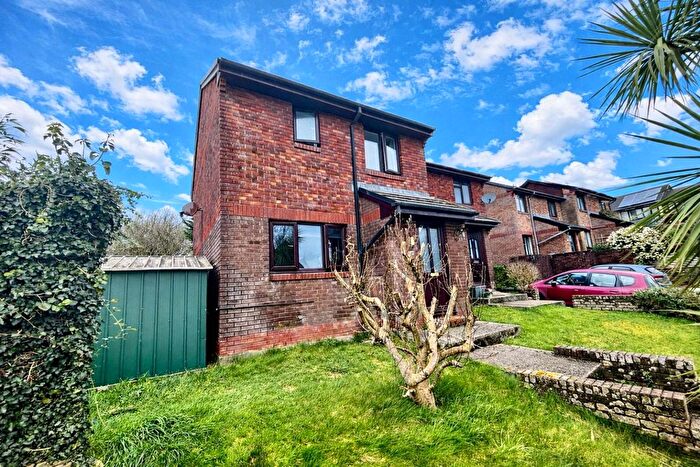
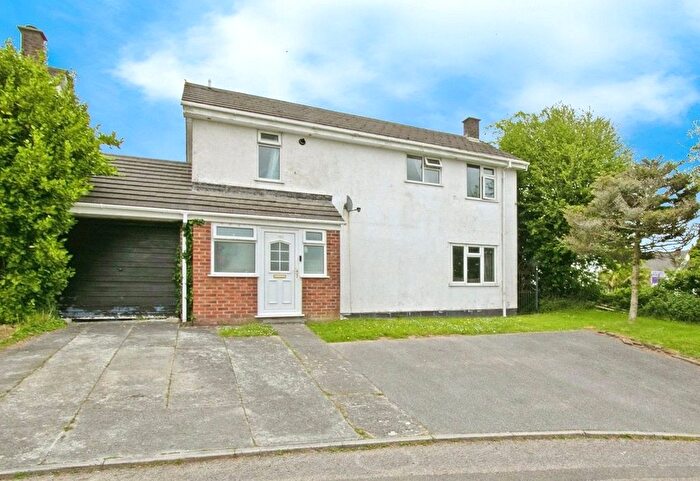
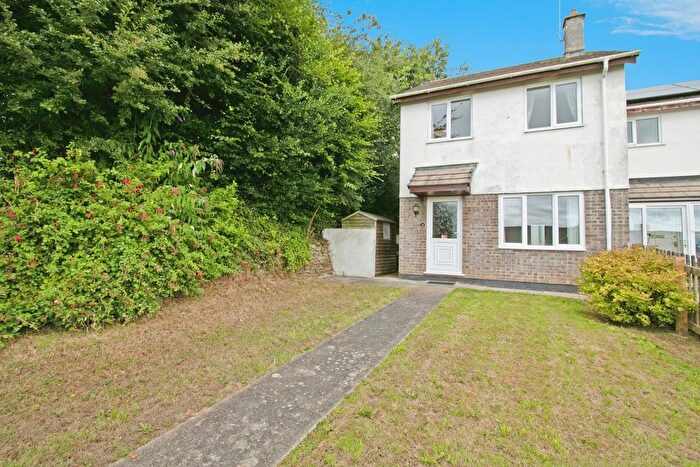
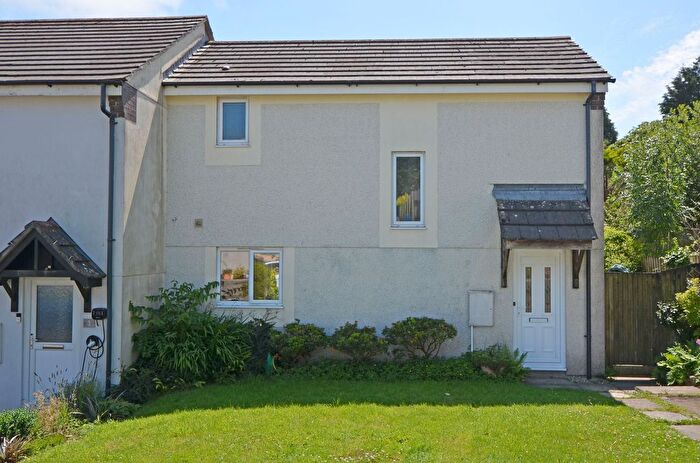
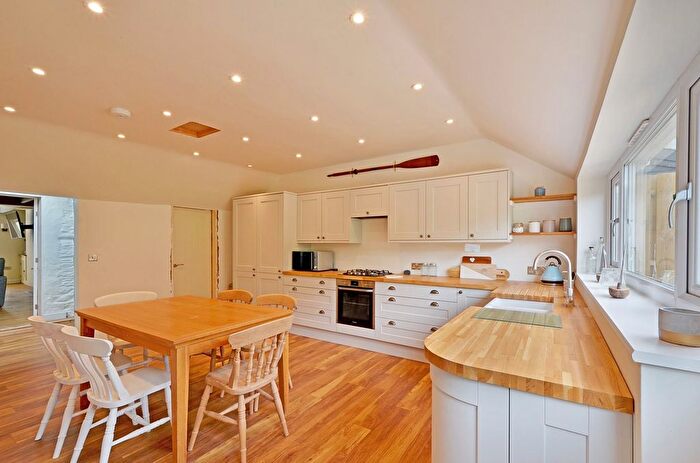
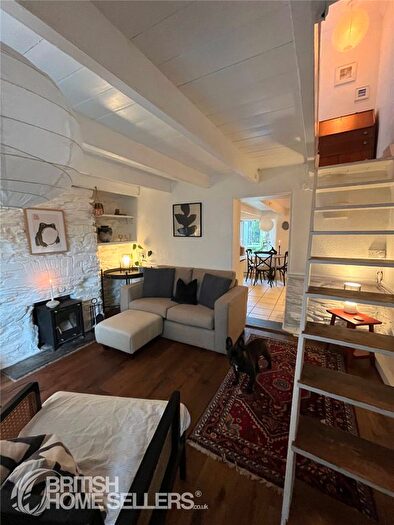
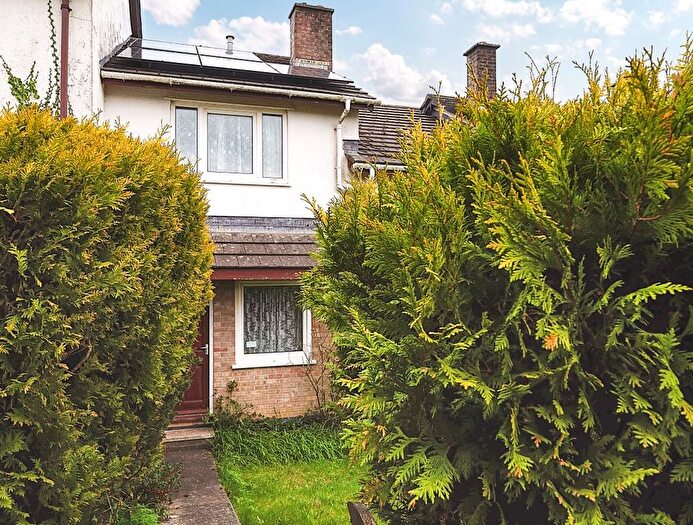
Previously listed properties near TR2 4EN, Morrab Terrace
![]()
If you are looking to sell your house, let it out, or receive a property valuation, an expert can help you.
Click the button below to get started.

Price Paid in Morrab Terrace, TR2 4EN, Ladock, St Clement And St Erme
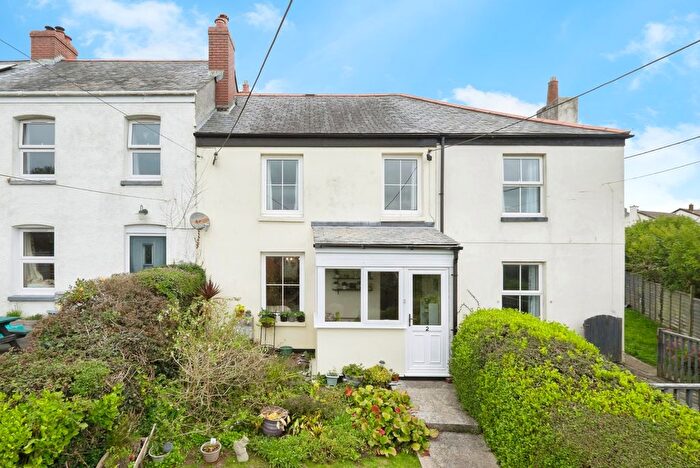
2 Morrab Terrace, TR2 4EN, Ladock, St Clement And St Erme Truro
Property 2 has been sold 3 times. The last time it was sold was in 18/09/2025 and the sold price was £290,000.00.
This terraced house, sold as a freehold on 18/09/2025, is a 90 sqm mid-terrace house with an EPC rating of C.
| Date | Price | Property Type | Tenure | Classification |
|---|---|---|---|---|
| 18/09/2025 | £290,000.00 | Terraced House | freehold | Established Building |
| 27/09/2021 | £250,000.00 | Terraced House | freehold | Established Building |
| 29/04/2016 | £142,500.00 | Terraced House | freehold | Established Building |
1 Morrab Terrace, TR2 4EN, Ladock, St Clement And St Erme Truro
Property 1 has been sold 2 times. The last time it was sold was in 17/05/2016 and the sold price was £160,000.00.
This terraced house, sold as a freehold on 17/05/2016, is a 95 sqm end-terrace house with an EPC rating of E.
| Date | Price | Property Type | Tenure | Classification |
|---|---|---|---|---|
| 17/05/2016 | £160,000.00 | Terraced House | freehold | Established Building |
| 17/03/2008 | £160,000.00 | Terraced House | freehold | Established Building |
Transport near TR2 4EN, Morrab Terrace
-
 St.Columb Road Station
 -
St.Austell Station
-
Truro Station
-
Quintrell Downs Station
-
Roche Station
-
Bugle Station
-
Newquay Station
-
Luxulyan Station
House price paid reports for TR2 4EN, Morrab Terrace
Click on the buttons below to see price paid reports by year or property price:
- Price Paid By Year
- Property Type Price
Property Price Paid in TR2 4EN, Morrab Terrace by Year
The average sold property price by year was:
| Year | Average Sold Price | Price Change |
Sold Properties
|
|---|---|---|---|
| 2025 | £290,000 | 14% |
1 Property |
| 2021 | £250,000 | 40% |
1 Property |
| 2016 | £151,250 | -6% |
2 Properties |
| 2008 | £160,000 | - |
1 Property |
Property Price per Property Type in TR2 4EN, Morrab Terrace
Here you can find historic sold price data in order to help with your property search.
The average Property Paid Price for specific property types in the last three years are:
| Property Type | Average Sold Price | Sold Properties |
|---|---|---|
| Terraced House | £290,000.00 | 1 Terraced House |