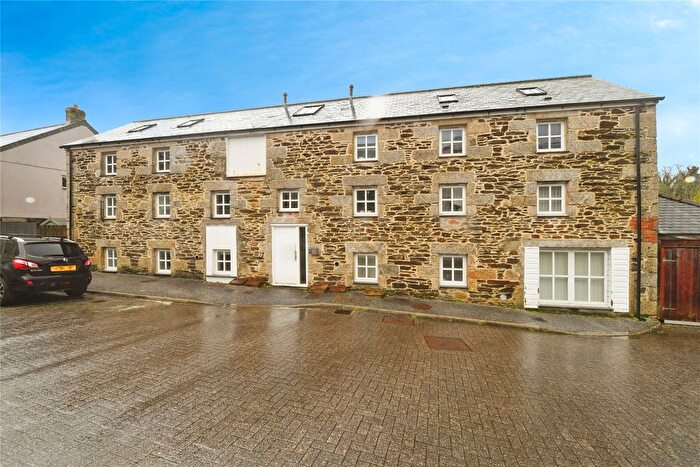
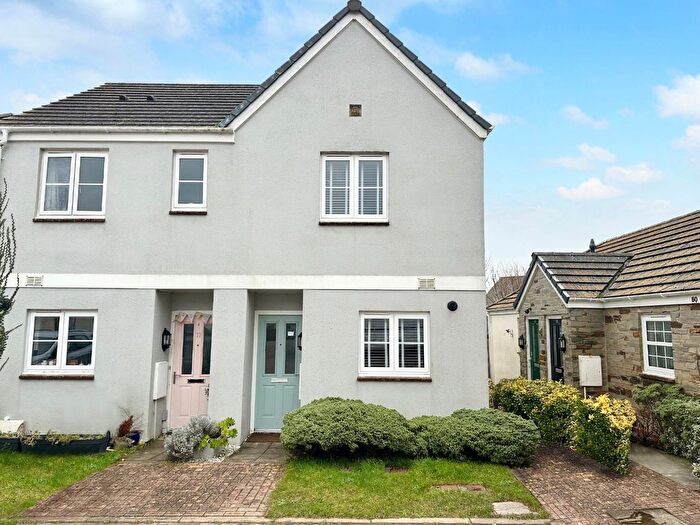
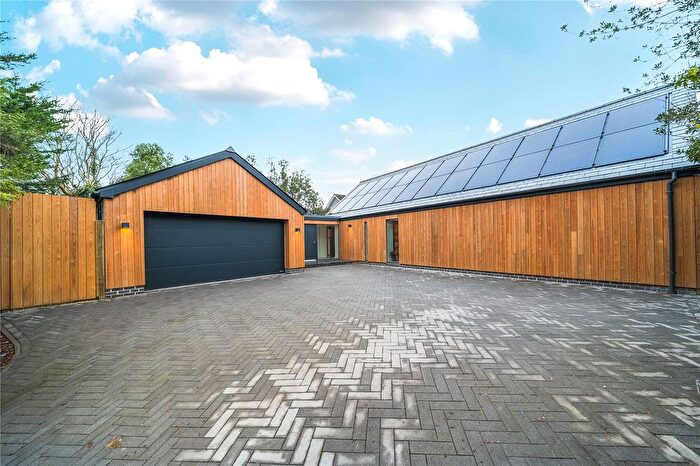
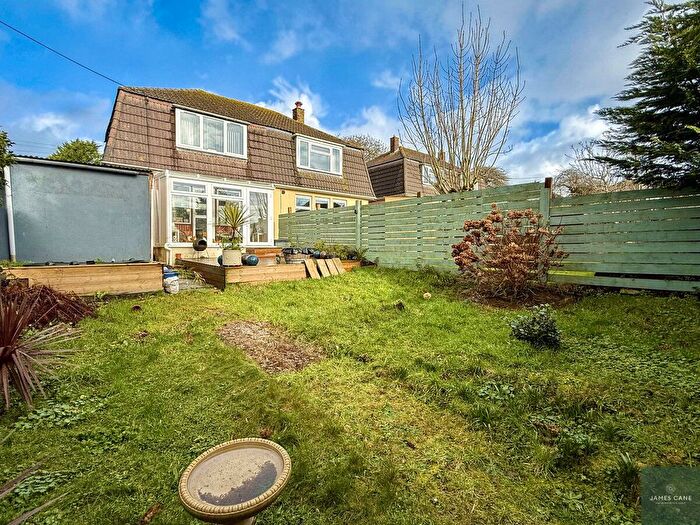
Houses for sale & to rent in Truro, Cornwall
House Prices in Truro
Properties in Truro have an average house price of £399,131.00 and had 2,265 Property Transactions within the last 3 years.¹
Truro is an area in Cornwall with 23,539 households², where the most expensive property was sold for £5,250,000.00.
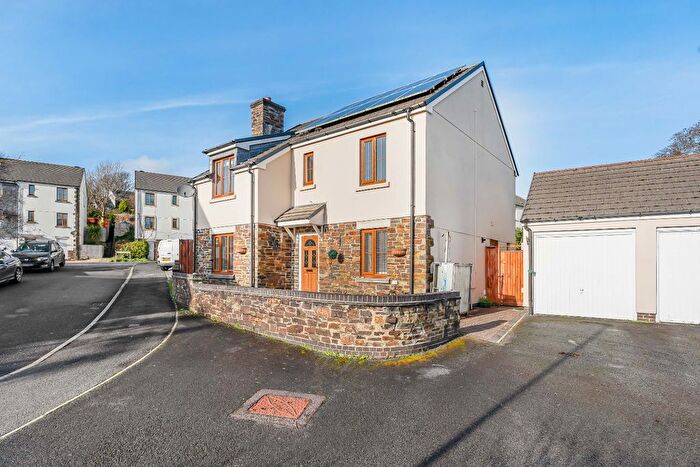
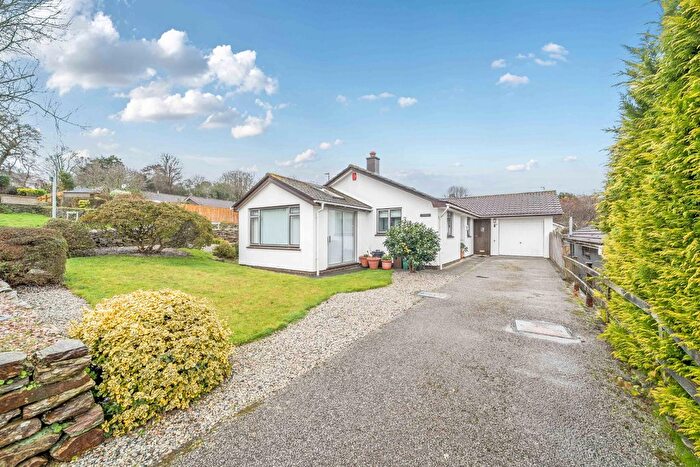
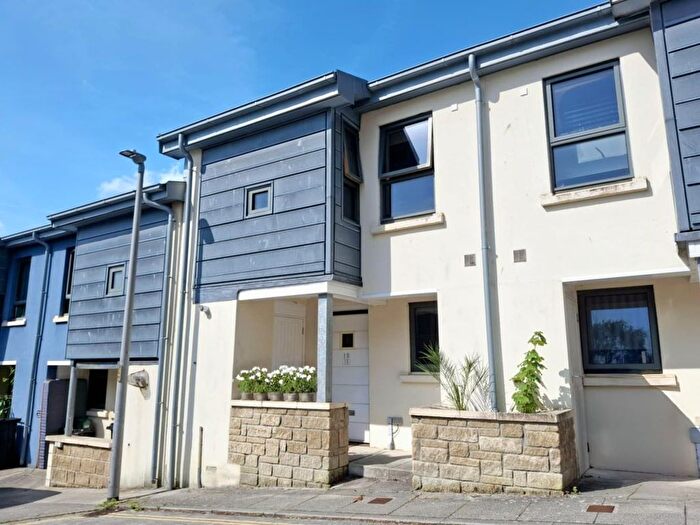
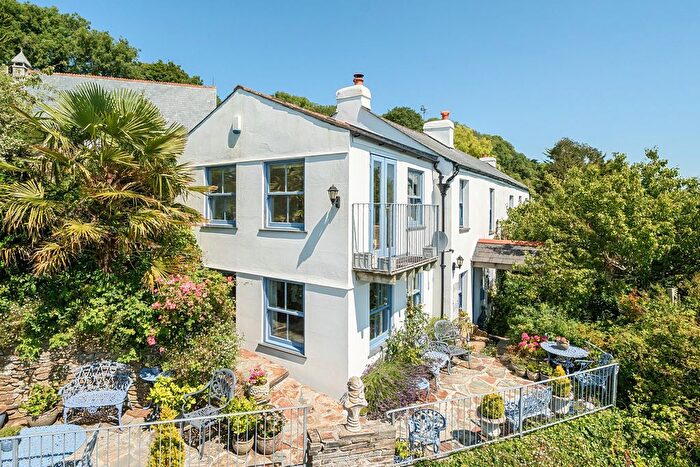
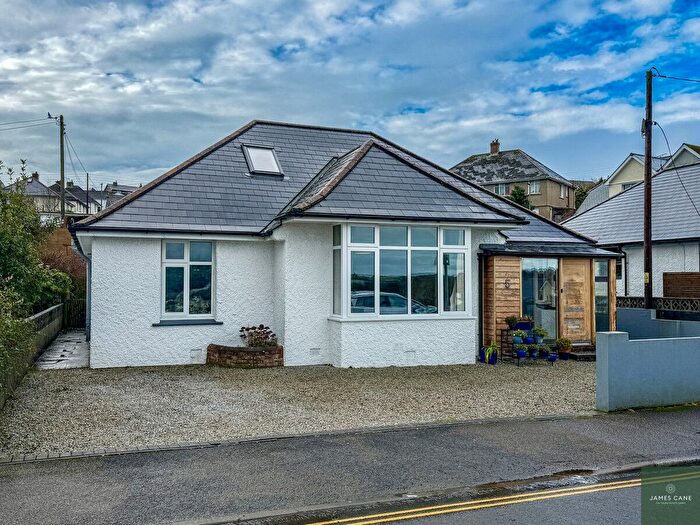
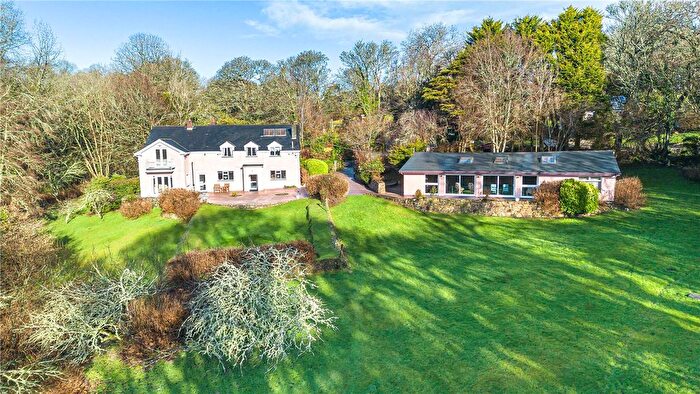
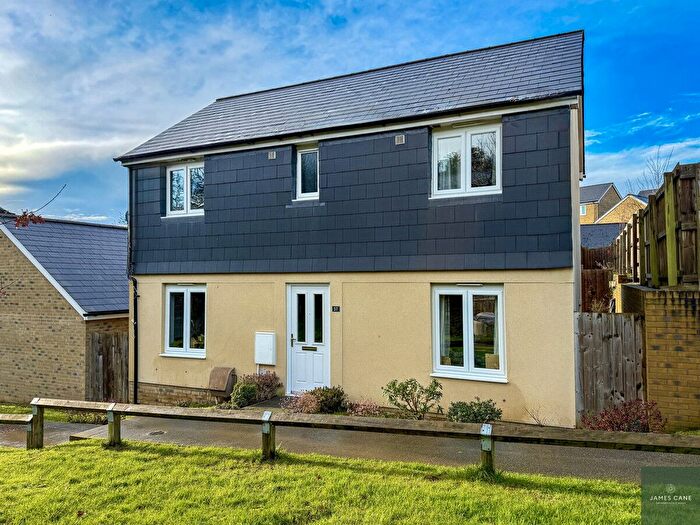
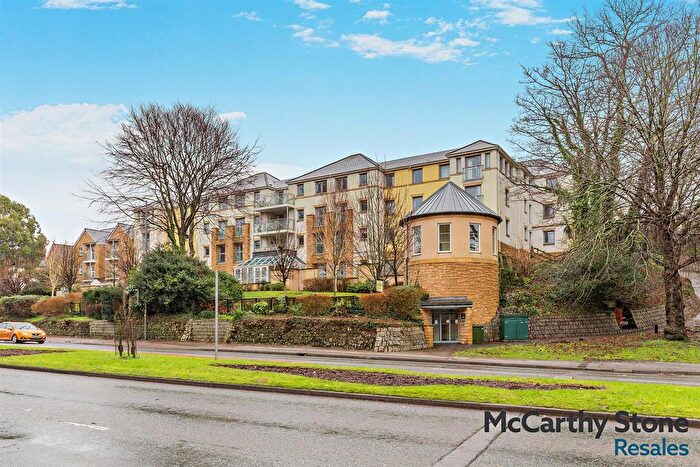
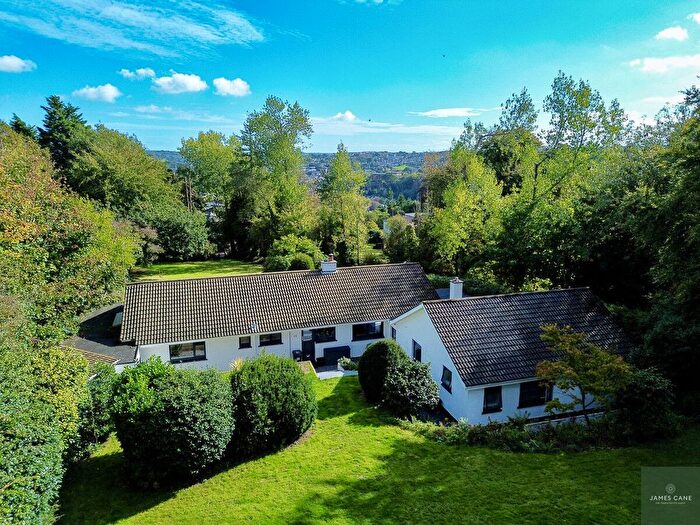
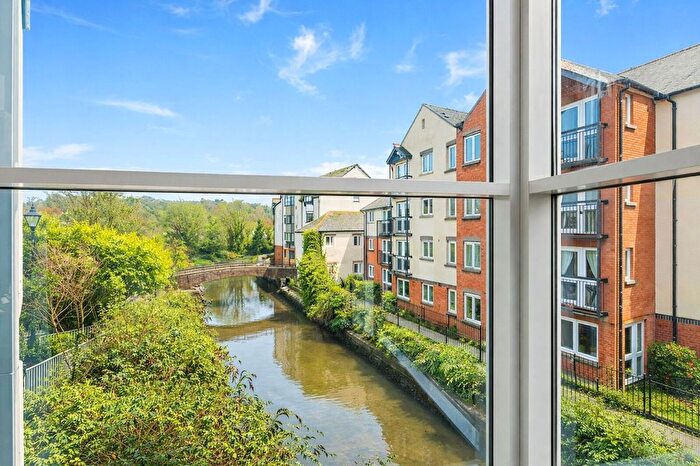
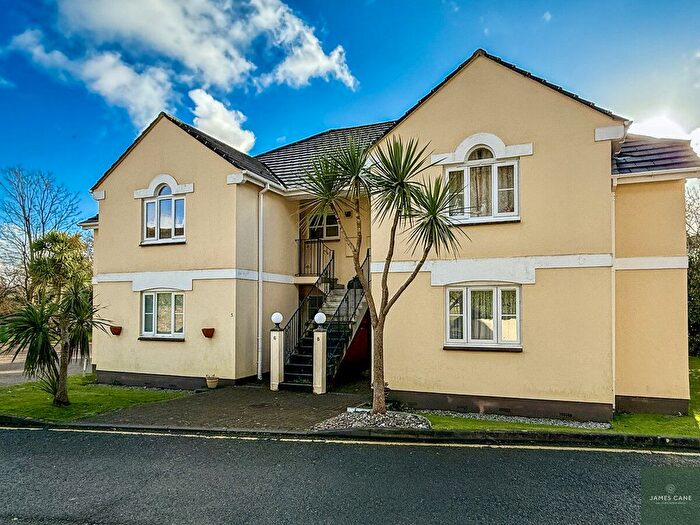
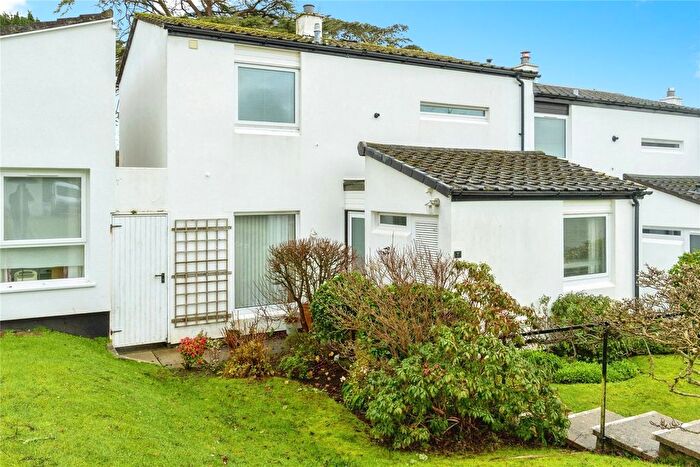
Properties for sale in Truro
Neighbourhoods in Truro
Navigate through our locations to find the location of your next house in Truro, Cornwall for sale or to rent.
- Carharrack, Gwennap And St Day
- Chacewater, Kenwyn And Baldhu
- Feock And Playing Place
- Ladock, St Clement And St Erme
- Lanner And Stithians
- Mabe, Perranarworthal And St Gluvias
- Mount Hawke And Portreath
- Newlyn And Goonhavern
- Penryn East And Mylor
- Perranporth
- Probus, Tregony And Grampound
- Roseland
- St Agnes
- St Dennis And Nanpean
- St Enoder
- St Mewan
- Threemilestone And Gloweth
- Truro Boscawen
- Truro Redannick
- Truro Tregolls
- Truro Trehaverne
- Probus & St Erme
- St Mewan & Grampound
- St Goran, Tregony & The Roseland
- Threemilestone & Chacewater
- Truro Boscawen & Redannick
- Truro Moresk & Trehaverne
- Gloweth, Malabar & Shortlanesend
- Feock & Kea
- Mylor, Perranarworthal & Ponsanooth
- St Newlyn East, Cubert & Goonhavern
Transport in Truro
Please see below transportation links in this area:
-
Truro Station
-
Perranwell Station
-
Penryn Station
-
Falmouth Docks Station
-
Penmere Station
-
Redruth Station
-
Falmouth Town Station
- FAQ
- Price Paid By Year
- Property Type Price
Frequently asked questions about Truro
What is the average price for a property for sale in Truro?
The average price for a property for sale in Truro is £399,131. This amount is 15% higher than the average price in Cornwall. There are more than 10,000 property listings for sale in Truro.
What locations have the most expensive properties for sale in Truro?
The locations with the most expensive properties for sale in Truro are Roseland at an average of £860,059, Feock And Playing Place at an average of £587,371 and Perranporth at an average of £531,071.
What locations have the most affordable properties for sale in Truro?
The locations with the most affordable properties for sale in Truro are St Mewan at an average of £275,000, Truro Boscawen at an average of £293,356 and Threemilestone And Gloweth at an average of £296,573.
Which train stations are available in or near Truro?
Some of the train stations available in or near Truro are Truro, Perranwell and Penryn.
Property Price Paid in Truro by Year
The average sold property price by year was:
| Year | Average Sold Price | Price Change |
Sold Properties
|
|---|---|---|---|
| 2025 | £381,017 | -5% |
683 Properties |
| 2024 | £400,305 | -3% |
781 Properties |
| 2023 | £413,432 | -3% |
801 Properties |
| 2022 | £427,241 | 12% |
936 Properties |
| 2021 | £376,582 | 2% |
1,363 Properties |
| 2020 | £368,422 | 18% |
1,042 Properties |
| 2019 | £301,582 | -1% |
1,123 Properties |
| 2018 | £304,209 | 3% |
1,203 Properties |
| 2017 | £294,806 | 2% |
1,295 Properties |
| 2016 | £287,635 | 3% |
1,245 Properties |
| 2015 | £279,647 | 7% |
1,248 Properties |
| 2014 | £260,804 | -2% |
1,099 Properties |
| 2013 | £265,640 | -4% |
927 Properties |
| 2012 | £275,114 | 4% |
835 Properties |
| 2011 | £265,054 | 0,3% |
836 Properties |
| 2010 | £264,214 | 5% |
924 Properties |
| 2009 | £251,837 | -18% |
750 Properties |
| 2008 | £296,069 | 4% |
669 Properties |
| 2007 | £283,232 | 12% |
1,216 Properties |
| 2006 | £248,510 | 3% |
1,332 Properties |
| 2005 | £240,497 | 6% |
985 Properties |
| 2004 | £226,809 | 15% |
1,184 Properties |
| 2003 | £192,342 | 20% |
1,228 Properties |
| 2002 | £154,490 | 17% |
1,336 Properties |
| 2001 | £128,529 | 12% |
1,289 Properties |
| 2000 | £113,267 | 17% |
1,250 Properties |
| 1999 | £93,753 | 7% |
1,277 Properties |
| 1998 | £87,551 | 10% |
1,238 Properties |
| 1997 | £78,729 | 10% |
1,287 Properties |
| 1996 | £70,926 | 6% |
1,077 Properties |
| 1995 | £66,506 | - |
872 Properties |
Property Price per Property Type in Truro
Here you can find historic sold price data in order to help with your property search.
The average Property Paid Price for specific property types in the last three years are:
| Property Type | Average Sold Price | Sold Properties |
|---|---|---|
| Semi Detached House | £328,560.00 | 497 Semi Detached Houses |
| Terraced House | £293,016.00 | 680 Terraced Houses |
| Detached House | £580,458.00 | 848 Detached Houses |
| Flat | £205,244.00 | 240 Flats |

