
Houses for sale in TR3 7RD, Hellings Close, Lanner And Stithians, Truro
House Prices in TR3 7RD, Hellings Close, Lanner And Stithians
Properties in TR3 7RD have no sales history available within the last 3 years. TR3 7RD is a postcode in Hellings Close located in Lanner And Stithians, an area in Truro, Cornwall, with 2 households².
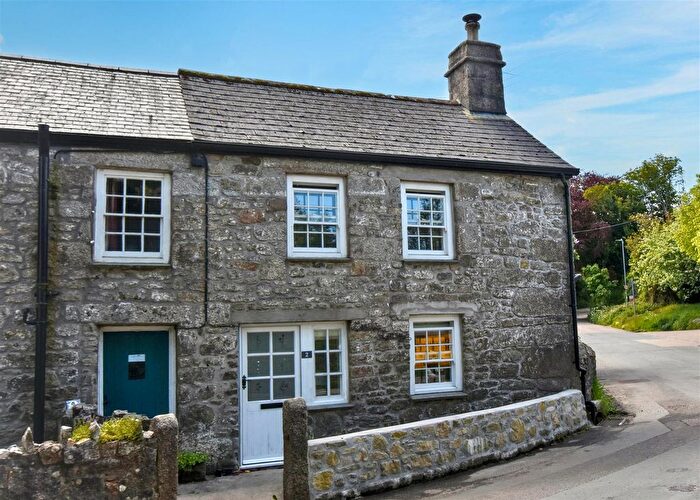
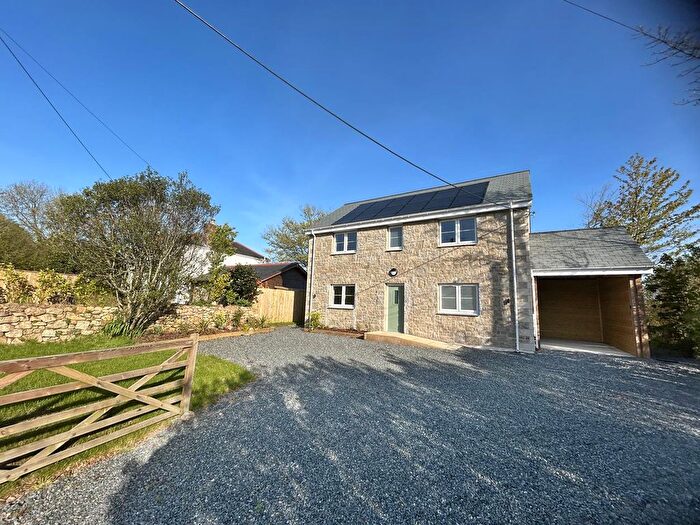
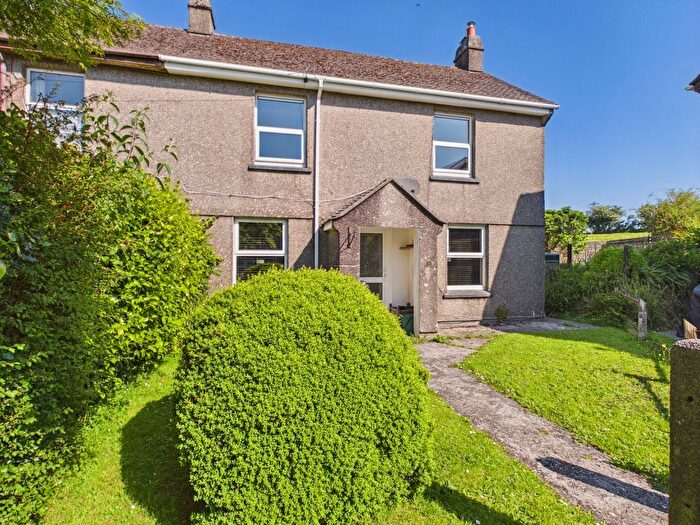
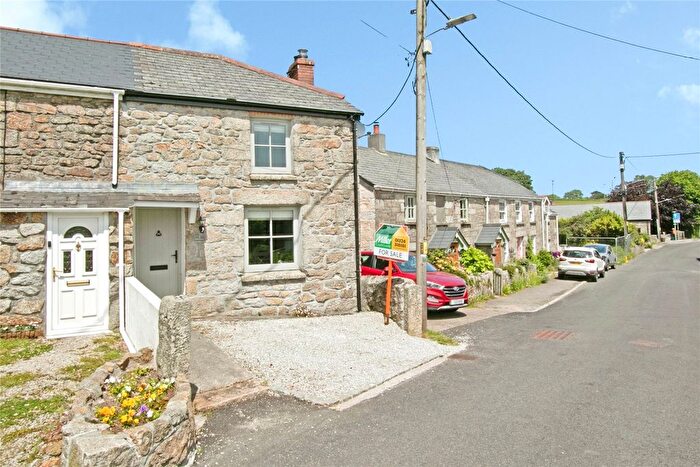
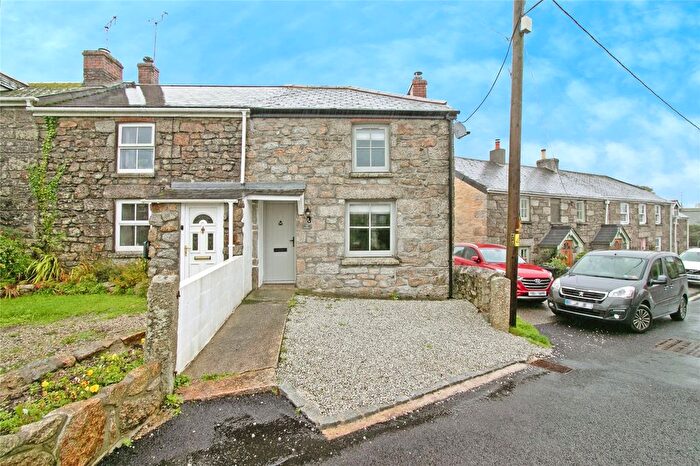
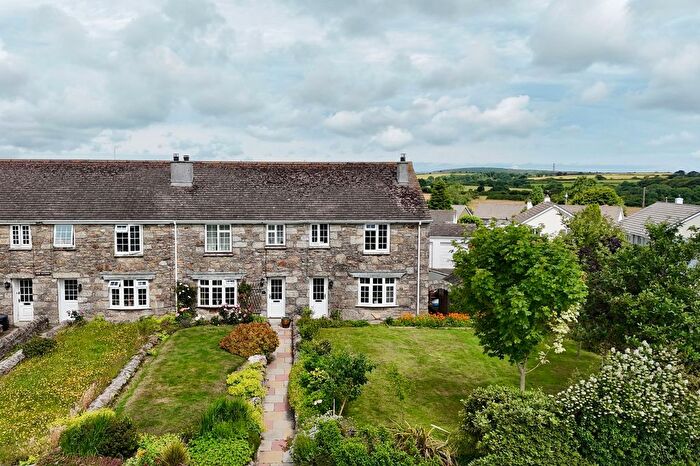
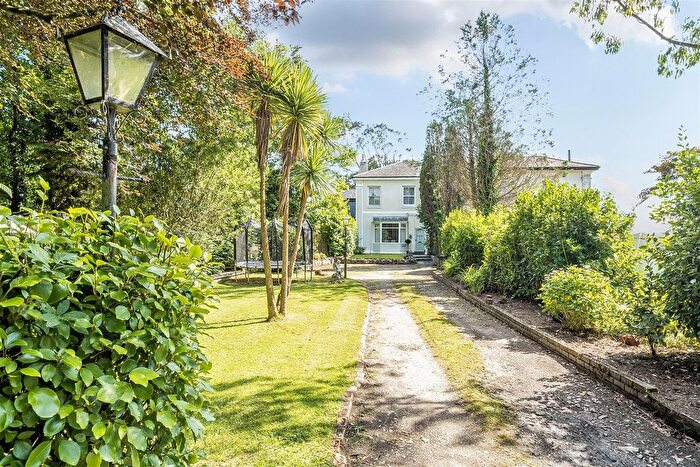
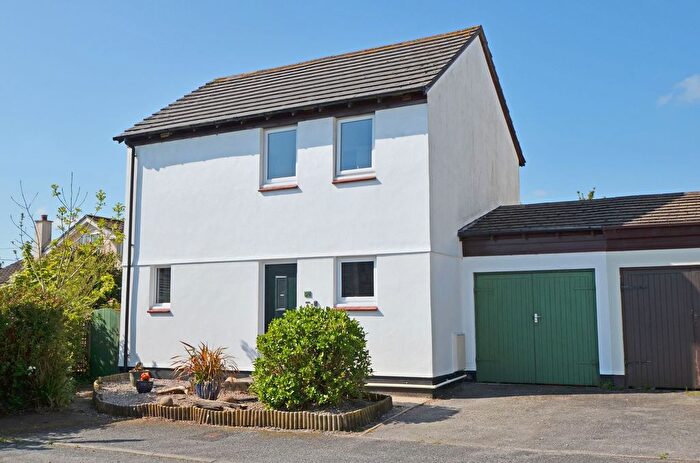
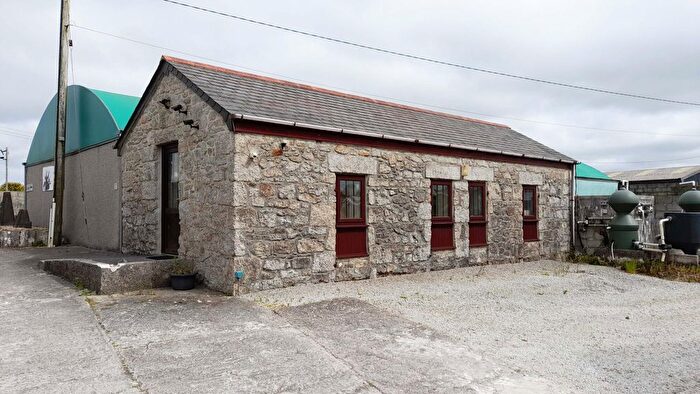
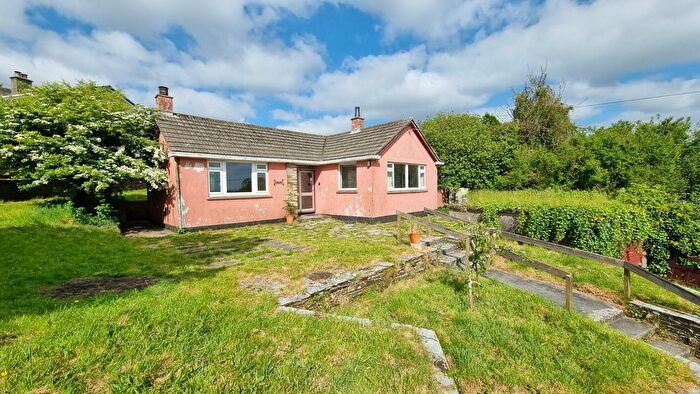
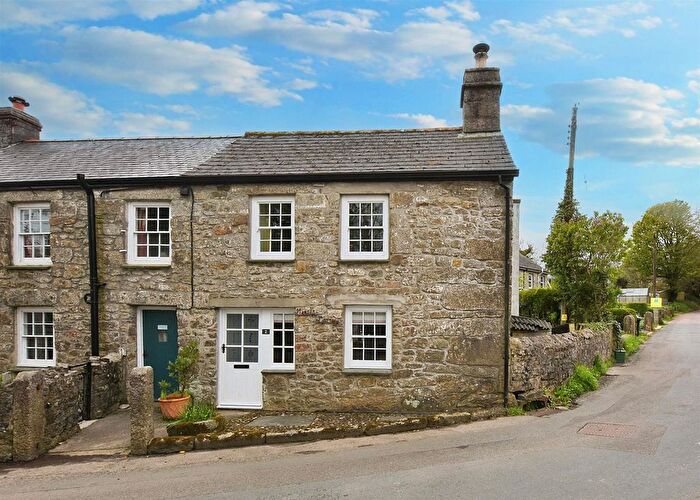
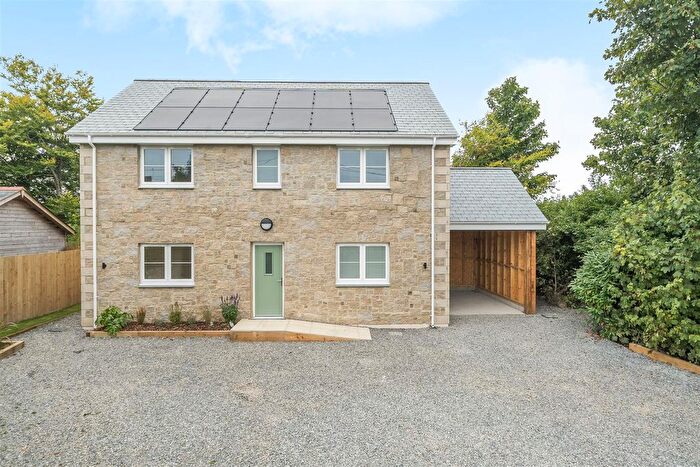
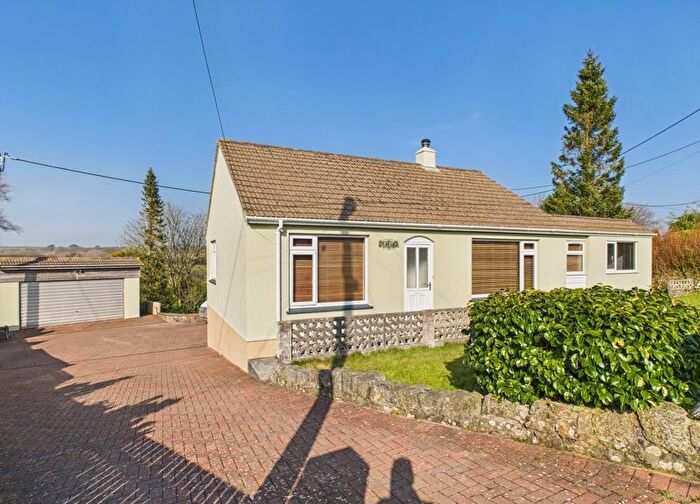
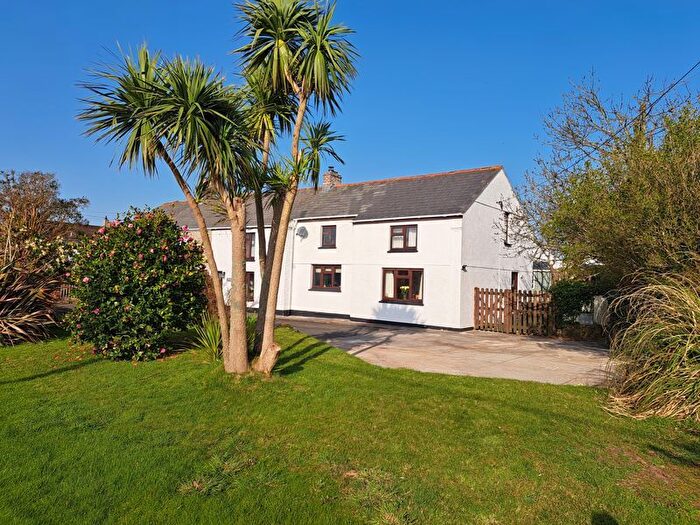
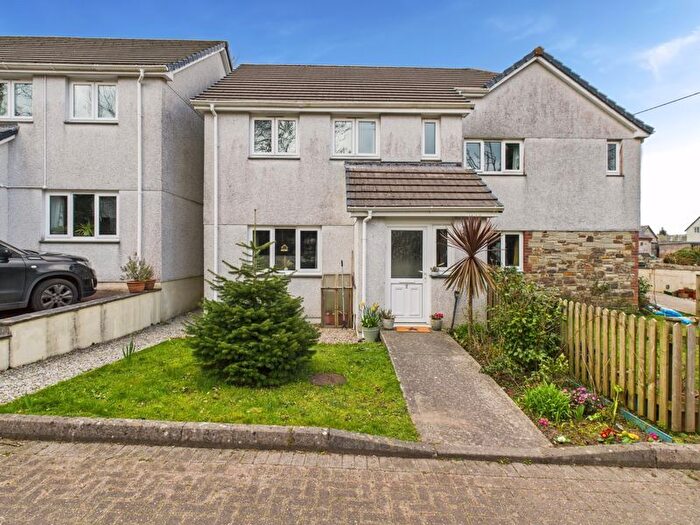
Previously listed properties near TR3 7RD, Hellings Close
![]()
If you are looking to sell your house, let it out, or receive a property valuation, an expert can help you.
Click the button below to get started.

Price Paid in Hellings Close, TR3 7RD, Lanner And Stithians
CHYREEN Hellings Close, TR3 7RD, Lanner And Stithians Truro
Property CHYREEN has been sold 4 times. The last time it was sold was in 19/10/2001 and the sold price was £89,950.00.
This is a Detached House which was sold as a freehold in 19/10/2001
| Date | Price | Property Type | Tenure | Classification |
|---|---|---|---|---|
| 19/10/2001 | £89,950.00 | Detached House | freehold | Established Building |
| 26/11/1999 | £79,000.00 | Detached House | freehold | Established Building |
| 16/10/1998 | £55,000.00 | Detached House | freehold | Established Building |
| 24/04/1996 | £50,000.00 | Detached House | freehold | Established Building |
TYNEBREA Hellings Close, TR3 7RD, Lanner And Stithians Truro
Property TYNEBREA has been sold 1 time. The last time it was sold was in 30/04/2001 and the sold price was £84,000.00.
This is a Detached House which was sold as a freehold in 30/04/2001
| Date | Price | Property Type | Tenure | Classification |
|---|---|---|---|---|
| 30/04/2001 | £84,000.00 | Detached House | freehold | Established Building |
Property price trends in TR3 7RD, Hellings Close
According to the latest Land Registry data, the average home in TR3 7RD, Hellings Close sold for £86,975 in 2001. That figure comes from 5 sales logged over the past 5 years.
Prices have continued to climb over the last three years. Compared with 1998, when the typical sale came in around £55,000, that's a rise of roughly 58.1%.
Looking back five years, average prices are up about 74% since 1996, a gain of around £36,975 in cash terms.
Property Price Paid in TR3 7RD, Hellings Close by Year
The average sold property price by year was:
| Year | Average Sold Price | Price Change |
Sold Properties
|
|---|---|---|---|
| 2001 | £86,975 | 9% |
2 Properties |
| 1999 | £79,000 | 30% |
1 Property |
| 1998 | £55,000 | 9% |
1 Property |
| 1996 | £50,000 | - |
1 Property |
