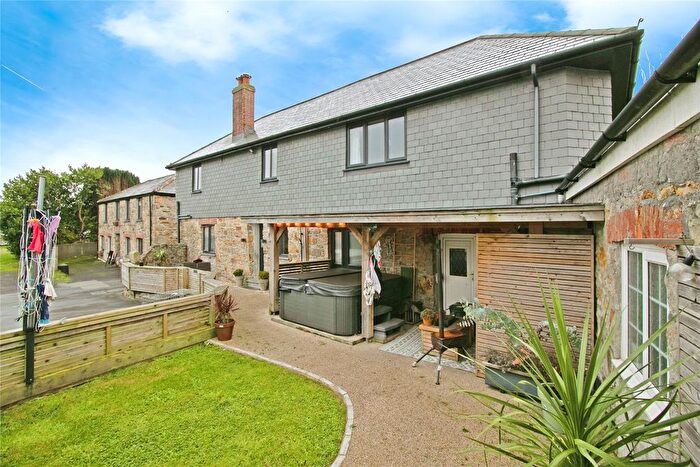
Houses for sale & to rent in St Agnes, Truro
House Prices in St Agnes
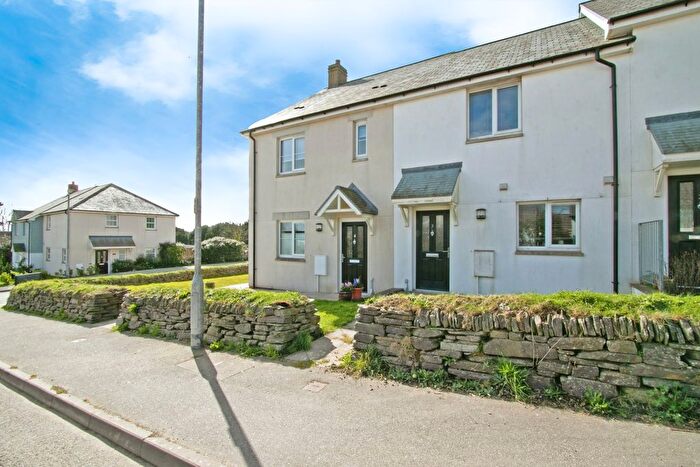
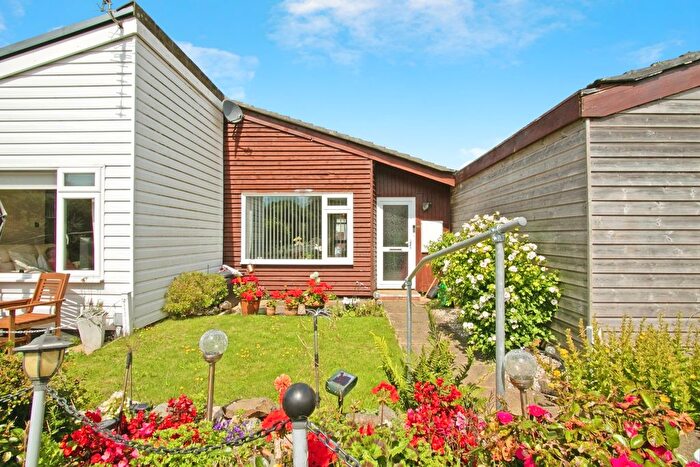
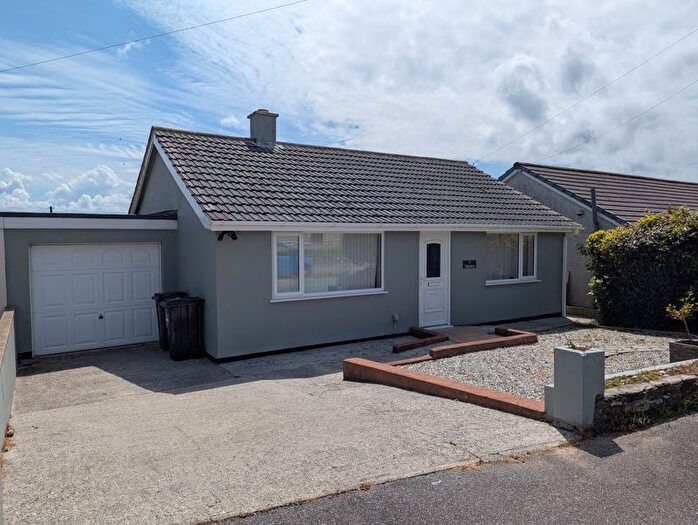
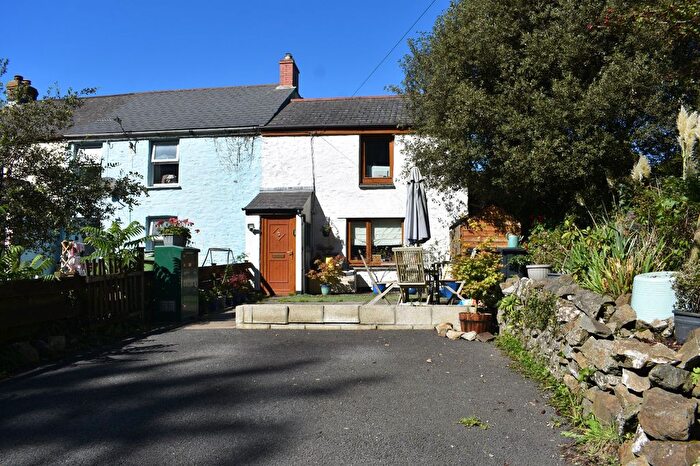
Properties in St Agnes have an average house price of £342,212.00 and had 20 Property Transactions within the last 3 years¹.
St Agnes is an area in Truro, Cornwall with 282 households², where the most expensive property was sold for £800,000.00.
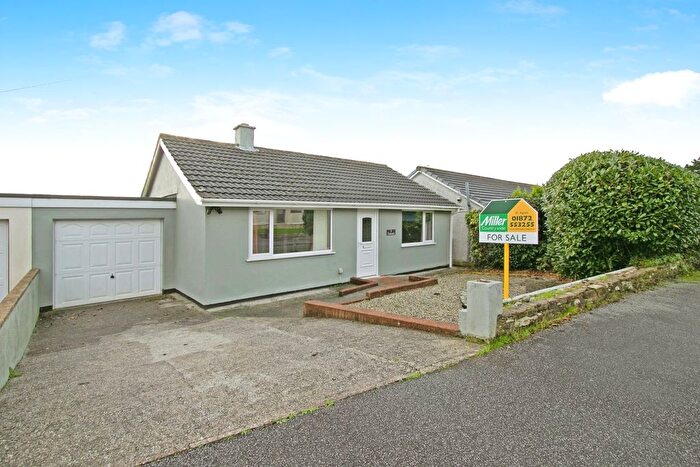
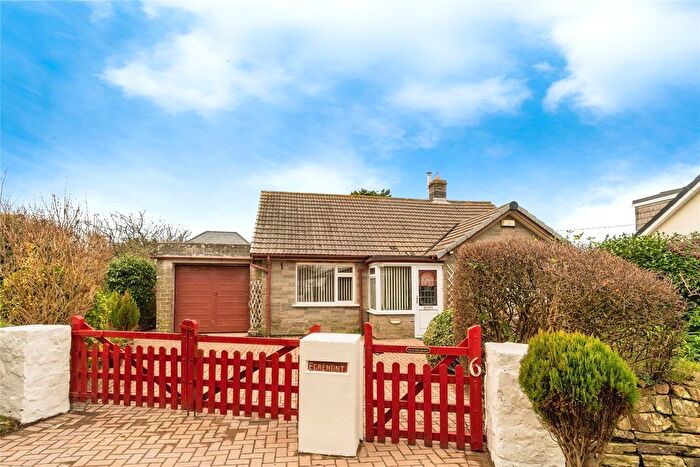
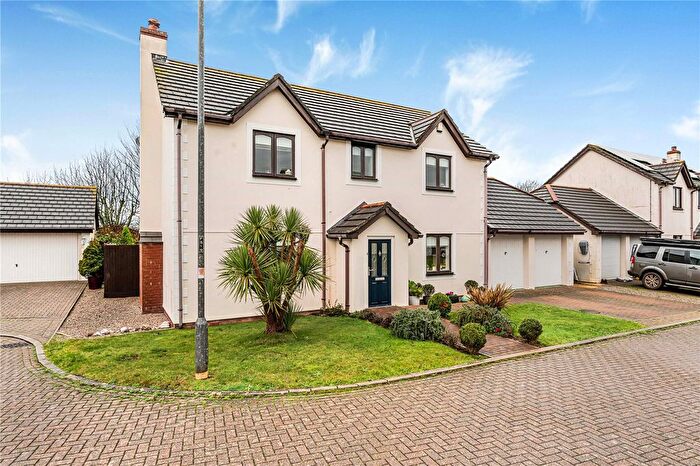
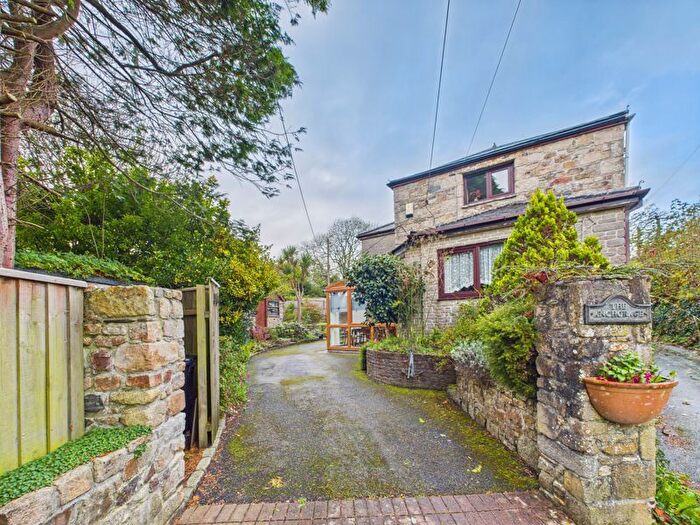
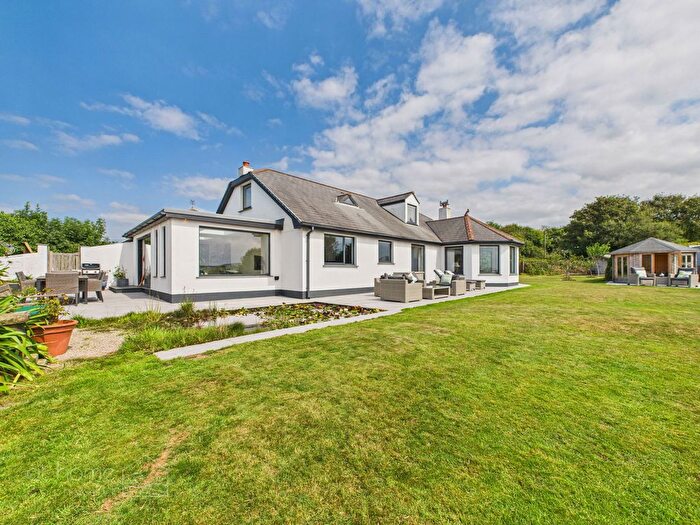
Properties for sale in St Agnes
Previously listed properties in St Agnes
Roads and Postcodes in St Agnes
Navigate through our locations to find the location of your next house in St Agnes, Truro for sale or to rent.
| Streets | Postcodes |
|---|---|
| Chiverton Cross | TR4 8HS |
| Coburg Terrace | TR4 8FU |
| Coronation Terrace | TR4 8SY |
| East Hill | TR4 8EG TR4 8HW TR4 8HR |
| Gwel Stenek | TR4 8FW |
| High View | TR4 8EL |
| High View Crescent | TR4 8EN |
| Mingoose | TR4 8BX TR4 8BU |
| Mingoose Vale | TR4 8BY |
| North Hill | TR4 8EP TR4 8ES |
| Passmore Close | TR4 8JL |
| Penhall Lane | TR4 8UA |
| Silverwell | TR4 8JH TR4 8JQ TR4 8GH TR4 8JJ |
| Sunny Side Cottages | TR4 8EH |
| Symons Close | TR4 8ER |
| Towan Cross | TR4 8DA |
| Two Burrows | TR4 8HN |
| West End | TR4 8EX TR4 8HH |
| Wheal Concord Way | TR4 8FT |
| Wicket Way | TR4 8FQ |
| TR4 8BD TR4 8BE TR4 8BS TR4 8BT TR4 8EJ TR4 8EQ TR4 8ET TR4 8EU TR4 8HG TR4 8EW TR4 8HQ |
Transport near St Agnes
- FAQ
- Price Paid By Year
- Property Type Price
Frequently asked questions about St Agnes
What is the average price for a property for sale in St Agnes?
The average price for a property for sale in St Agnes is £342,212. This amount is 14% lower than the average price in Truro. There are 308 property listings for sale in St Agnes.
What streets have the most expensive properties for sale in St Agnes?
The streets with the most expensive properties for sale in St Agnes are Mingoose at an average of £800,000, Symons Close at an average of £368,750 and North Hill at an average of £360,000.
What streets have the most affordable properties for sale in St Agnes?
The streets with the most affordable properties for sale in St Agnes are Chiverton Cross at an average of £177,500, Wheal Concord Way at an average of £178,750 and East Hill at an average of £185,000.
Which train stations are available in or near St Agnes?
Some of the train stations available in or near St Agnes are Redruth, Perranwell and Truro.
Property Price Paid in St Agnes by Year
The average sold property price by year was:
| Year | Average Sold Price | Price Change |
Sold Properties
|
|---|---|---|---|
| 2025 | £300,250 | -13% |
5 Properties |
| 2024 | £338,437 | -11% |
8 Properties |
| 2023 | £376,500 | -0,1% |
7 Properties |
| 2022 | £377,000 | 11% |
5 Properties |
| 2021 | £335,000 | -1% |
10 Properties |
| 2020 | £339,747 | 7% |
17 Properties |
| 2019 | £315,384 | 24% |
20 Properties |
| 2018 | £239,090 | -6% |
11 Properties |
| 2017 | £253,842 | -25% |
13 Properties |
| 2016 | £318,083 | 11% |
6 Properties |
| 2015 | £283,714 | 25% |
14 Properties |
| 2014 | £213,750 | -4% |
10 Properties |
| 2013 | £221,333 | -38% |
6 Properties |
| 2012 | £306,125 | 23% |
8 Properties |
| 2011 | £236,214 | -109% |
7 Properties |
| 2010 | £492,750 | 66% |
6 Properties |
| 2009 | £169,316 | -44% |
3 Properties |
| 2008 | £244,500 | 26% |
5 Properties |
| 2007 | £181,579 | -0,2% |
12 Properties |
| 2006 | £181,921 | -6% |
7 Properties |
| 2005 | £192,275 | - |
10 Properties |
| 2004 | £192,181 | 23% |
8 Properties |
| 2003 | £148,512 | -14% |
8 Properties |
| 2002 | £169,278 | 53% |
7 Properties |
| 2001 | £80,385 | -24% |
7 Properties |
| 2000 | £100,064 | 18% |
7 Properties |
| 1999 | £81,777 | 13% |
9 Properties |
| 1998 | £71,433 | -26% |
12 Properties |
| 1997 | £90,241 | 37% |
6 Properties |
| 1996 | £57,275 | 10% |
8 Properties |
| 1995 | £51,341 | - |
9 Properties |
Property Price per Property Type in St Agnes
Here you can find historic sold price data in order to help with your property search.
The average Property Paid Price for specific property types in the last three years are:
| Property Type | Average Sold Price | Sold Properties |
|---|---|---|
| Semi Detached House | £440,000.00 | 3 Semi Detached Houses |
| Detached House | £395,727.00 | 11 Detached Houses |
| Terraced House | £164,250.00 | 5 Terraced Houses |
| Flat | £350,000.00 | 1 Flat |

