
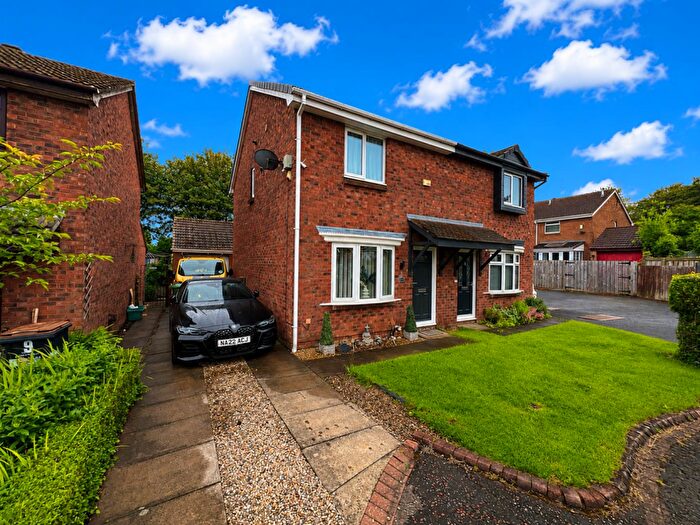
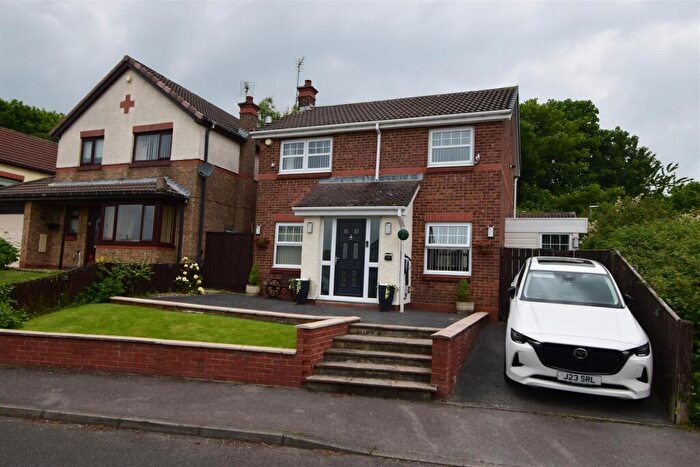
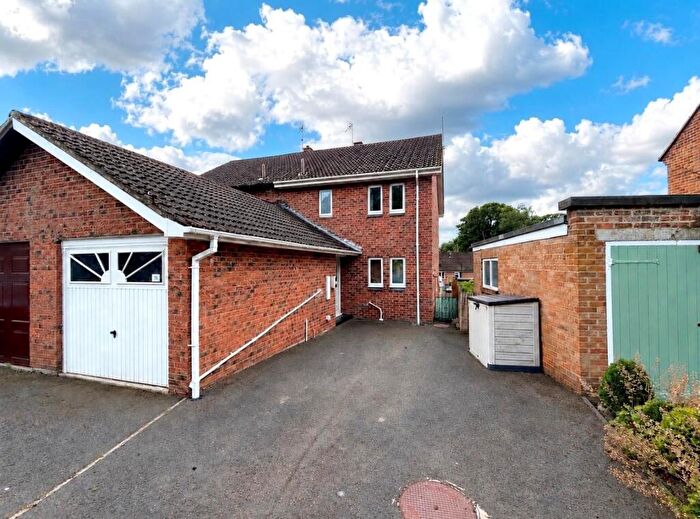
Houses for sale in Billingham, County Durham
House Prices in Billingham
Properties in Billingham have an average house price of £273k and had 2 Property Transactions within the last 3 years.¹
Billingham is an area in County Durham with 62 households², where the most expensive property was sold for £400k.
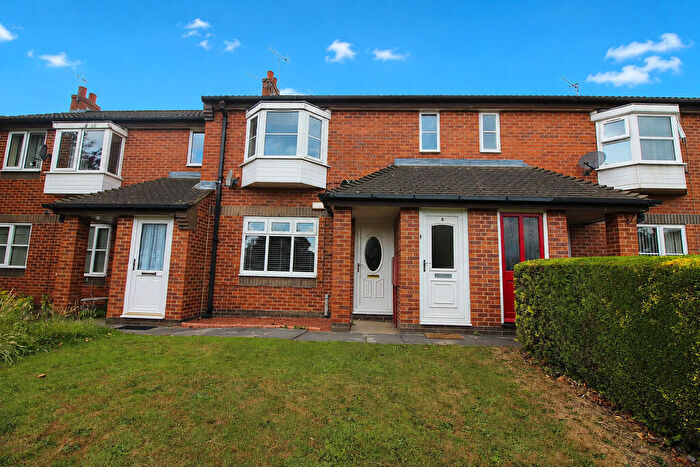
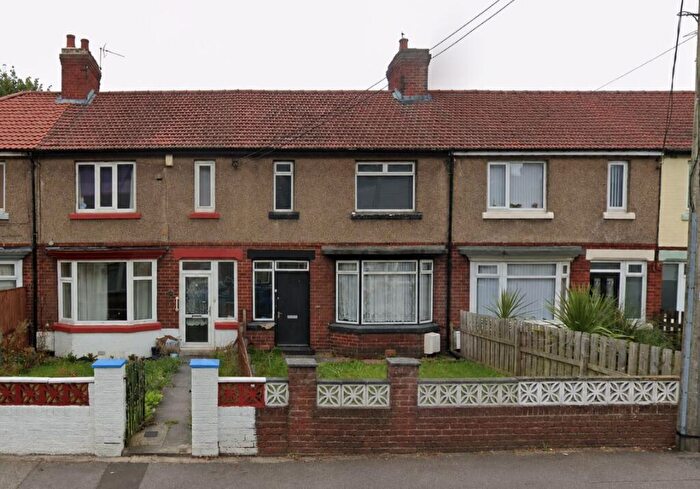
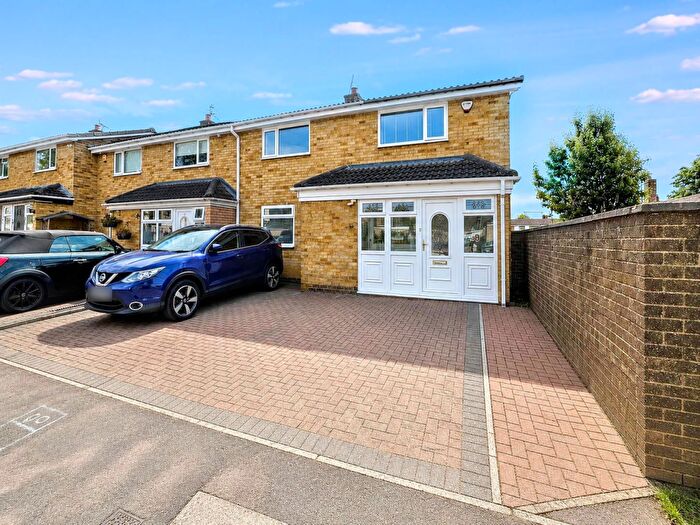
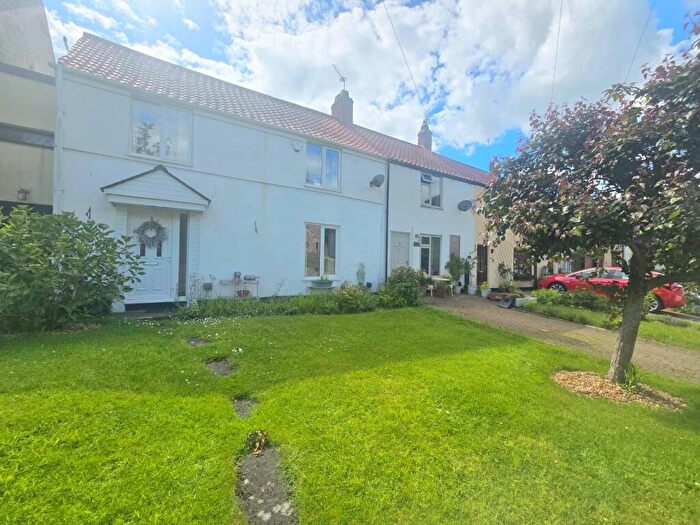
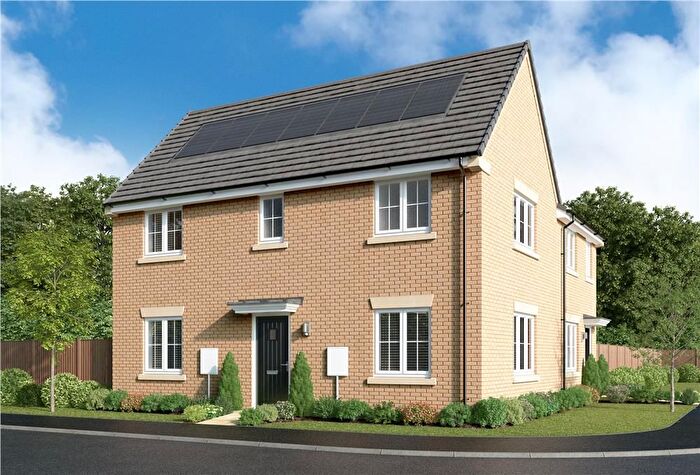
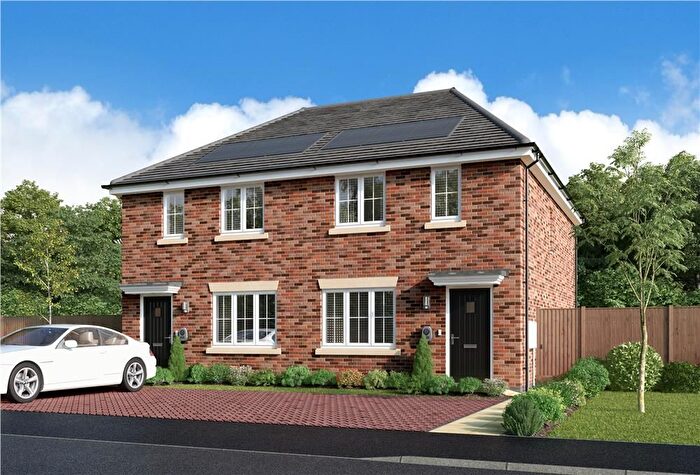
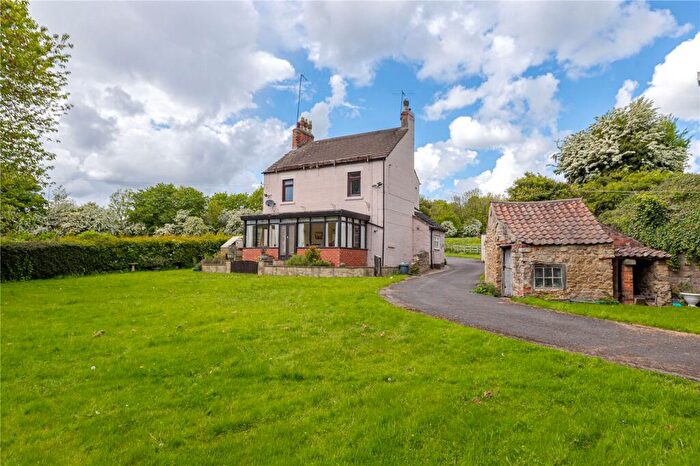
Properties for sale in Billingham
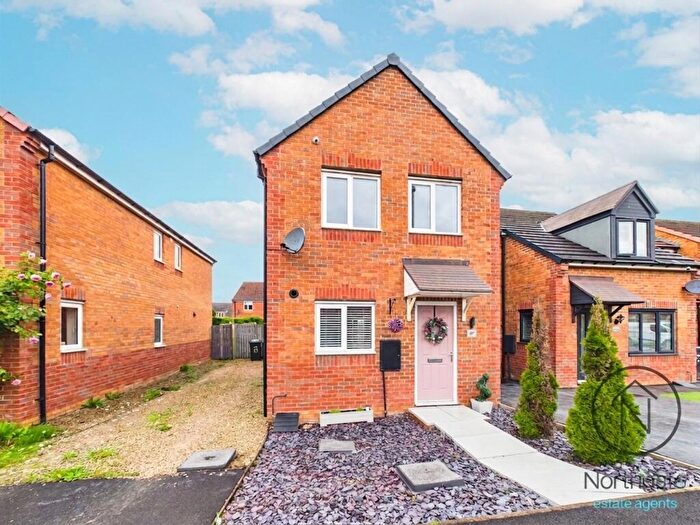
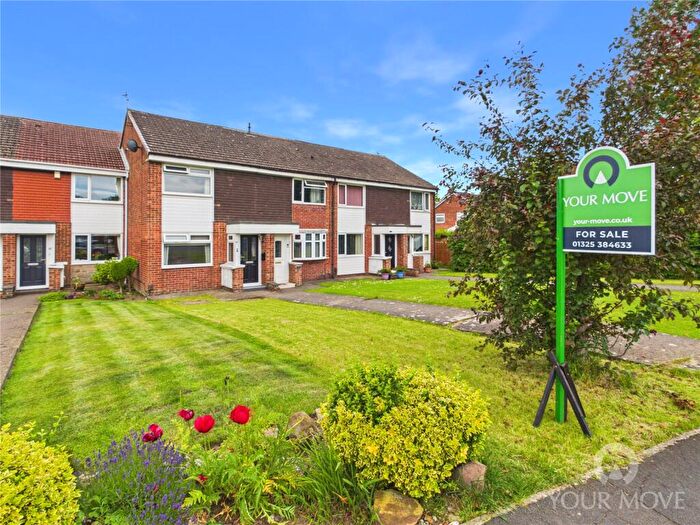
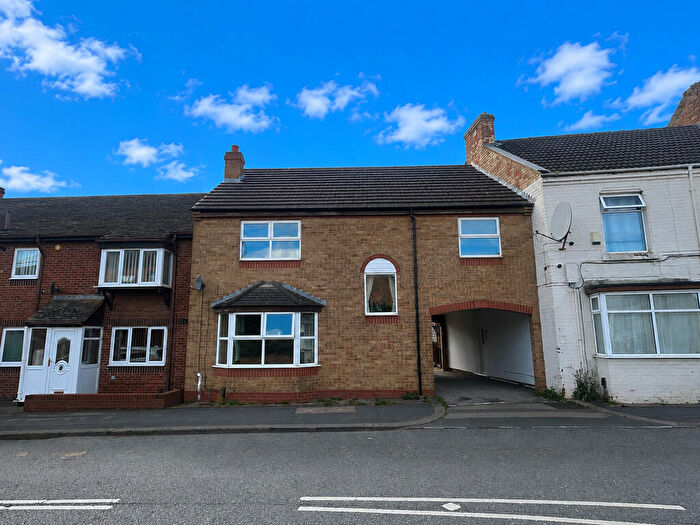
![]()
If you are looking to sell your house, let it out, or receive a property valuation, an expert can help you.
Click the button below to get started.
Neighbourhoods in Billingham
Navigate through our locations to find the location of your next house in Billingham, County Durham for sale or to rent.
Property price trends in Billingham
According to the latest Land Registry data, the average home in Billingham sold for £272,500 in 2023. That figure comes from 27 sales logged over the past 27 years.
Prices have continued to climb over the last three years. Compared with 2021, when the typical sale came in around £147,000, that's a rise of roughly 85.4%.
Looking back five years, average prices are down about 36.6% since 2018, a drop of around £157,500 in cash terms.
Zoom out to the past decade for the fuller picture. Back in 2014, homes here averaged £98,000, so the typical sold price has climbed about 178.1% since then, roughly 12% a year. Stretch the view to fifteen years and that annual pace eases back to about 3.6%.
Frequently asked questions about Billingham
What is the average price for a property for sale in Billingham?
The average price for a property for sale in Billingham is £272,500. This amount is 93% higher than the average price in County Durham. There are 4,444 property listings for sale in Billingham.
Which train stations are available in or near Billingham?
Some of the train stations available in or near Billingham are Newton Aycliffe, Heighington and Shildon.
Property Price Paid in Billingham by Year
The average sold property price by year was:
| Year | Average Sold Price | Price Change |
Sold Properties
|
|---|---|---|---|
| 2023 | £272,500 | -101% |
2 Properties |
| 2022 | £548,333 | 73% |
3 Properties |
| 2021 | £147,000 | -193% |
1 Property |
| 2018 | £430,000 | 79% |
1 Property |
| 2017 | £90,000 | -159% |
1 Property |
| 2016 | £233,500 | 58% |
2 Properties |
| 2014 | £98,000 | -63% |
1 Property |
| 2008 | £160,000 | -41% |
2 Properties |
| 2007 | £225,833 | -35% |
3 Properties |
| 2006 | £305,000 | 41% |
1 Property |
Property Price per Property Type in Billingham
Here you can find historic sold price data in order to help with your property search.
The average Property Paid Price for specific property types in the last three years are:
| Property Type | Average Sold Price | Sold Properties |
|---|---|---|
| Semi Detached House | £145,000.00 | 1 Semi Detached House |
| Detached House | £400,000.00 | 1 Detached House |
Transport in Billingham
Please see below transportation links in this area:
