
Houses for sale in County Durham, England
House Prices in County Durham
Properties in County Durham have
an average house price of
£141k
and had 27,314 Property Transactions
within the last 3 years.¹
County Durham is a location in
England with
235,488 households², where the most expensive property was sold for £1.9M.
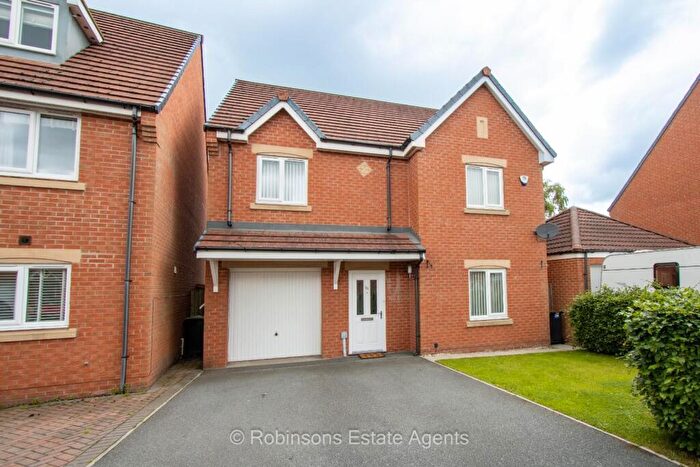
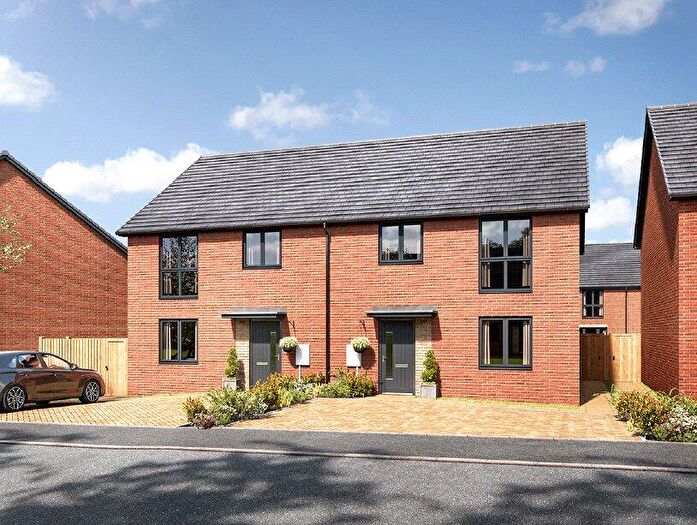
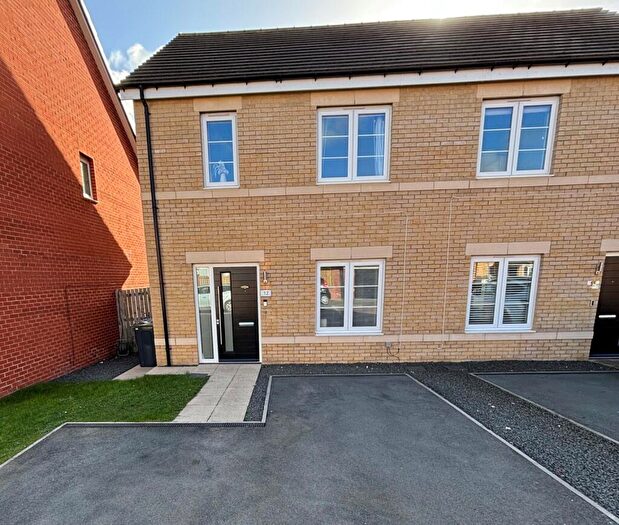
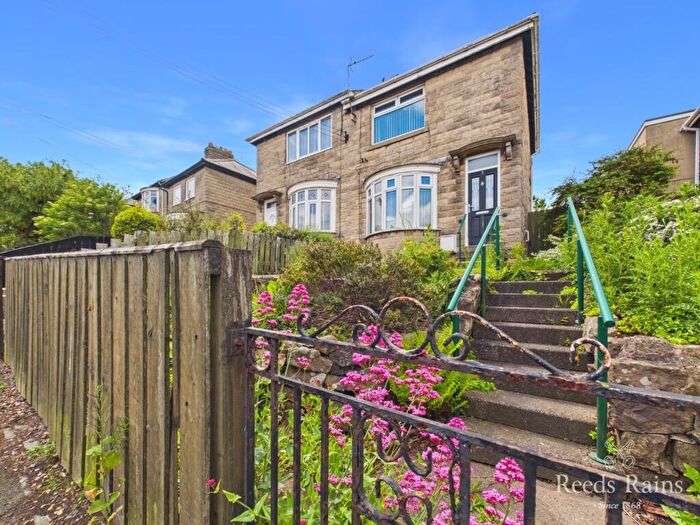
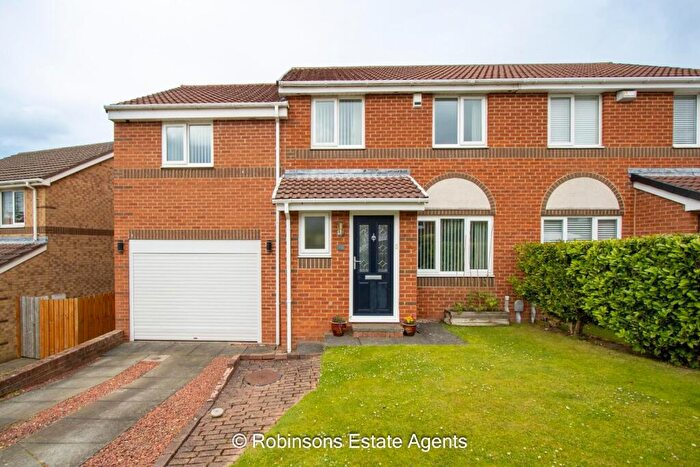
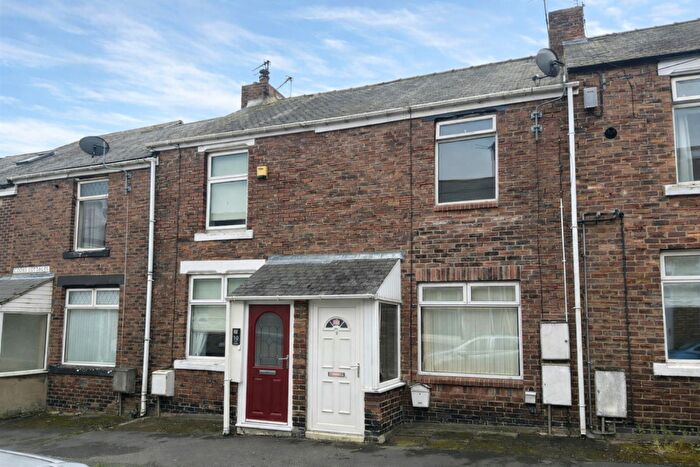
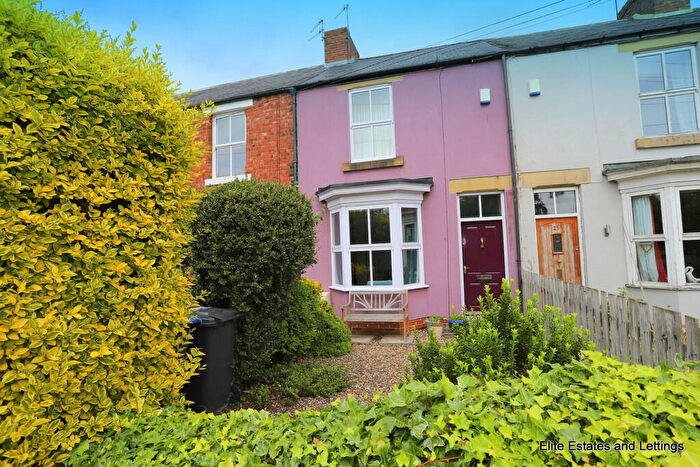
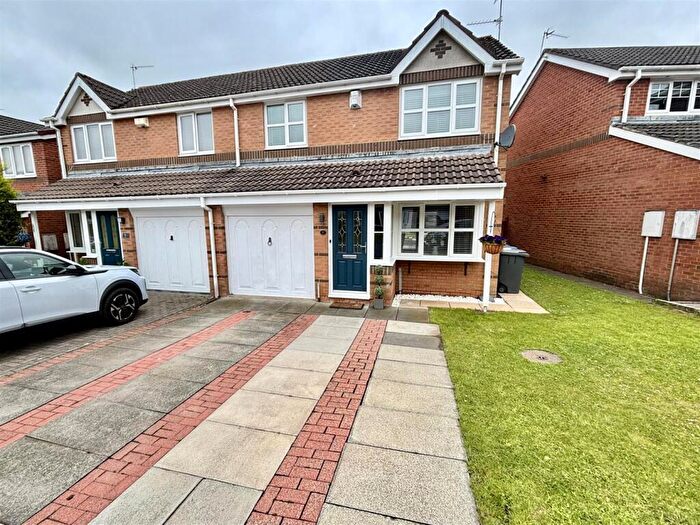
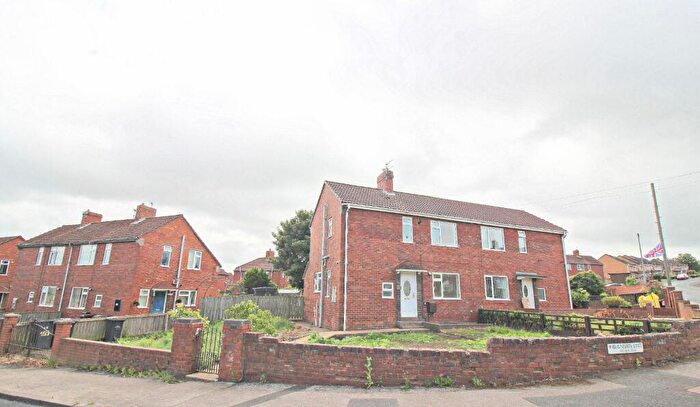
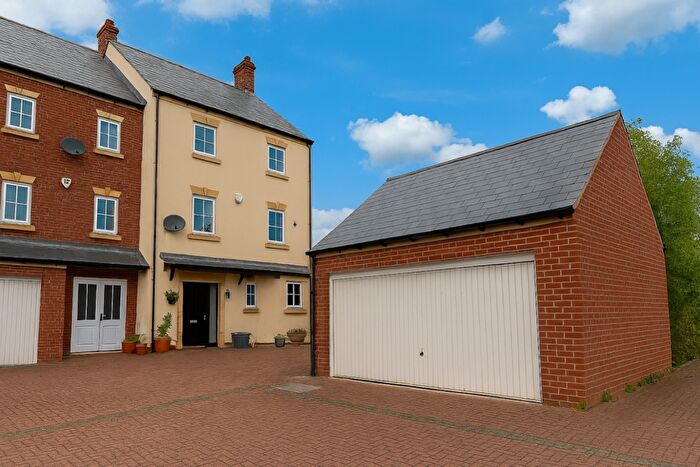
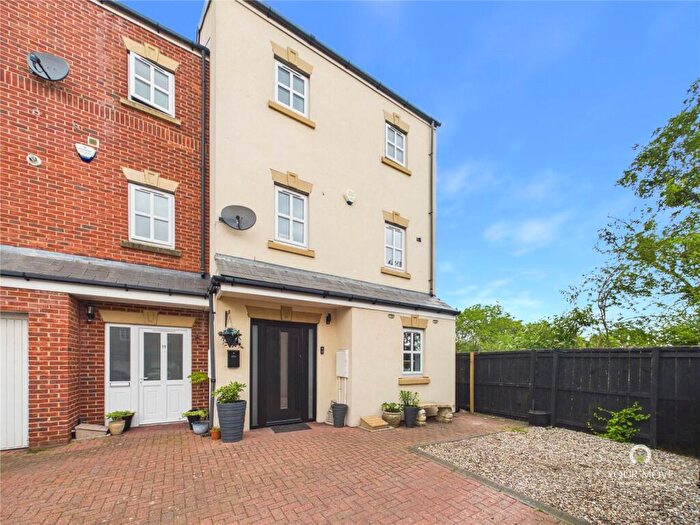
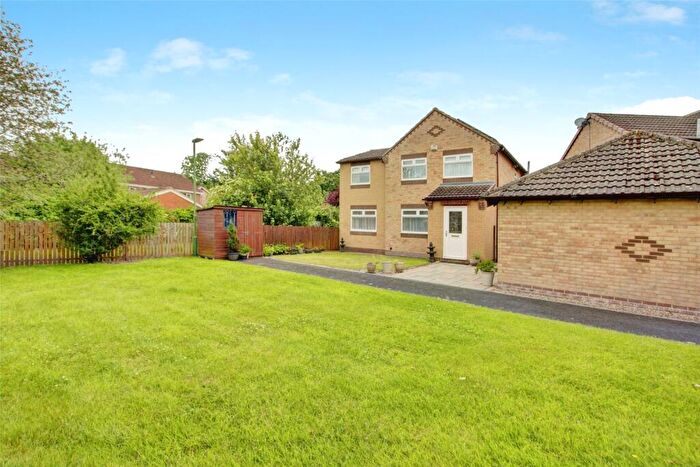
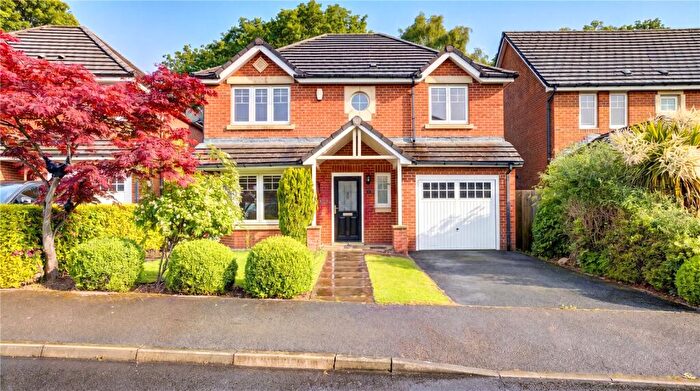
Properties for sale in County Durham
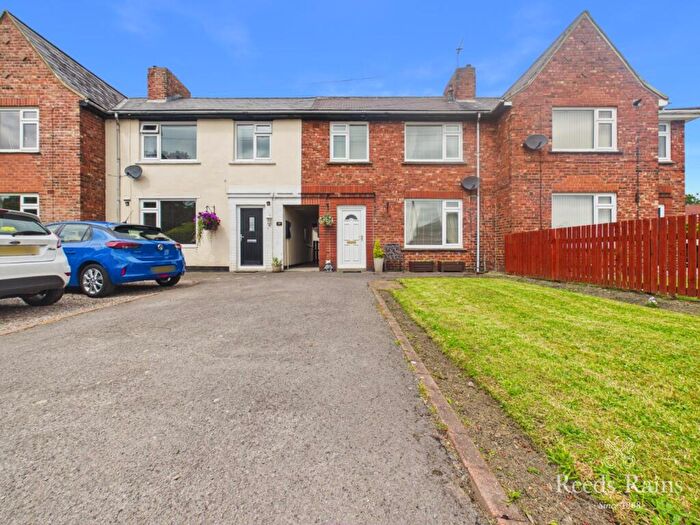
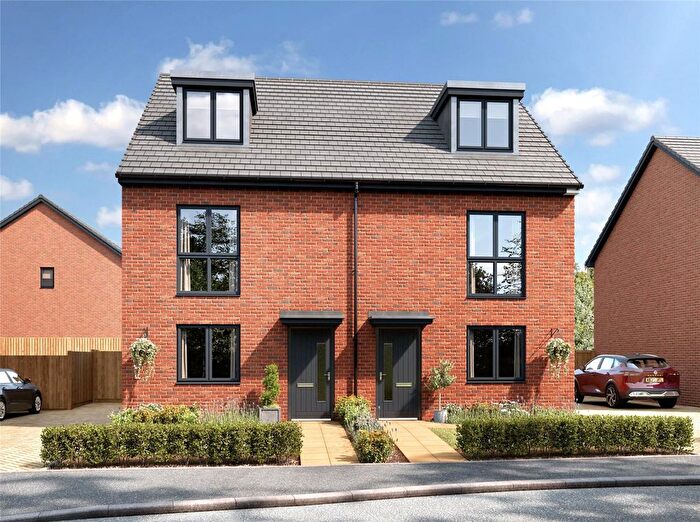
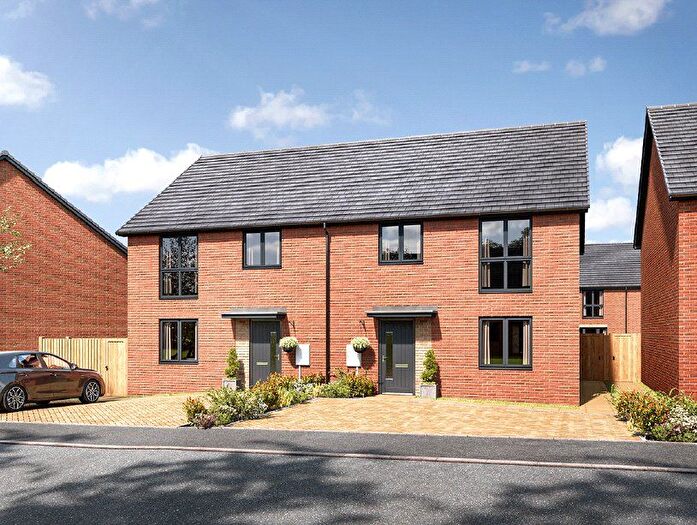
![]()
If you are looking to sell your house, let it out, or receive a property valuation, an expert can help you.
Click the button below to get started.

Towns in County Durham
Navigate through our locations to find the location of your next house in County Durham, England for sale or to rent.
Property price trends in County Durham
According to the latest Land Registry data, the average home in County Durham sold for £147,941 in 2026. That figure comes from a substantial record of 270,660 sales logged over the past 31 years.
Prices have continued to climb over the last three years. Compared with 2023, when the typical sale came in around £135,157, that's a rise of roughly 9.5%.
Looking back five years, average prices are up about 3.5% since 2021, a gain of around £5,011 in cash terms.
Zoom out to the past decade for the fuller picture. Back in 2016, homes here averaged £122,770, so the typical sold price has climbed about 20.5% since then, roughly 1.9% a year. Stretch the view to fifteen years and that annual pace eases back to about 1.3%.
Frequently asked questions about County Durham
What is the average price for a property for sale in County Durham?
The average price for a property for sale in County Durham is £141,113. This amount is 61% lower than the average price in England. There are more than 10,000 property listings for sale in County Durham.
What locations have the most expensive properties for sale in County Durham?
The locations with the most expensive properties for sale in County Durham are Washington at an average of £678,750, Rowlands Gill at an average of £533,777 and Richmond at an average of £360,777.
What locations have the most affordable properties for sale in County Durham?
The locations with the most affordable properties for sale in County Durham are Shildon at an average of £77,145, Peterlee at an average of £87,125 and Ferryhill at an average of £90,968.
Which train stations are available in or near County Durham?
Some of the train stations available in or near County Durham are Durham, Bishop Auckland and Chester-Le-Street.
Property Price Paid in County Durham by Year
The average sold property price by year was:
| Year | Average Sold Price | Price Change |
Sold Properties
|
|---|---|---|---|
| 2026 | £147,941 | -0,2% |
1,147 Properties |
| 2025 | £148,213 | 6% |
8,589 Properties |
| 2024 | £139,078 | 3% |
9,149 Properties |
| 2023 | £135,157 | -4% |
8,429 Properties |
| 2022 | £140,062 | -2% |
9,976 Properties |
| 2021 | £142,930 | 6% |
11,185 Properties |
| 2020 | £133,964 | 1% |
8,443 Properties |
| 2019 | £132,132 | 3% |
9,510 Properties |
| 2018 | £128,657 | 2% |
9,125 Properties |
| 2017 | £126,554 | 3% |
9,184 Properties |
Property Price per Property Type in County Durham
Here you can find historic sold price data in order to help with your property search.
The average Property Paid Price for specific property types in the last three years are:
| Property Type | Average Sold Price | Sold Properties |
|---|---|---|
| Semi Detached House | £144,251.00 | 7,928 Semi Detached Houses |
| Terraced House | £93,535.00 | 13,620 Terraced Houses |
| Detached House | £280,631.00 | 4,738 Detached Houses |
| Flat | £104,245.00 | 1,028 Flats |
Transport in County Durham
Please see below transportation links in this area:
