
Houses for sale in Chilton, Ferryhill
House Prices in Chilton
Properties in Chilton have an average house price of £112k and had 282 Property Transactions within the last 3 years¹.
Chilton is an area in Ferryhill, County Durham with 2,187 households², where the most expensive property was sold for £910k.
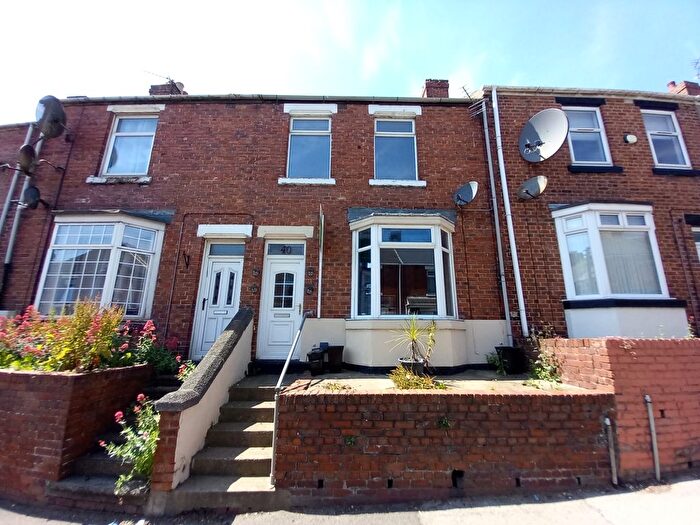
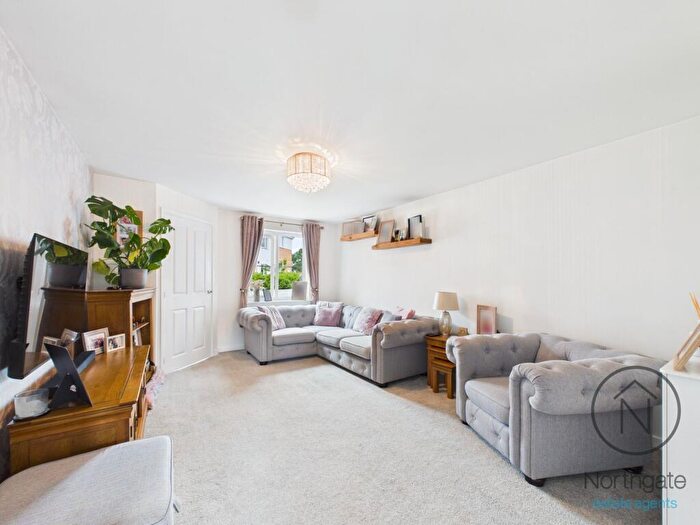
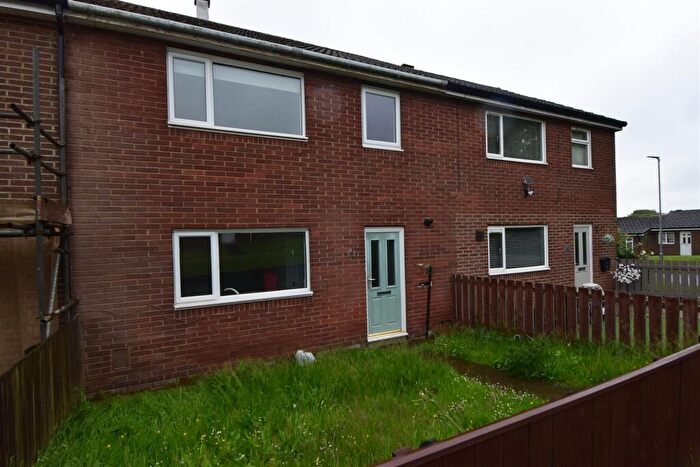
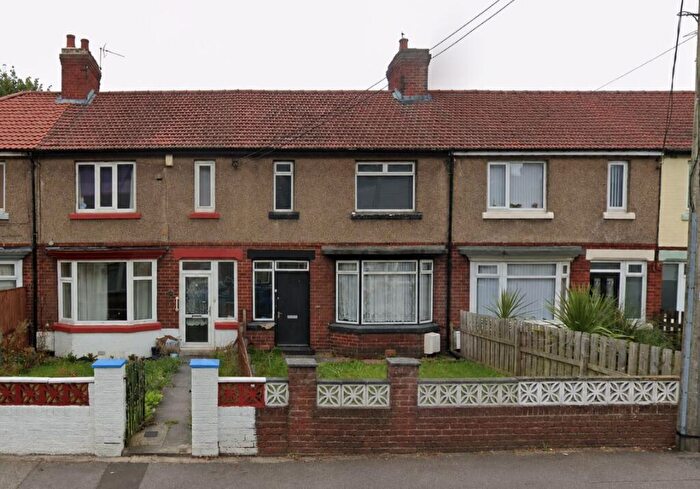
Properties for sale in Chilton
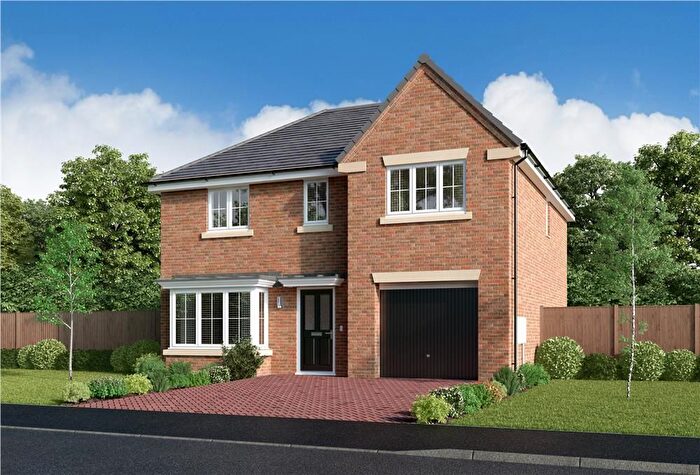
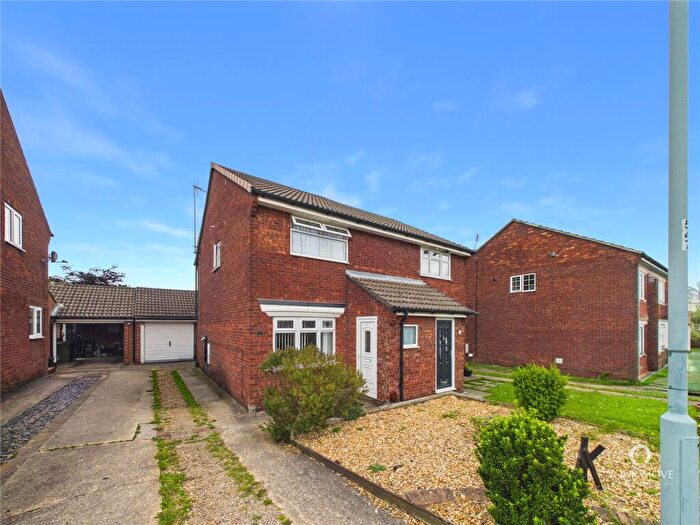
![]()
If you are looking to sell your house, let it out, or receive a property valuation, an expert can help you.
Click the button below to get started.
Roads and Postcodes in Chilton
Navigate through our locations to find the location of your next house in Chilton, Ferryhill for sale or to rent.
| Streets | Postcodes |
|---|---|
| Albert Street | DL17 0QA |
| Aldwin Close | DL17 0RQ |
| Alington Close | DL17 0RJ |
| Arthur Street | DL17 0PZ |
| Ash Grove | DL17 0JJ |
| Avenue Four | DL17 0SQ |
| Avenue One Industrial Estate | DL17 0PF DL17 0SF DL17 0SG DL17 0SH |
| Avenue Three Industrial Estate | DL17 0PB |
| Beech Avenue | DL17 0JL DL17 0JN |
| Beverley Gardens | DL17 0ER |
| Bradbury Way | DL17 0GZ |
| Brooklyn Road | DL17 0PW |
| Burns Road | DL17 0JE DL17 0JF |
| Byron Road | DL17 0HX |
| Carrsides Lane | DL17 0NJ |
| Cathedral Close | DL17 0BZ |
| Charlotte Terrace | DL17 0HD |
| Chilton Industrial Estate | DL17 0PE DL17 0SZ |
| Chilton Way | DL17 0PD |
| Chilton Way Industrial Estate | DL17 0SD DL17 0SE |
| Church View | DL17 0ED |
| Coleridge Road | DL17 0HS |
| Coronation Road | DL17 0QN |
| Cragside | DL17 0QP DL17 0RA |
| Crystal Close | DL17 0QX |
| Dale Street | DL17 0HQ |
| Denebridge | DL17 0NU |
| Denebridge Row | DL17 0HN DL17 0HW |
| Diamond Close | DL17 0QY |
| Durham Road | DL17 0EX |
| Durham Road Villas | DL17 0ES |
| Eden Gardens | DL17 0SL |
| Eden Terrace | DL17 0EJ |
| Emerald Walk | DL17 0QR |
| Ford Terrace | DL17 0JG |
| Golden Grove | DL17 0QU |
| Grampian Way | DL17 0QF |
| Granville Drive | DL17 0RG |
| Gypsy Lane | DL17 0LF DL17 0SJ |
| Hambleton Way | DL17 0RB |
| Henson Close | DL17 0BF |
| Hillside Bungalows | DL17 0EZ |
| Hillside Court | DL17 0FB |
| Hollowfield | DL17 0RT |
| Hunter Terrace | DL17 0JQ |
| Jade Walk | DL17 0QL |
| John Herriotts Court | DL17 0PH |
| Keats Road | DL17 0HR |
| Kirkham Close | DL17 0RL |
| Lyndhurst Road | DL17 0PN |
| Malvern Close | DL17 0QD |
| Meadow Dale | DL17 0RW |
| Mendip Green | DL17 0QH |
| Middridge Road | DL17 0NH |
| Mill Cottages | DL17 0LS |
| Millwood | DL17 0RR |
| Miners Court | DL17 0JS |
| Nable Hill Close | DL17 0GY |
| New South View | DL17 0PS |
| Norman Terrace | DL17 0HF |
| Oak Crescent | DL17 0EL |
| Opal Avenue | DL17 0QW |
| Paddock Close | DL17 0EE |
| Pearl Close | DL17 0QZ |
| Pennine Way | DL17 0QE |
| Prospect Terrace | DL17 0PX |
| Raby Terrace | DL17 0JD |
| Rawlinson Close | DL17 0BE |
| Rookery Gardens | DL17 0LR |
| Rosewood | DL17 0JW |
| Ruby Avenue | DL17 0QS DL17 0QT |
| Rushyford Drive | DL17 0EB DL17 0EQ |
| School Cottages | DL17 0LW |
| Shelley Terrace | DL17 0PR |
| Skirlaw Close | DL17 0RH |
| South Downs | DL17 0QG DL17 0QQ |
| St Aidans Way | DL17 0AT |
| Tennyson Road | DL17 0HZ |
| The Cotswolds | DL17 0QB |
| The Cottages | DL17 0LN |
| The Crescent | DL17 0EP |
| The Grove | DL17 0PL DL17 0PP |
| The Haven | DL17 0EU |
| The Pentlands | DL17 0QJ |
| The Poplars | DL17 0JP |
| Villiers Close | DL17 0RN |
| West Chilton Terrace | DL17 0HH DL17 0HJ |
| West Close Cottages | DL17 0PQ |
| Wilkinson Way | DL17 0BL |
| Windgroves | DL17 0RS |
| Windlestone Park | DL17 0LX DL17 0LZ DL17 0NF DL17 0NG |
| Woodham View | DL17 0PJ |
| Wordsworth Road | DL17 0HU |
| DL17 0LL DL17 0PT DL17 0DY DL17 0DZ DL17 0EH DL17 0EN DL17 0EW DL17 0EY DL17 0HA DL17 0HB DL17 0HE DL17 0HP DL17 0JU DL17 0JX DL17 0JY DL17 0LJ DL17 0LP DL17 0LT DL17 0LU DL17 0LY DL17 0NL DL17 0PA DL17 0PU DL17 0PY DL17 0RF |
Property price trends in Chilton
According to the latest Land Registry data, the average home in Chilton sold for £133,000 in 2026. That figure comes from 2,901 sales logged over the past 31 years.
Prices have continued to climb over the last three years. Compared with 2023, when the typical sale came in around £124,565, that's a rise of roughly 6.8%.
Looking back five years, average prices are up about 2.7% since 2021, a gain of around £3,489 in cash terms.
Zoom out to the past decade for the fuller picture. Back in 2016, homes here averaged £96,439, so the typical sold price has climbed about 37.9% since then, roughly 3.3% a year. Stretch the view to fifteen years and that annual pace holds at about 3.4%.
Frequently asked questions about Chilton
What is the average price for a property for sale in Chilton?
The average price for a property for sale in Chilton is £112,428. This amount is 24% higher than the average price in Ferryhill. There are 1,269 property listings for sale in Chilton.
What streets have the most expensive properties for sale in Chilton?
The streets with the most expensive properties for sale in Chilton are Windlestone Park at an average of £353,000, Millwood at an average of £253,000 and Oak Crescent at an average of £231,862.
What streets have the most affordable properties for sale in Chilton?
The streets with the most affordable properties for sale in Chilton are Dale Street at an average of £27,200, Norman Terrace at an average of £38,333 and Charlotte Terrace at an average of £41,750.
Which train stations are available in or near Chilton?
Some of the train stations available in or near Chilton are Newton Aycliffe, Shildon and Heighington.
Property Price Paid in Chilton by Year
The average sold property price by year was:
| Year | Average Sold Price | Price Change |
Sold Properties
|
|---|---|---|---|
| 2026 | £133,000 | 15% |
6 Properties |
| 2025 | £112,828 | 9% |
88 Properties |
| 2024 | £102,176 | -22% |
109 Properties |
| 2023 | £124,565 | 2% |
79 Properties |
| 2022 | £122,054 | -6% |
136 Properties |
| 2021 | £129,511 | 19% |
163 Properties |
| 2020 | £105,438 | -18% |
148 Properties |
| 2019 | £124,727 | -1% |
166 Properties |
| 2018 | £125,842 | 28% |
163 Properties |
| 2017 | £91,147 | -6% |
107 Properties |
Property Price per Property Type in Chilton
Here you can find historic sold price data in order to help with your property search.
The average Property Paid Price for specific property types in the last three years are:
| Property Type | Average Sold Price | Sold Properties |
|---|---|---|
| Semi Detached House | £105,147.00 | 79 Semi Detached Houses |
| Detached House | £257,643.00 | 54 Detached Houses |
| Terraced House | £64,009.00 | 146 Terraced Houses |
| Flat | £46,666.00 | 3 Flats |
