
Houses for sale & to rent in SR7 8ES, Waring Terrace, Deneside, Seaham
House Prices in SR7 8ES, Waring Terrace, Deneside
Properties in SR7 8ES have no sales history available within the last 3 years. SR7 8ES is a postcode in Waring Terrace located in Deneside, an area in Seaham, County Durham, with 13 households².
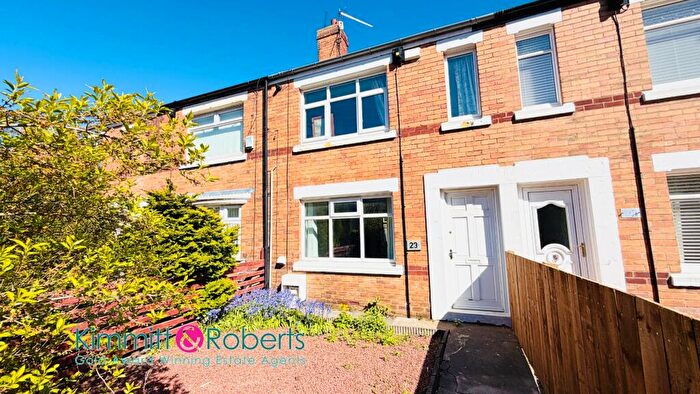
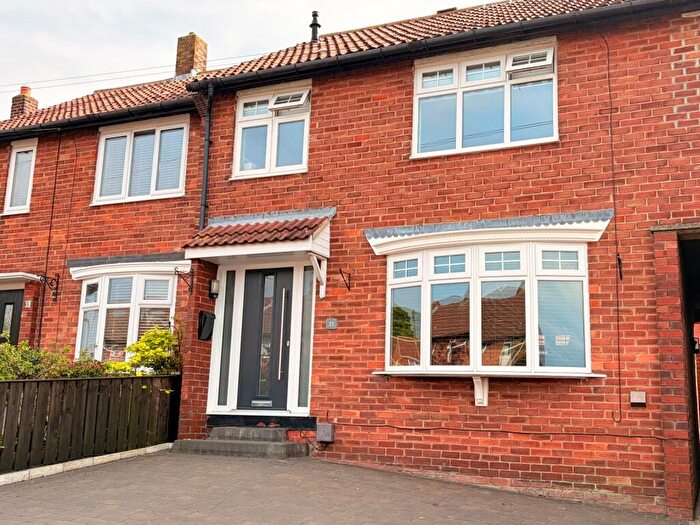
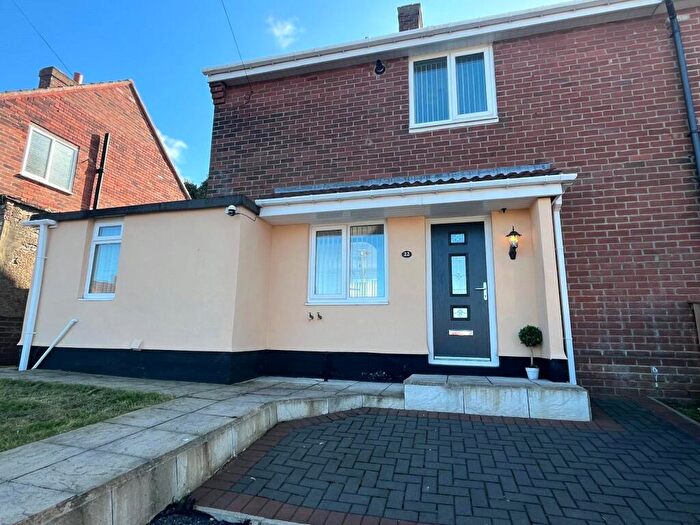
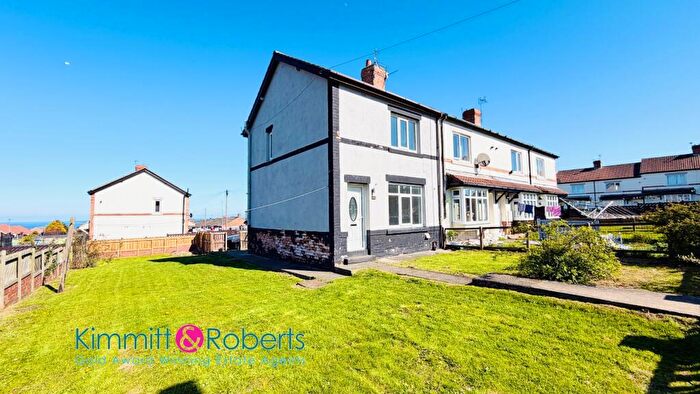
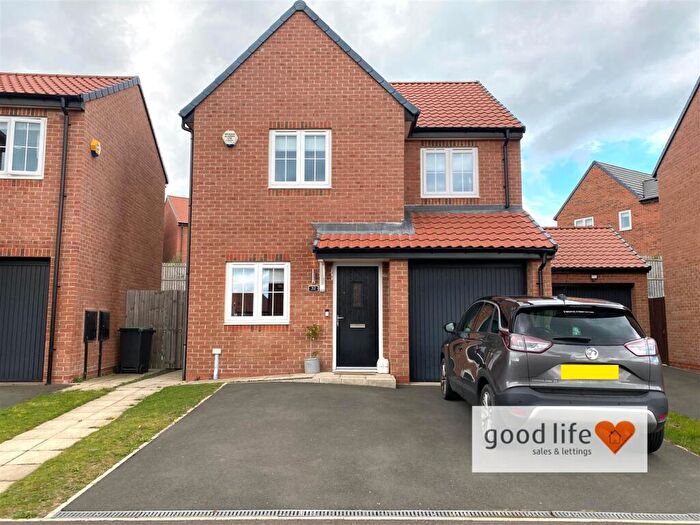
Properties for sale near SR7 8ES, Waring Terrace
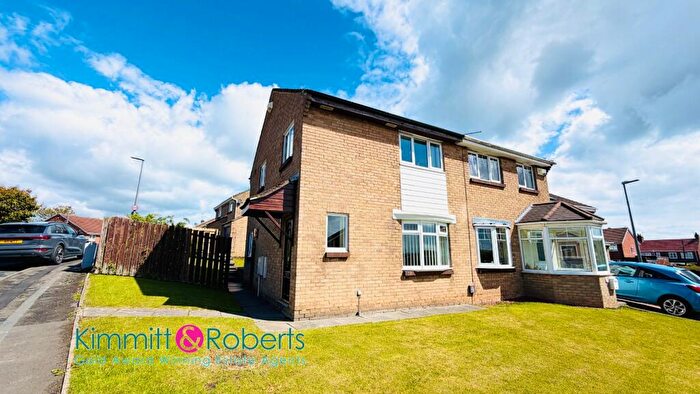
![]()
If you are looking to sell your house, let it out, or receive a property valuation, an expert can help you.
Click the button below to get started.

Price Paid in Waring Terrace, SR7 8ES, Deneside
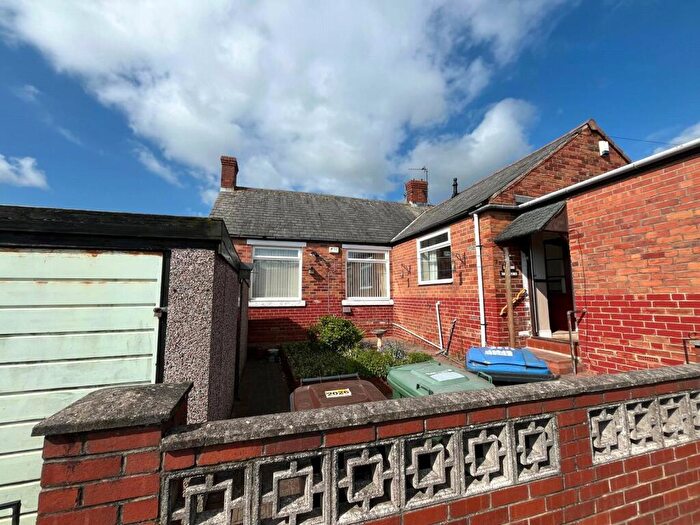
6 Waring Terrace, SR7 8ES, Deneside Seaham
Property 6 has been sold 1 time. The last time it was sold was in 30/05/2019 and the sold price was £140,000.00.
This semi detached house, sold as a freehold on 30/05/2019, is a 98 sqm semi-detached house with an EPC rating of D.
| Date | Price | Property Type | Tenure | Classification |
|---|---|---|---|---|
| 30/05/2019 | £140,000.00 | Semi Detached House | freehold | Established Building |
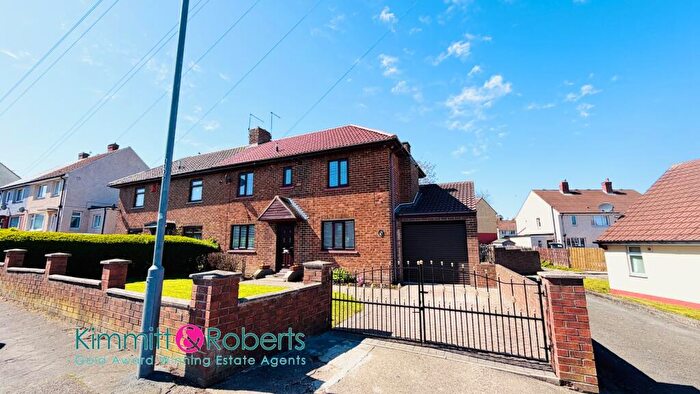
11 Waring Terrace, SR7 8ES, Deneside Seaham
Property 11 has been sold 2 times. The last time it was sold was in 01/05/2015 and the sold price was £87,000.00.
This semi detached house, sold as a freehold on 01/05/2015, is a 66 sqm semi-detached house with an EPC rating of D.
| Date | Price | Property Type | Tenure | Classification |
|---|---|---|---|---|
| 01/05/2015 | £87,000.00 | Semi Detached House | freehold | Established Building |
| 04/09/2013 | £68,500.00 | Semi Detached House | freehold | Established Building |
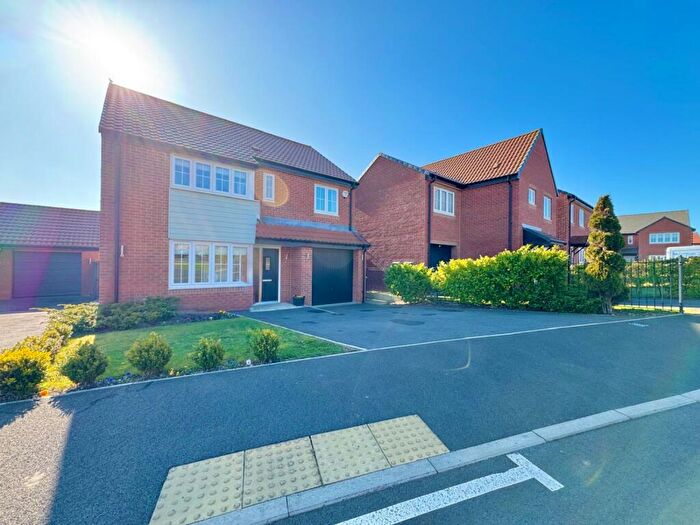
SOUTH END Waring Terrace, SR7 8ES, Deneside Seaham
Property SOUTH END has been sold 2 times. The last time it was sold was in 06/09/2013 and the sold price was £192,000.00.
This detached house, sold as a freehold on 06/09/2013, is a 103 sqm detached house with an EPC rating of D.
| Date | Price | Property Type | Tenure | Classification |
|---|---|---|---|---|
| 06/09/2013 | £192,000.00 | Detached House | freehold | Established Building |
| 11/08/2000 | £70,000.00 | Detached House | freehold | Established Building |
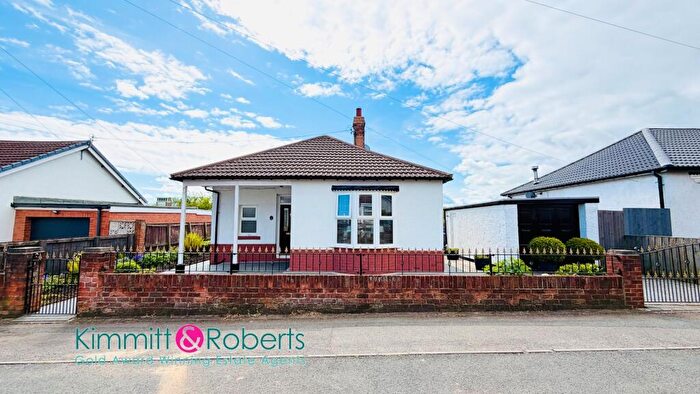
8 Waring Terrace Dalton-le-Dale, SR7 8ES, Deneside Seaham
This is a 42 square meter Semi-detached Bungalow with an EPC rating of D. Currently, there is no transaction history available for this property.
2 Waring Terrace Dalton-le-Dale, SR7 8ES, Deneside Seaham
This is a 44 square meter Semi-detached Bungalow with an EPC rating of D. Currently, there is no transaction history available for this property.
10 Waring Terrace Dalton-le-Dale, SR7 8ES, Deneside Seaham
This is a 43 square meter Semi-detached Bungalow with an EPC rating of C. Currently, there is no transaction history available for this property.
3 WARING TERRACE, SR7 8ES, Deneside Seaham
This is a 45 square meter Semi-detached Bungalow with an EPC rating of D. Currently, there is no transaction history available for this property.
Transport near SR7 8ES, Waring Terrace

House price paid reports for SR7 8ES, Waring Terrace
Click on the buttons below to see price paid reports by year or property price:
- Price Paid By Year
Property Price Paid in SR7 8ES, Waring Terrace by Year
The average sold property price by year was:
| Year | Average Sold Price | Price Change |
Sold Properties
|
|---|---|---|---|
| 2019 | £140,000 | 38% |
1 Property |
| 2015 | £87,000 | -50% |
1 Property |
| 2013 | £130,250 | 46% |
2 Properties |
| 2000 | £70,000 | - |
1 Property |