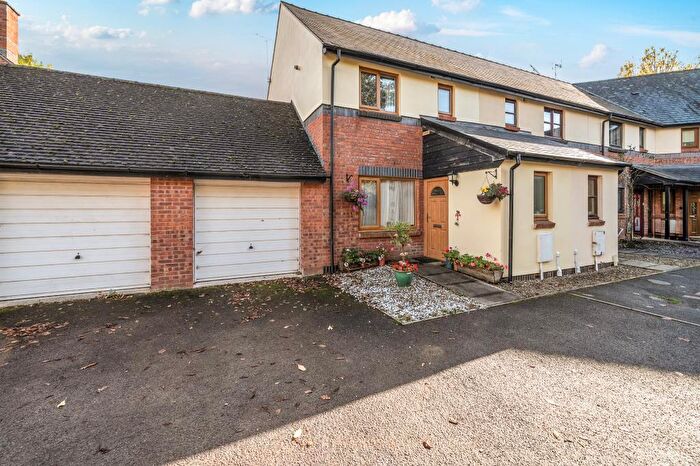
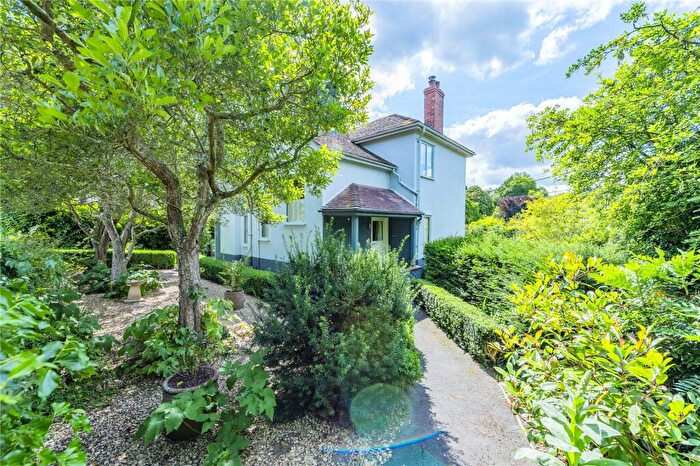
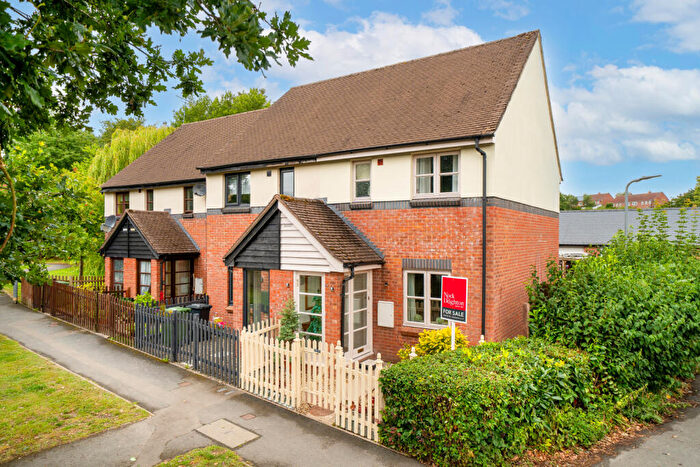
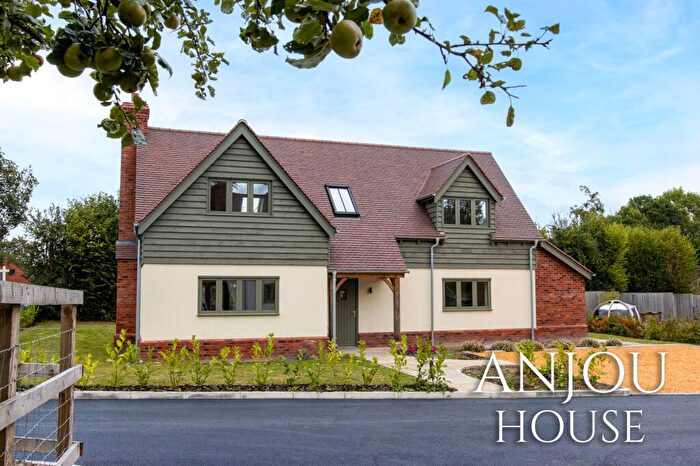
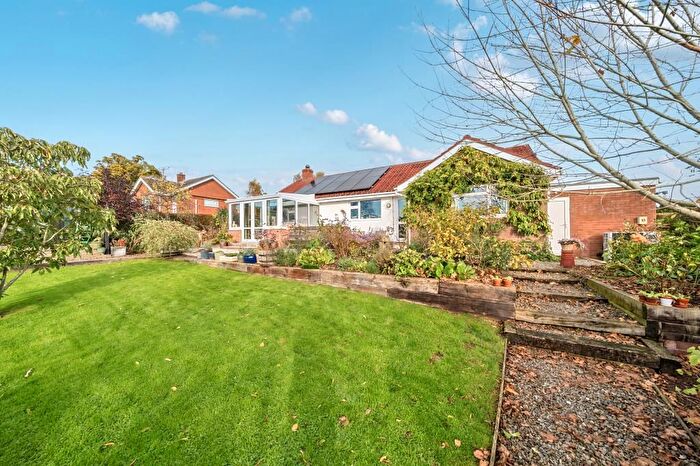
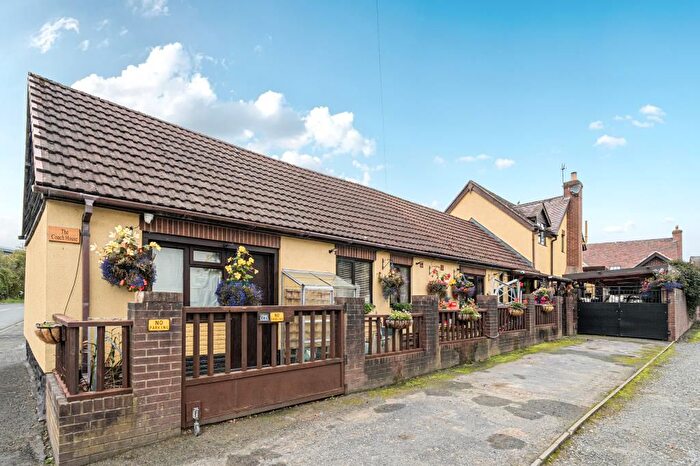
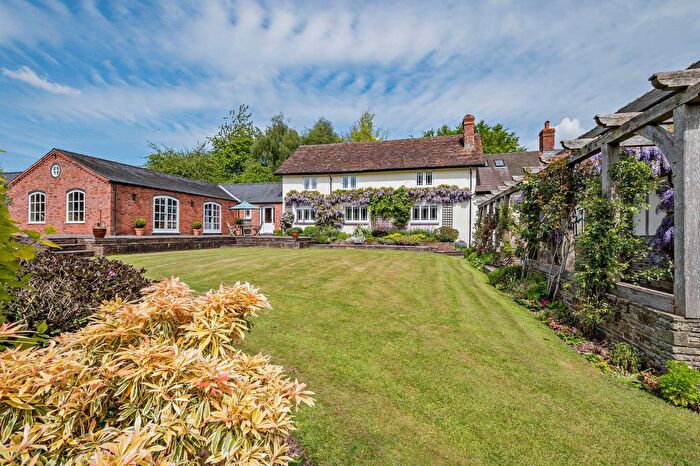
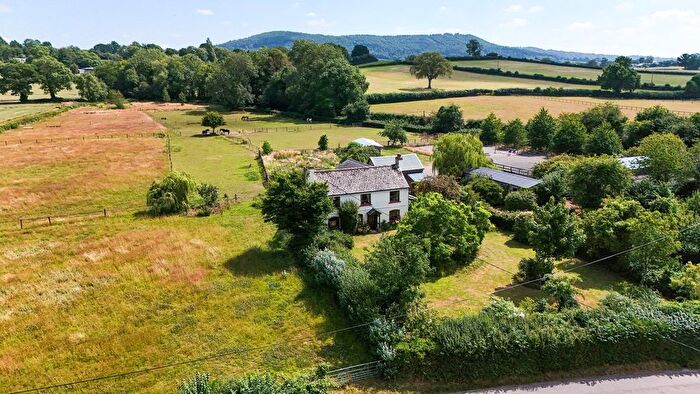
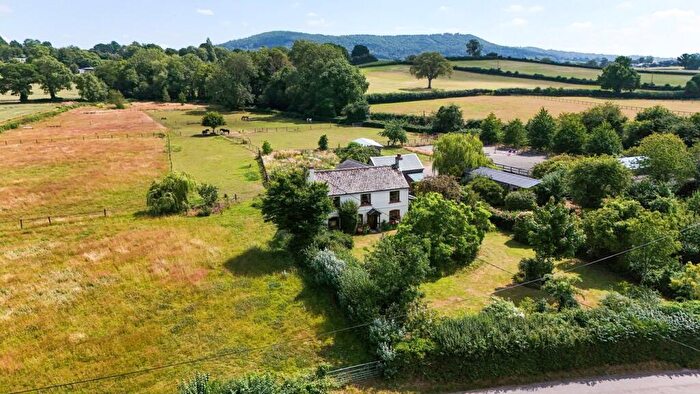
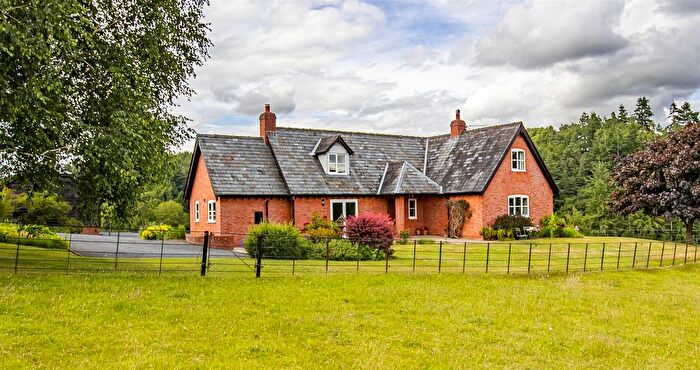
Houses for sale & to rent in Mortimer, Bucknell
House Prices in Mortimer
Properties in Mortimer have an average house price of £458,352.00 and had 17 Property Transactions within the last 3 years¹.
Mortimer is an area in Bucknell, County of Herefordshire with 194 households², where the most expensive property was sold for £650,000.00.
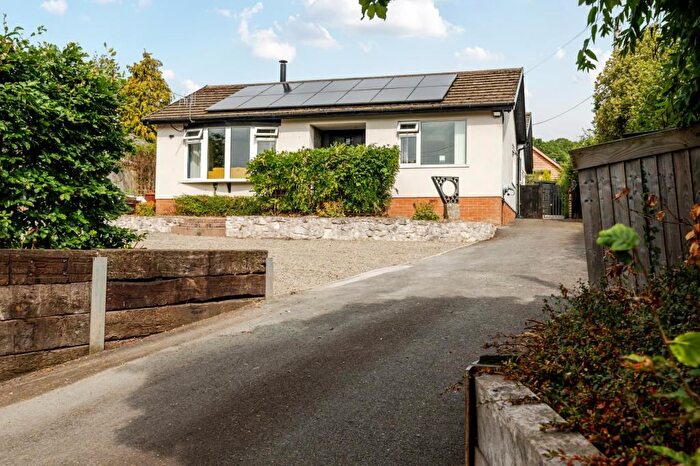
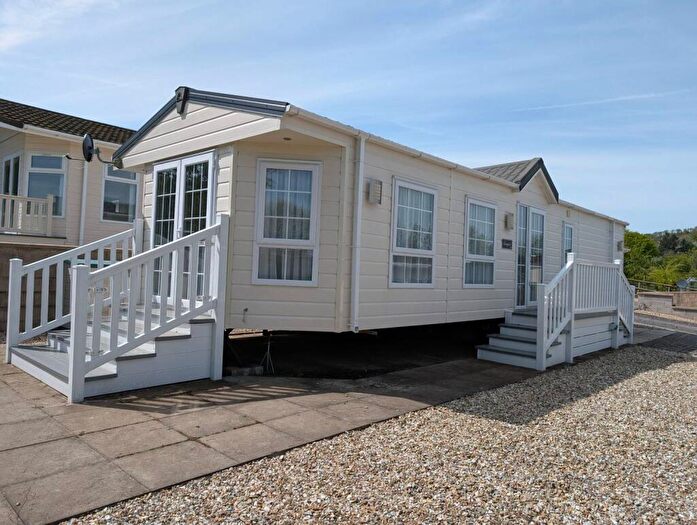
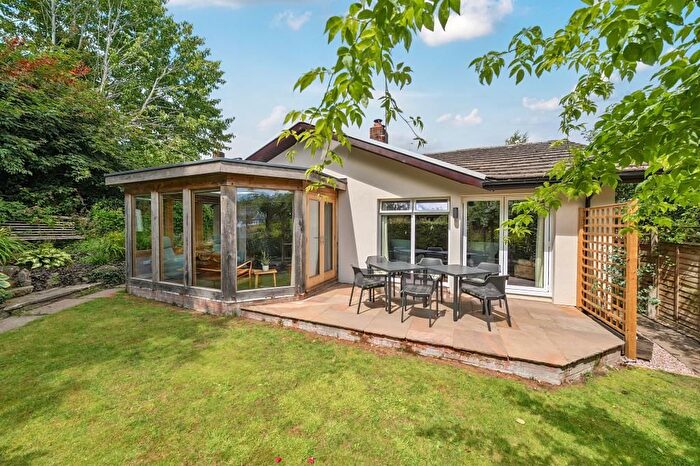
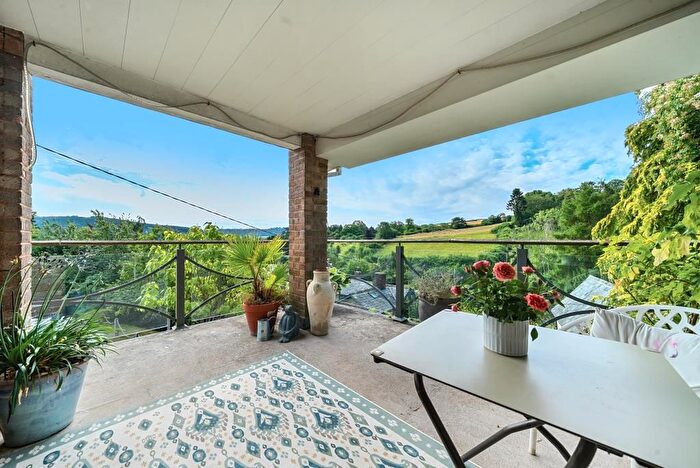
Properties for sale in Mortimer
Previously listed properties in Mortimer
Roads and Postcodes in Mortimer
Navigate through our locations to find the location of your next house in Mortimer, Bucknell for sale or to rent.
| Streets | Postcodes |
|---|---|
| Adforton | SY7 0NE SY7 0NG |
| Deerfold | SY7 0EE SY7 0EF |
| High Street | SY7 0LH |
| Lowe Croft | SY7 0NP |
| Oak Brook Meadow | SY7 0ET |
| Park Lane | SY7 0BF |
| Plough Meadow | SY7 0QN |
| Roman Close | SY7 0EH |
| Toddings | SY7 0LX |
| SY7 0BQ SY7 0DG SY7 0DH SY7 0DT SY7 0DX SY7 0DY SY7 0DZ SY7 0ED SY7 0DL SY7 0DN SY7 0DP SY7 0DR SY7 0DS SY7 0DW SY7 0EA SY7 0EB SY7 0EP SY7 0ER SY7 0JR SY7 0NL |
Transport near Mortimer
-
Bucknell Station
-
Hopton Heath Station
-
Knighton Station
-
Broome Station
-
Craven Arms Station
-
Knucklas Station
-
Ludlow Station
- FAQ
- Price Paid By Year
- Property Type Price
Frequently asked questions about Mortimer
What is the average price for a property for sale in Mortimer?
The average price for a property for sale in Mortimer is £458,352. There are 125 property listings for sale in Mortimer.
Which train stations are available in or near Mortimer?
Some of the train stations available in or near Mortimer are Bucknell, Hopton Heath and Knighton.
Property Price Paid in Mortimer by Year
The average sold property price by year was:
| Year | Average Sold Price | Price Change |
Sold Properties
|
|---|---|---|---|
| 2025 | £546,666 | 40% |
3 Properties |
| 2024 | £327,666 | -52% |
3 Properties |
| 2023 | £497,200 | 10% |
5 Properties |
| 2022 | £447,166 | 3% |
6 Properties |
| 2021 | £433,111 | 65% |
9 Properties |
| 2020 | £150,000 | -87% |
1 Property |
| 2019 | £279,999 | -15% |
7 Properties |
| 2018 | £322,654 | -18% |
9 Properties |
| 2017 | £379,278 | 42% |
7 Properties |
| 2015 | £220,000 | -19% |
1 Property |
| 2014 | £261,000 | 10% |
1 Property |
| 2013 | £235,666 | 24% |
3 Properties |
| 2012 | £178,000 | -104% |
1 Property |
| 2010 | £363,750 | 4% |
4 Properties |
| 2009 | £347,932 | 15% |
4 Properties |
| 2007 | £295,249 | -31% |
6 Properties |
| 2006 | £386,500 | 34% |
5 Properties |
| 2005 | £256,000 | -59% |
2 Properties |
| 2004 | £406,666 | 57% |
3 Properties |
| 2003 | £175,625 | -17% |
4 Properties |
| 2002 | £205,812 | 43% |
8 Properties |
| 2001 | £118,333 | -4% |
6 Properties |
| 2000 | £123,550 | 10% |
4 Properties |
| 1999 | £111,000 | -6% |
5 Properties |
| 1998 | £117,333 | 26% |
3 Properties |
| 1997 | £86,500 | -10% |
2 Properties |
| 1996 | £95,000 | -48% |
1 Property |
| 1995 | £141,000 | - |
2 Properties |
Property Price per Property Type in Mortimer
Here you can find historic sold price data in order to help with your property search.
The average Property Paid Price for specific property types in the last three years are:
| Property Type | Average Sold Price | Sold Properties |
|---|---|---|
| Semi Detached House | £318,000.00 | 3 Semi Detached Houses |
| Terraced House | £638,333.00 | 3 Terraced Houses |
| Detached House | £447,545.00 | 11 Detached Houses |

