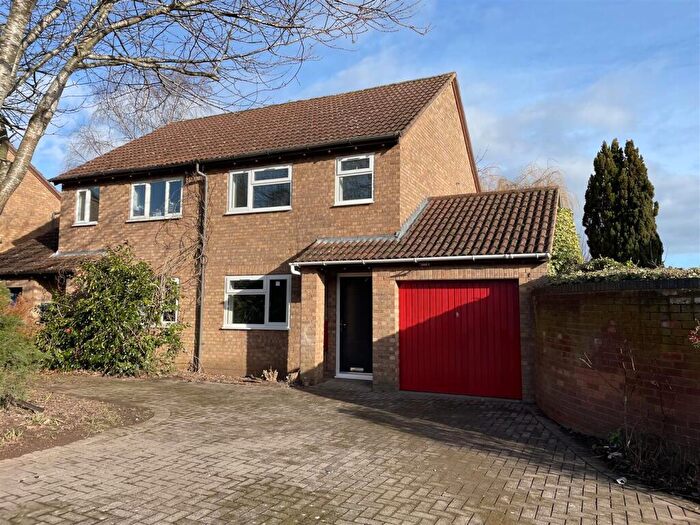
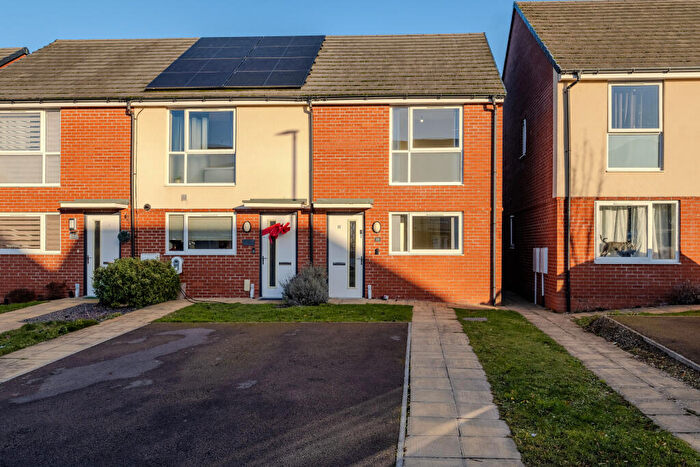
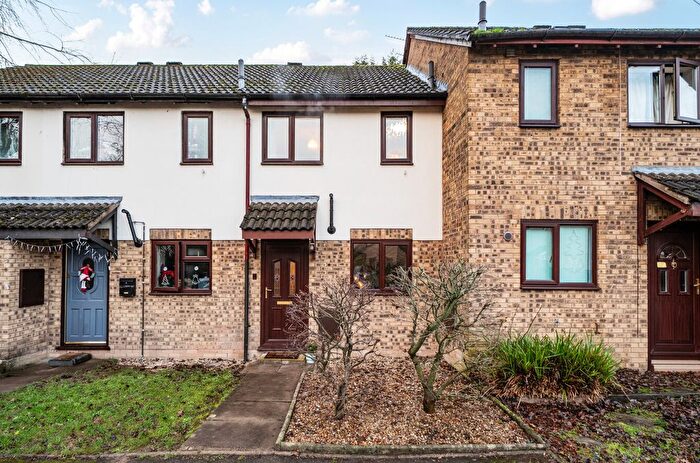
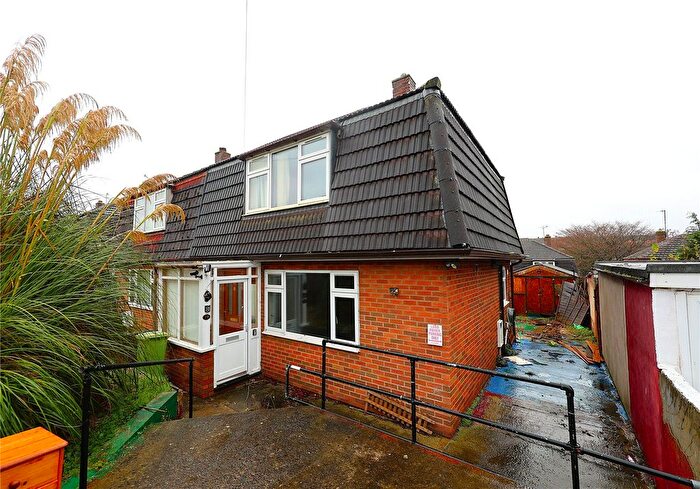
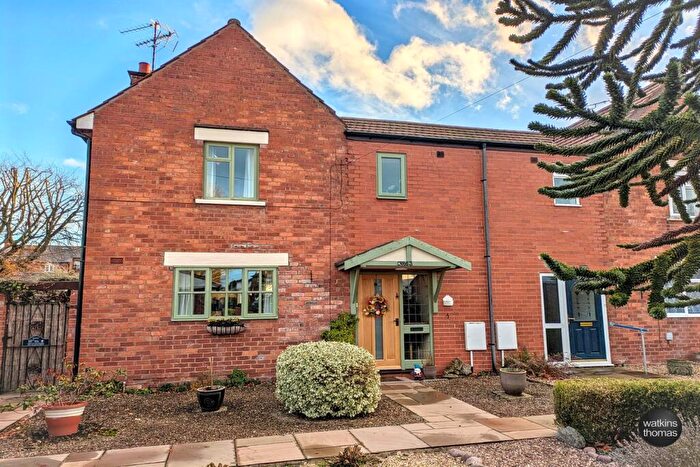
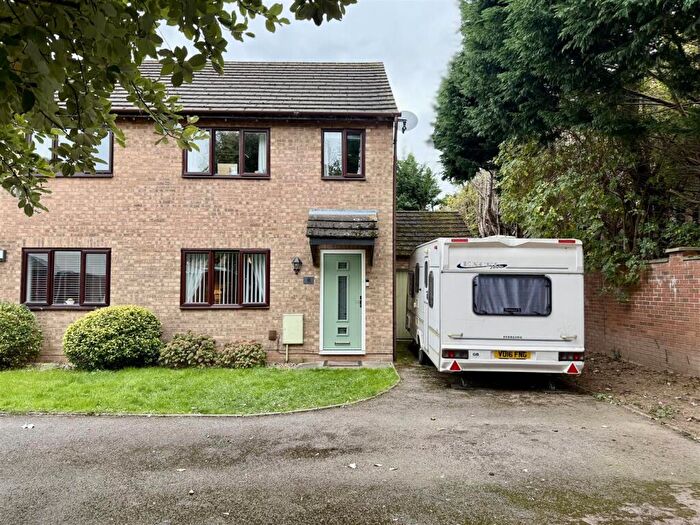
Houses for sale & to rent in Belmont, Hereford
House Prices in Belmont
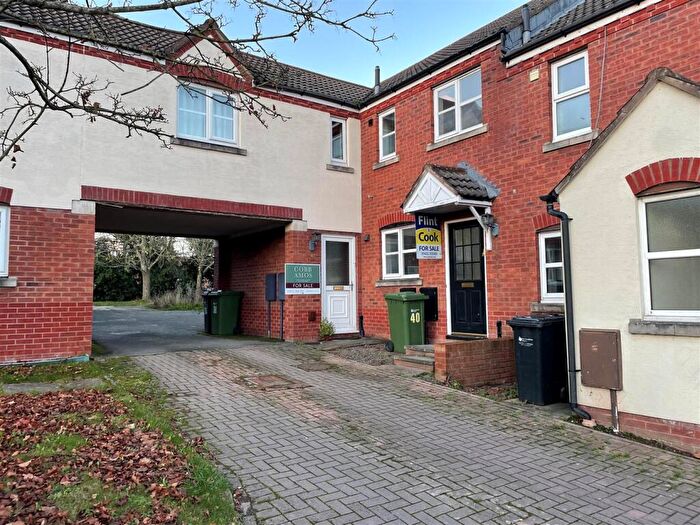
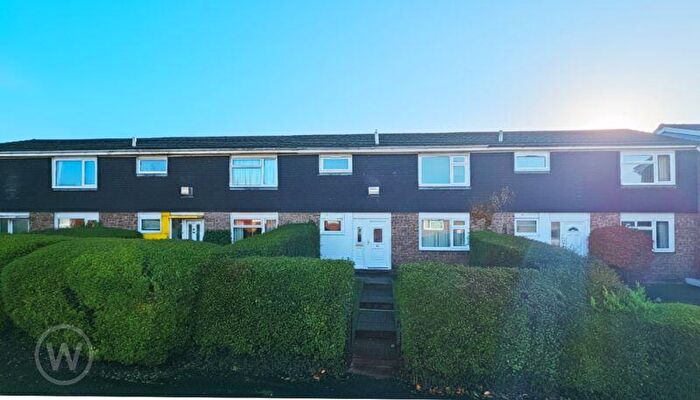
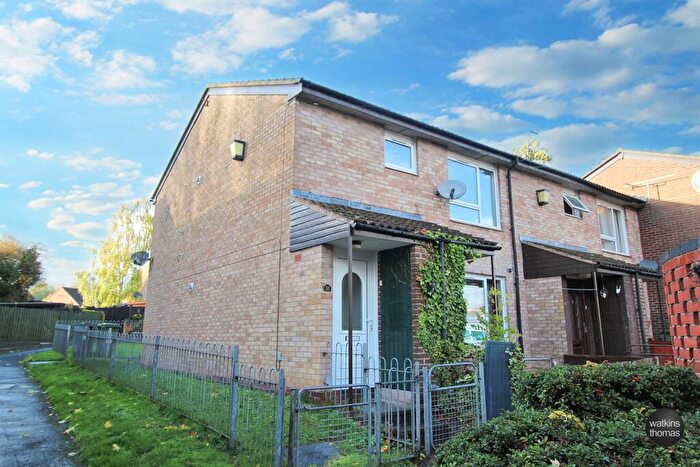
Properties in Belmont have an average house price of £225,008.00 and had 369 Property Transactions within the last 3 years¹.
Belmont is an area in Hereford, County of Herefordshire with 3,797 households², where the most expensive property was sold for £490,000.00.
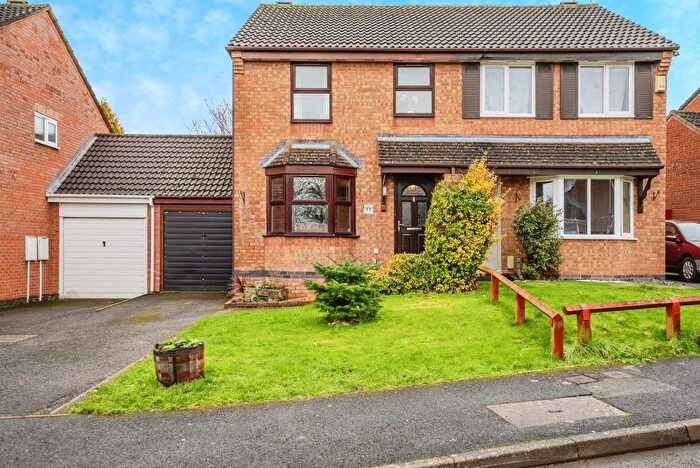
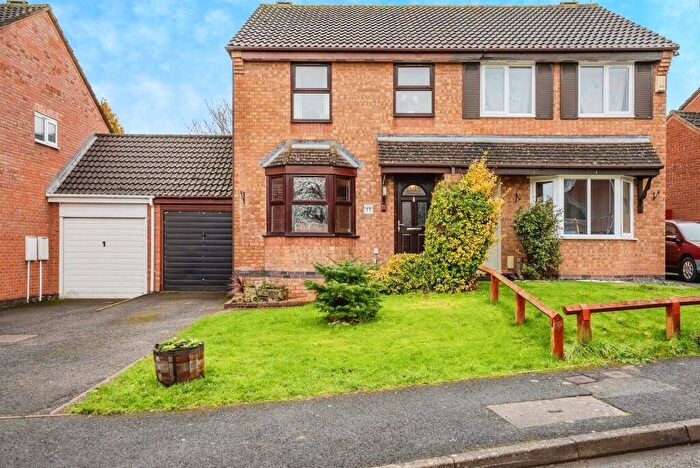
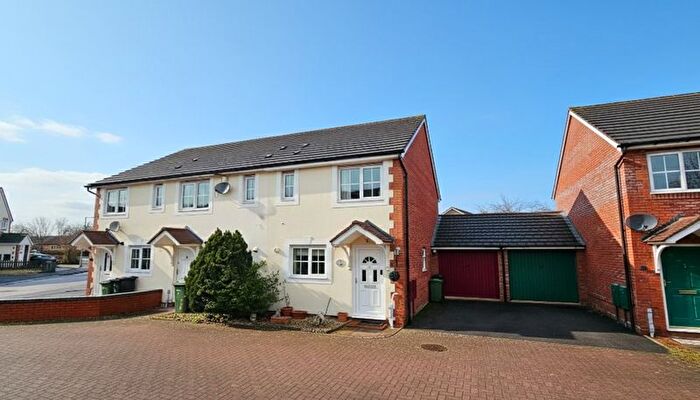
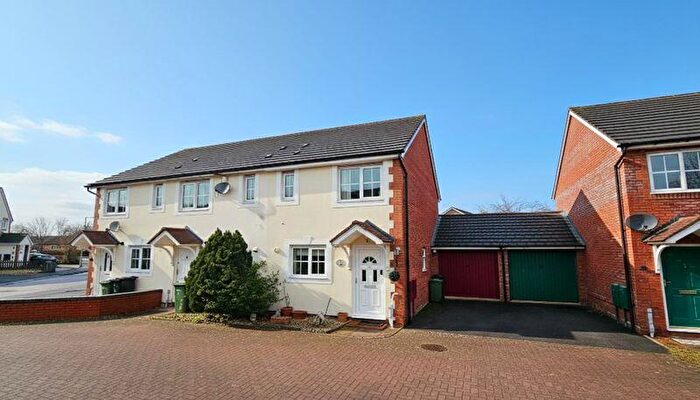
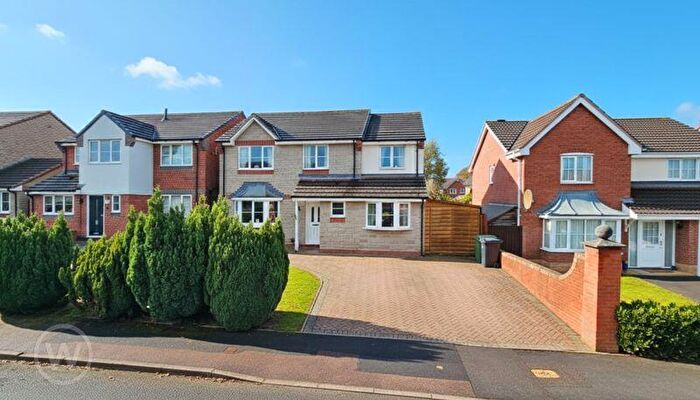
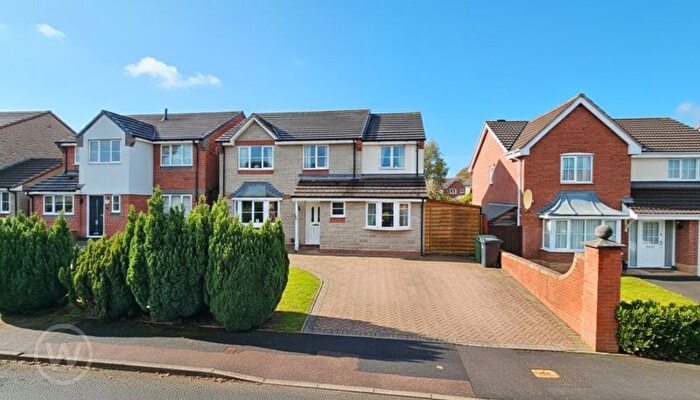
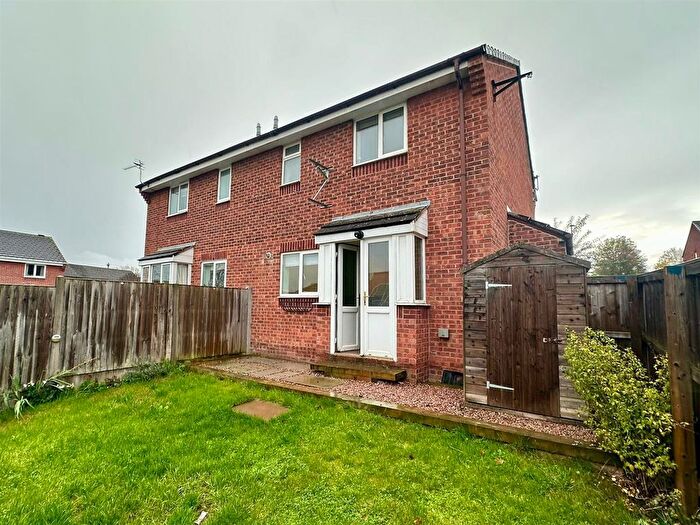
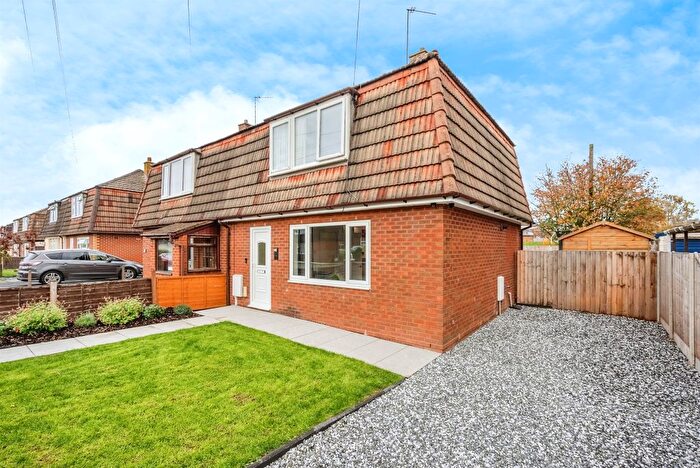
Properties for sale in Belmont
Roads and Postcodes in Belmont
Navigate through our locations to find the location of your next house in Belmont, Hereford for sale or to rent.
| Streets | Postcodes |
|---|---|
| Abbotsmead Road | HR2 7SH |
| Abingdon Drive | HR2 7YY |
| Almeley Close | HR2 7EQ |
| Amesbury Close | HR2 7YJ |
| Argyll Rise | HR2 7BN |
| Arundel Close | HR2 7ST |
| Atherstone Close | HR2 7ZE |
| Barons Mead | HR2 7EP |
| Beattie Avenue | HR2 7BS HR2 7BT HR2 7BU |
| Belmont Road | HR2 7HA HR2 7HD HR2 7HE |
| Belvoir Court | HR2 7SJ |
| Benedict Close | HR2 7XP |
| Blackmarston Road | HR2 7AJ HR2 7AL HR2 7AQ |
| Blackthorn Close | HR2 7XU |
| Blakemore Close | HR2 7HZ |
| Bodmin Close | HR2 7ZB |
| Boxgrove | HR2 7YF |
| Brampton Road | HR2 7DE HR2 7DF HR2 7DG HR2 7DH HR2 7DJ HR2 7DQ |
| Bredwardine Close | HR2 7DR |
| Broadholme Road | HR2 7SS |
| Brobury Close | HR2 7JB |
| Bronsil Close | HR2 7ED |
| Brook Farm Court | HR2 7TY HR2 7TZ |
| Buckfast Close | HR2 7XL |
| Byland Close | HR2 7SQ |
| Cagebrook Avenue | HR2 7AS |
| Canterbury Close | HR2 7UN |
| Carr Lane | HR2 7HU |
| Carwardine Green | HR2 7ER |
| Cedar Avenue | HR2 7GD HR2 7GE |
| Chancel View | HR2 7XD |
| Chantry Court | HR2 7YQ |
| Charles Witts Avenue | HR2 7BB HR2 7BD |
| Charlton Avenue | HR2 7HP |
| Chichester Close | HR2 7YU |
| Coppin Rise | HR2 7UE |
| Cottonwoods | HR2 7UR |
| Cradley Close | HR2 7TE |
| Cranborne Close | HR2 7SY |
| Croft Close | HR2 7DL |
| Curlew Close | HR2 7TR |
| Cusop Close | HR2 7EF |
| Deerhurst Drive | HR2 7XX |
| Dorchester Way | HR2 7ZL HR2 7ZN HR2 7ZP HR2 7ZW |
| Dunoon Mead | HR2 7BL |
| Dunster Close | HR2 7XG |
| Eardisley Close | HR2 7EH |
| Eastholme Avenue | HR2 7UH HR2 7UQ |
| Eric Brown Close | HR2 7FD |
| Ethelstan Crescent | HR2 7HR HR2 7HS |
| Farringdon Avenue | HR2 7ZH |
| Field Farm Mews | HR2 7UD |
| Flaxley Drive | HR2 7XQ |
| Forde Lane | HR2 7SR |
| Fountains Close | HR2 7XY |
| Glastonbury Close | HR2 7YL |
| Glenstall Close | HR2 7YE |
| Golden Post | HR2 7BZ HR2 7DA |
| Goodrich Grove | HR2 7DB |
| Grantham Close | HR2 7ZG |
| Green Ash Close | HR2 7UF |
| Grosmont Grove | HR2 7EG HR2 7TF |
| Hartland Close | HR2 7SL |
| Hay Lease Crescent | HR2 7AN |
| Heron Close | HR2 7TP |
| Holm Oak Road | HR2 7UP |
| Holmfirth Close | HR2 7UG |
| Hunderton Road | HR2 7AG HR2 7AP |
| John Tarrant Close | HR2 7JA |
| Kenilworth Close | HR2 7ZJ |
| Kestrel Road | HR2 7TN |
| Kilpeck Avenue | HR2 7DS HR2 7DT |
| Kilvert Road | HR2 7HL HR2 7HN HR2 7HW |
| Kingfisher Road | HR2 7TH |
| Kinnersley Close | HR2 7DY |
| Lewis Smith Avenue | HR2 7BG |
| Linnet Close | HR2 7TJ |
| Luard Walk | HR2 7BA |
| Ludlow Place | HR2 7EB |
| Maidstone Close | HR2 7HY |
| Marcle Walk | HR2 7TD |
| Masefield Avenue | HR2 7HT |
| Merryhill Crescent | HR2 7AH |
| Millard Close | HR2 7EW |
| Minster Court | HR2 7YG |
| Monkscroft Drive | HR2 7XB |
| Morville Close | HR2 7UY |
| Muir Close | HR2 7EX |
| Mulberry Close | HR2 7UT |
| Northolme Road | HR2 7SP |
| Oban Way | HR2 7EZ |
| Old Tram Road | HR2 7AW |
| Oulton Avenue | HR2 7YX |
| Pixley Walk | HR2 7TA HR2 7TB |
| Plover Close | HR2 7TS |
| Powys Walk | HR2 7DX |
| Prinknash Close | HR2 7XA |
| Priory View | HR2 7XH |
| Raglan Place | HR2 7DU |
| Raven Walk | HR2 7TL |
| Redwing Walk | HR2 7TW |
| Rochester Court | HR2 7XW |
| Rogers Avenue | HR2 7BQ |
| Romsey Drive | HR2 7YH |
| Rosedale Close | HR2 7ZD |
| Rothesay Mead | HR2 7BJ |
| Rowan Tree Close | HR2 7UW |
| Ruckhall Lane | HR2 9SA |
| Shellingham Way | HR2 7SN |
| Sherborne Close | HR2 7ET HR2 7EU |
| Silver Fir Close | HR2 7SU |
| Skenfrith Walk | HR2 7DP |
| St Augustines Court | HR2 7YB |
| St Becketts Mews | HR2 7YW |
| St Gregorys Court | HR2 7YA |
| St Theodors Court | HR2 7YN |
| Stanbrook Road | HR2 7ZA |
| Stoneleigh Drive | HR2 7YZ |
| Sycamore Avenue | HR2 7GA HR2 7GB |
| Sydwall Road | HR2 7XJ HR2 7XR |
| Tavistock Drive | HR2 7XN |
| The Meadows | HR2 9RR |
| The Oval | HR2 7HG |
| Tintern Close | HR2 7US |
| Treago Grove | HR2 7EE |
| Trilleck Avenue | HR2 7HX |
| Vaga Close | HR2 7BH |
| Vaga Street | HR2 7AT |
| Villa Street | HR2 7AU HR2 7AX HR2 7AY |
| Wallis Avenue | HR2 7AZ |
| Waterfield Road | HR2 7DD HR2 7EL HR2 7EN HR2 7ES HR2 7EY |
| Wenlock Close | HR2 7UZ |
| Weobley Close | HR2 7EJ |
| Westholme Road | HR2 7SX HR2 7UJ |
| Wheatridge Road | HR2 7UL |
| Whitecastle Close | HR2 7EA |
| Whitefriars Road | HR2 7XE HR2 7XF |
| Wigmore Grove | HR2 7DW |
| Wilton Avenue | HR2 7DN |
| Wye Dean Rise | HR2 7XZ |
| Yarlington Mill | HR2 7UA HR2 7UB |
| HR2 9RS |
Transport near Belmont
- FAQ
- Price Paid By Year
- Property Type Price
Frequently asked questions about Belmont
What is the average price for a property for sale in Belmont?
The average price for a property for sale in Belmont is £225,008. This amount is 28% lower than the average price in Hereford. There are 789 property listings for sale in Belmont.
What streets have the most expensive properties for sale in Belmont?
The streets with the most expensive properties for sale in Belmont are The Meadows at an average of £437,500, Broadholme Road at an average of £394,000 and Deerhurst Drive at an average of £392,750.
What streets have the most affordable properties for sale in Belmont?
The streets with the most affordable properties for sale in Belmont are Rochester Court at an average of £93,500, Chantry Court at an average of £97,500 and St Theodors Court at an average of £107,250.
Which train stations are available in or near Belmont?
Some of the train stations available in or near Belmont are Hereford, Leominster and Ledbury.
Property Price Paid in Belmont by Year
The average sold property price by year was:
| Year | Average Sold Price | Price Change |
Sold Properties
|
|---|---|---|---|
| 2025 | £242,102 | 8% |
68 Properties |
| 2024 | £221,953 | -2% |
113 Properties |
| 2023 | £225,635 | 4% |
84 Properties |
| 2022 | £216,644 | 10% |
104 Properties |
| 2021 | £194,635 | 1% |
146 Properties |
| 2020 | £192,330 | 4% |
93 Properties |
| 2019 | £185,355 | 4% |
114 Properties |
| 2018 | £178,004 | 4% |
105 Properties |
| 2017 | £170,687 | 2% |
134 Properties |
| 2016 | £166,436 | 7% |
136 Properties |
| 2015 | £154,463 | 7% |
155 Properties |
| 2014 | £143,219 | -0,3% |
146 Properties |
| 2013 | £143,678 | -2% |
117 Properties |
| 2012 | £146,361 | -4% |
100 Properties |
| 2011 | £152,538 | 5% |
101 Properties |
| 2010 | £145,518 | 0,3% |
112 Properties |
| 2009 | £145,137 | -3% |
75 Properties |
| 2008 | £149,436 | -1% |
89 Properties |
| 2007 | £151,289 | 4% |
190 Properties |
| 2006 | £145,984 | 7% |
232 Properties |
| 2005 | £136,208 | 3% |
166 Properties |
| 2004 | £132,141 | 10% |
229 Properties |
| 2003 | £118,532 | 18% |
278 Properties |
| 2002 | £97,215 | 16% |
363 Properties |
| 2001 | £81,218 | 13% |
360 Properties |
| 2000 | £70,588 | 21% |
274 Properties |
| 1999 | £55,827 | 2% |
282 Properties |
| 1998 | £54,911 | 4% |
242 Properties |
| 1997 | £52,647 | 3% |
217 Properties |
| 1996 | £50,839 | -3% |
222 Properties |
| 1995 | £52,526 | - |
228 Properties |
Property Price per Property Type in Belmont
Here you can find historic sold price data in order to help with your property search.
The average Property Paid Price for specific property types in the last three years are:
| Property Type | Average Sold Price | Sold Properties |
|---|---|---|
| Flat | £101,570.00 | 28 Flats |
| Semi Detached House | £219,007.00 | 69 Semi Detached Houses |
| Detached House | £325,028.00 | 101 Detached Houses |
| Terraced House | £188,566.00 | 171 Terraced Houses |

