
Houses for sale & to rent in Golden Valley South, Hereford
House Prices in Golden Valley South
Properties in Golden Valley South have an average house price of £450,285.00 and had 85 Property Transactions within the last 3 years¹.
Golden Valley South is an area in Hereford, County of Herefordshire with 1,291 households², where the most expensive property was sold for £2,260,000.00.
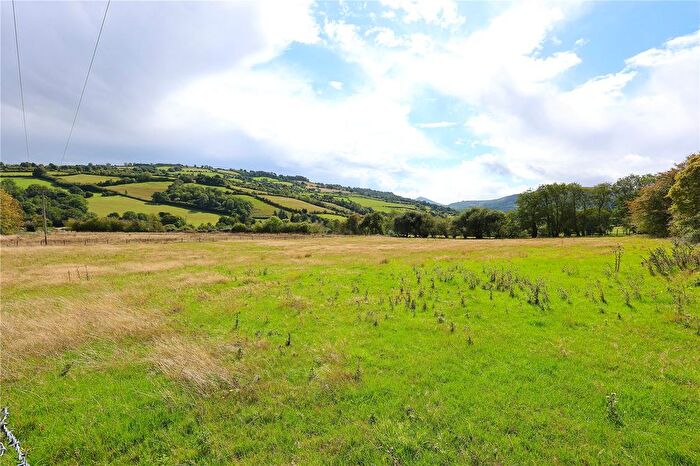
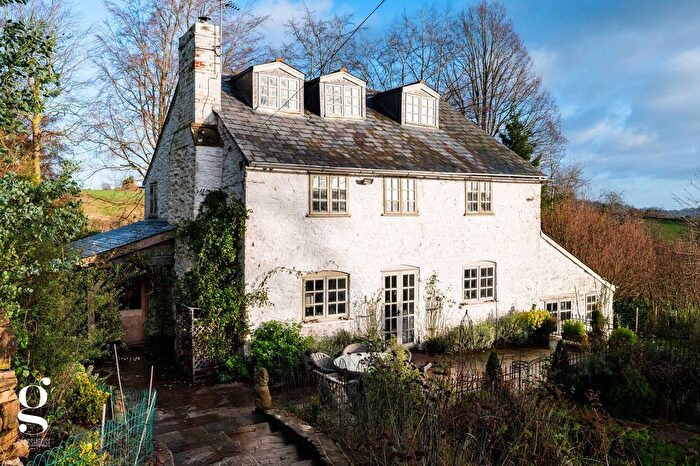
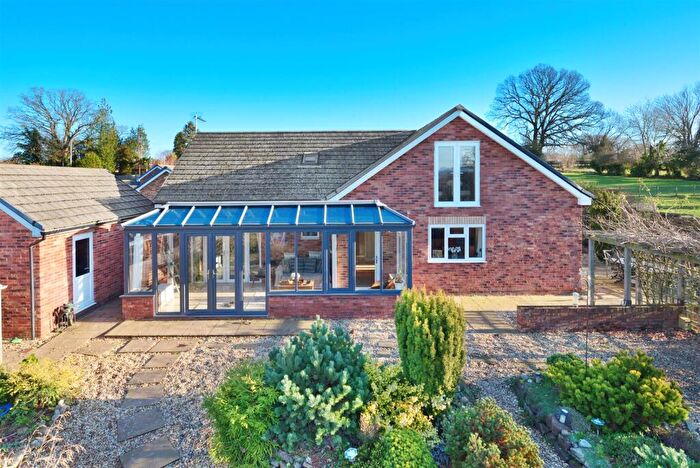
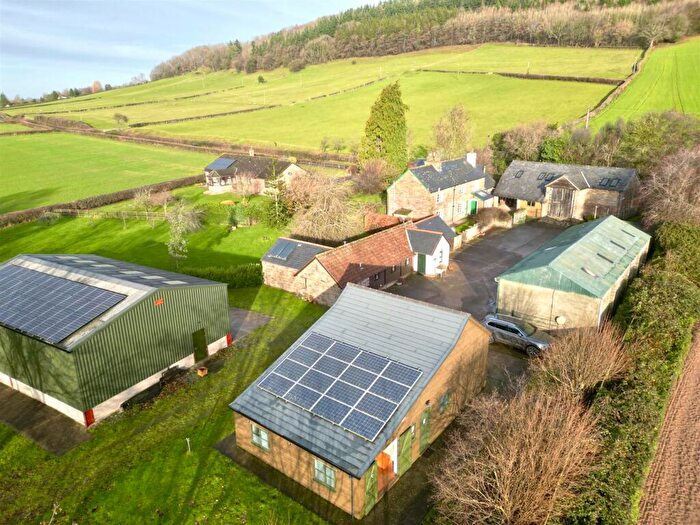
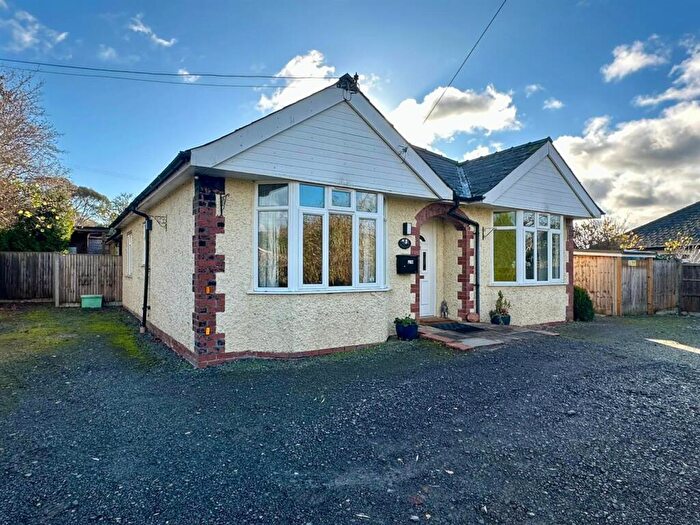
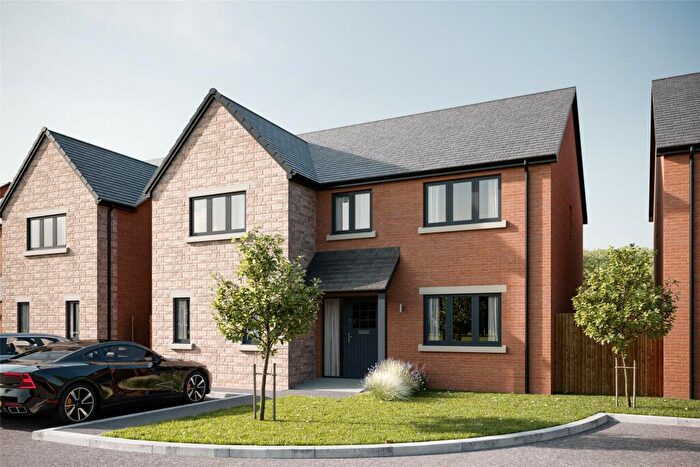
Properties for sale in Golden Valley South

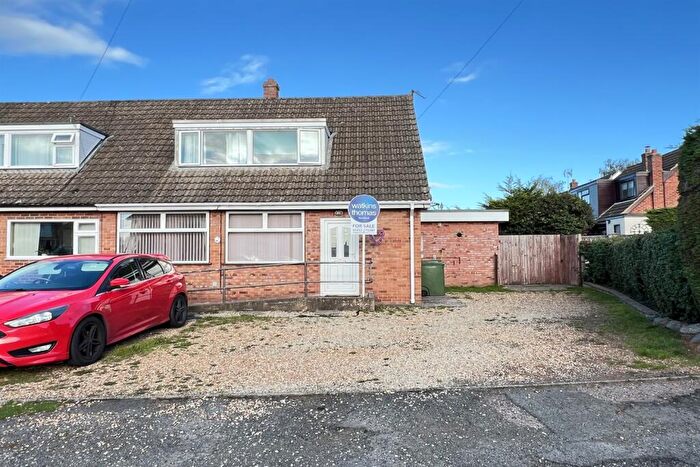
![]()
If you are looking to sell your house, let it out, or receive a property valuation, an expert can help you.
Click the button below to get started.

Roads and Postcodes in Golden Valley South
Navigate through our locations to find the location of your next house in Golden Valley South, Hereford for sale or to rent.
Transport near Golden Valley South
-
 Abergavenny Station
 -
Hereford Station
-
Ebbw Vale Town Station
-
Ebbw Vale Parkway Station
-
Pontypool and New Inn Station
-
Leominster Station
- FAQ
- Price Paid By Year
- Property Type Price
Frequently asked questions about Golden Valley South
What is the average price for a property for sale in Golden Valley South?
The average price for a property for sale in Golden Valley South is £450,285. This amount is 44% higher than the average price in Hereford. There are 1,336 property listings for sale in Golden Valley South.
What streets have the most expensive properties for sale in Golden Valley South?
The streets with the most expensive properties for sale in Golden Valley South are Turnastone at an average of £408,750, Wormbridge at an average of £390,000 and Priorsfield at an average of £320,000.
What streets have the most affordable properties for sale in Golden Valley South?
The streets with the most affordable properties for sale in Golden Valley South are Lion Terrace at an average of £174,750, Callowside at an average of £195,250 and Castle Terrace at an average of £218,000.
Which train stations are available in or near Golden Valley South?
Some of the train stations available in or near Golden Valley South are Abergavenny, Hereford and Ebbw Vale Town.
Property Price Paid in Golden Valley South by Year
The average sold property price by year was:
| Year | Average Sold Price | Price Change |
Sold Properties
|
|---|---|---|---|
| 2025 | £388,433 | -1% |
15 Properties |
| 2024 | £391,058 | -42% |
30 Properties |
| 2023 | £554,027 | 13% |
20 Properties |
| 2022 | £481,775 | 26% |
20 Properties |
| 2021 | £358,015 | -17% |
35 Properties |
| 2020 | £418,662 | 25% |
31 Properties |
| 2019 | £312,475 | -8% |
27 Properties |
| 2018 | £337,750 | 1% |
30 Properties |
| 2017 | £334,944 | 12% |
37 Properties |
| 2016 | £293,812 | -6% |
40 Properties |
| 2015 | £310,396 | -25% |
29 Properties |
| 2014 | £388,008 | 26% |
30 Properties |
| 2013 | £288,040 | 10% |
25 Properties |
| 2012 | £260,453 | 11% |
23 Properties |
| 2011 | £230,656 | -20% |
16 Properties |
| 2010 | £277,361 | -23% |
31 Properties |
| 2009 | £340,782 | -10% |
23 Properties |
| 2008 | £374,772 | 24% |
20 Properties |
| 2007 | £284,451 | 1% |
39 Properties |
| 2006 | £282,625 | 3% |
31 Properties |
| 2005 | £274,942 | -0,4% |
29 Properties |
| 2004 | £275,912 | 26% |
24 Properties |
| 2003 | £204,597 | 10% |
47 Properties |
| 2002 | £184,452 | 14% |
44 Properties |
| 2001 | £158,603 | 14% |
42 Properties |
| 2000 | £136,674 | 3% |
35 Properties |
| 1999 | £132,018 | 22% |
41 Properties |
| 1998 | £103,559 | 8% |
40 Properties |
| 1997 | £95,419 | 9% |
34 Properties |
| 1996 | £86,985 | 20% |
37 Properties |
| 1995 | £69,875 | - |
30 Properties |
Property Price per Property Type in Golden Valley South
Here you can find historic sold price data in order to help with your property search.
The average Property Paid Price for specific property types in the last three years are:
| Property Type | Average Sold Price | Sold Properties |
|---|---|---|
| Semi Detached House | £278,192.00 | 13 Semi Detached Houses |
| Detached House | £557,442.00 | 56 Detached Houses |
| Terraced House | £215,062.00 | 16 Terraced Houses |