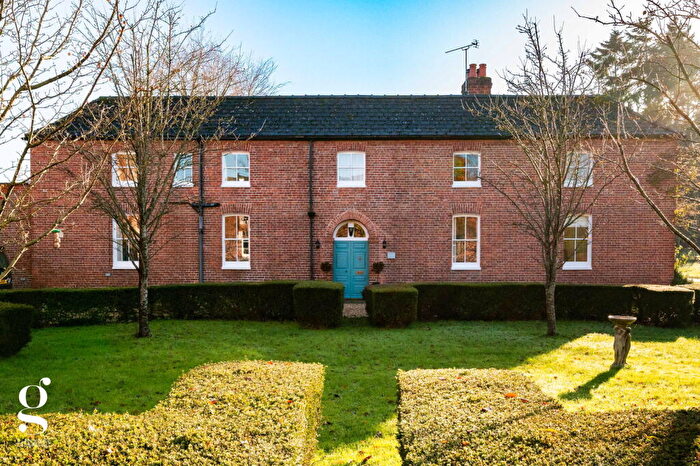
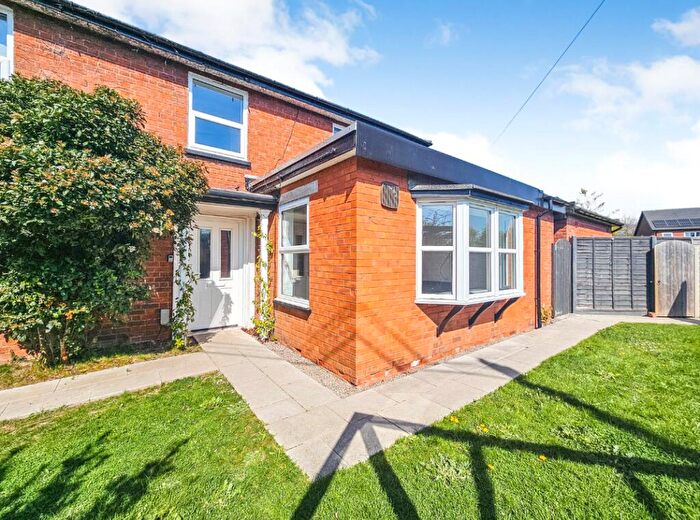
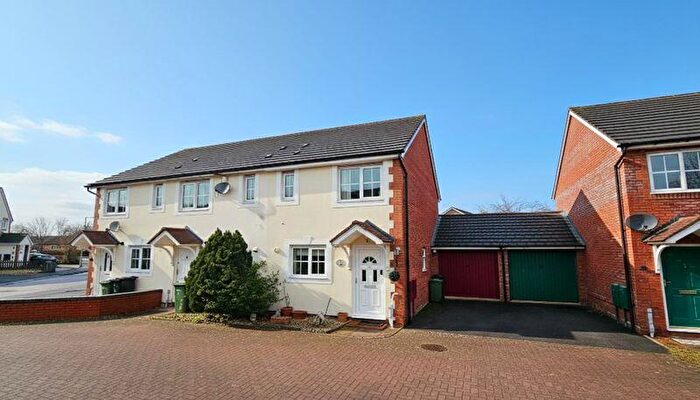
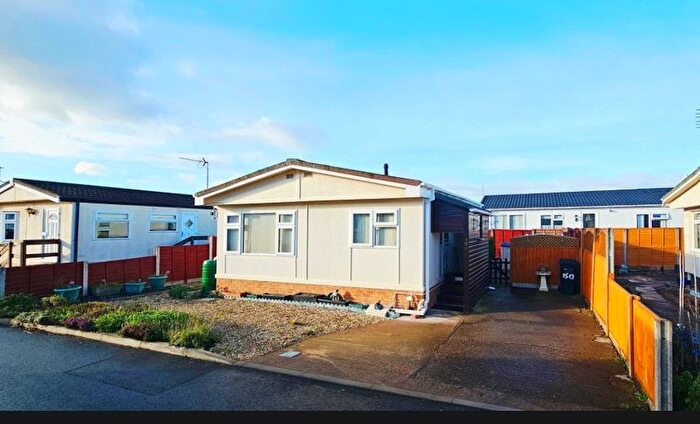
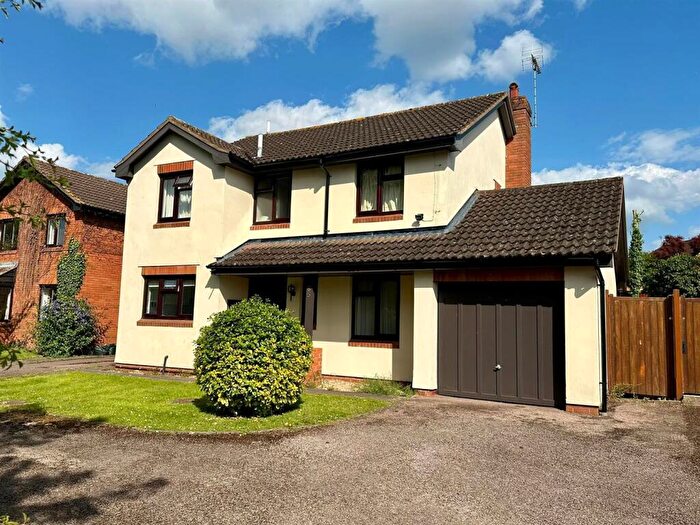
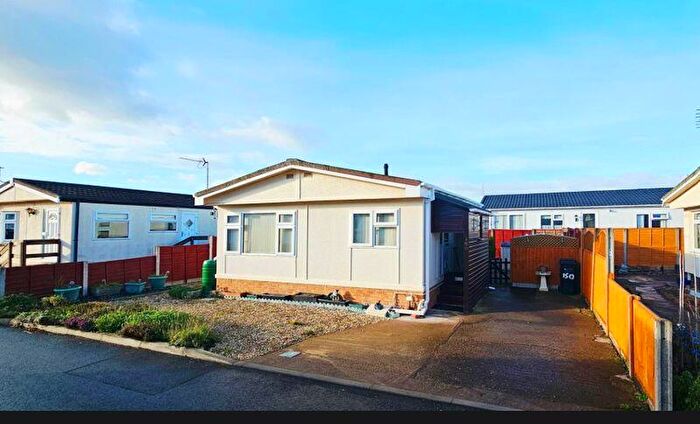
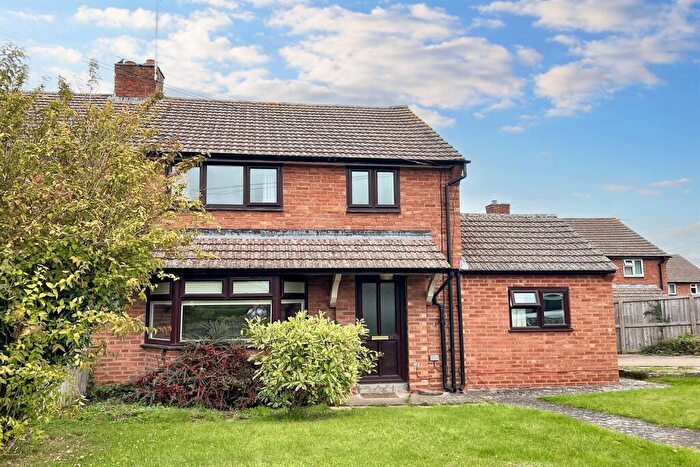
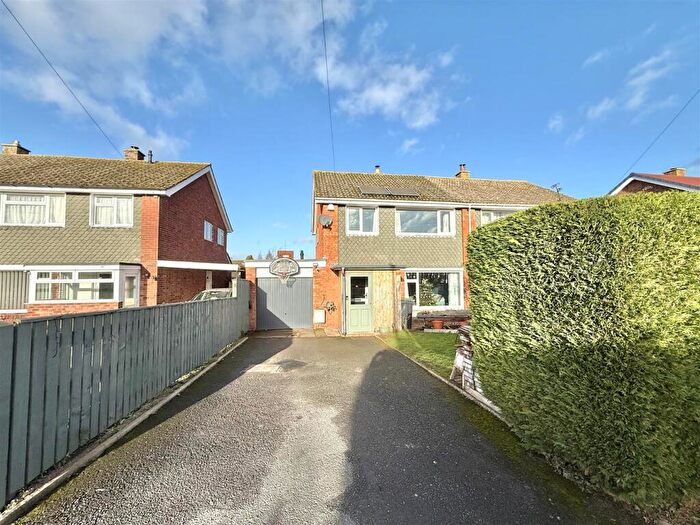
Houses for sale & to rent in Stoney Street, Hereford
House Prices in Stoney Street
Properties in Stoney Street have an average house price of £367,332.00 and had 136 Property Transactions within the last 3 years¹.
Stoney Street is an area in Hereford, County of Herefordshire with 1,237 households², where the most expensive property was sold for £1,575,000.00.
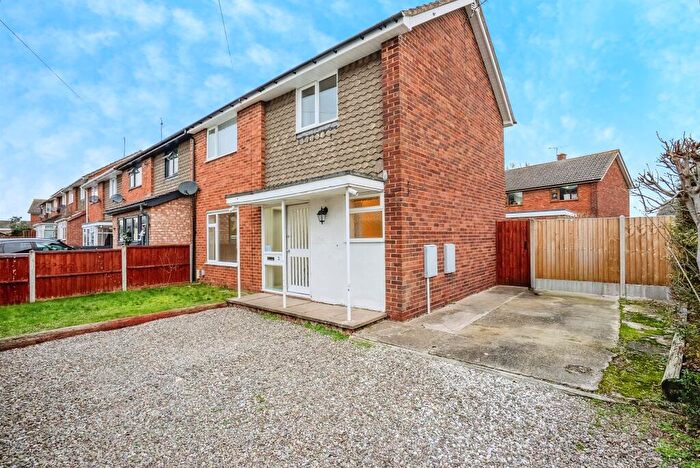
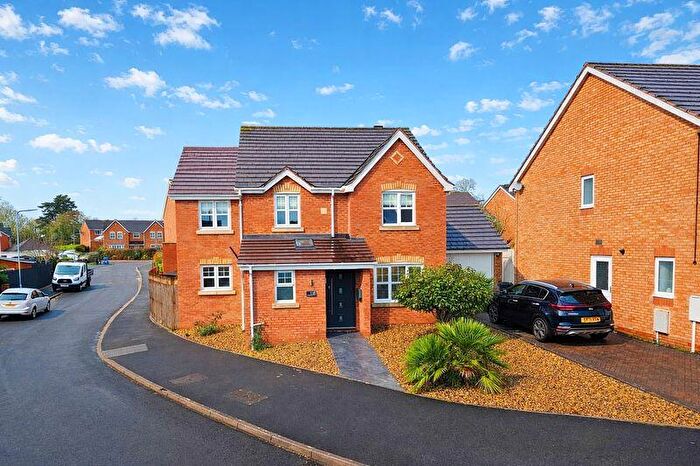
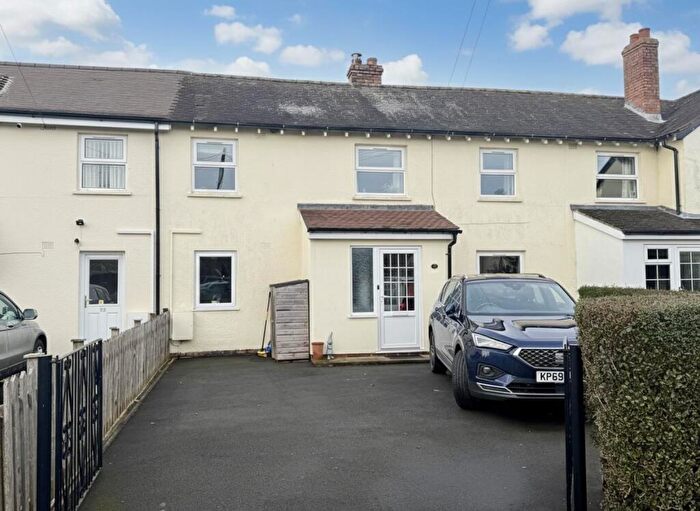
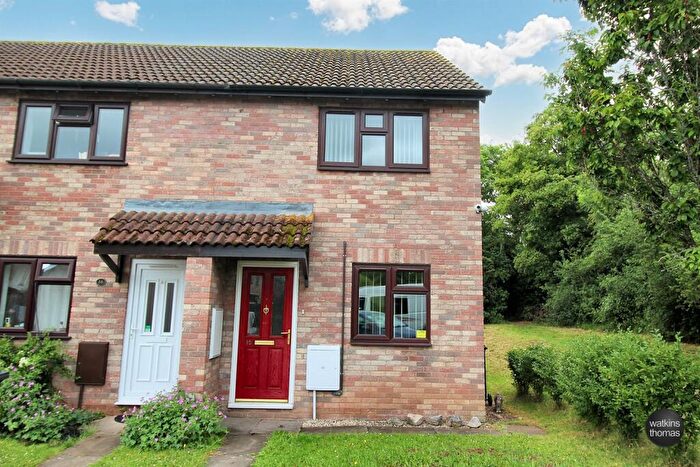
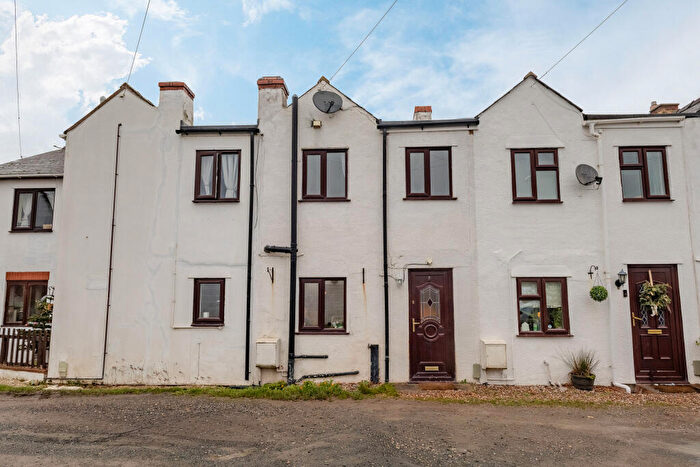
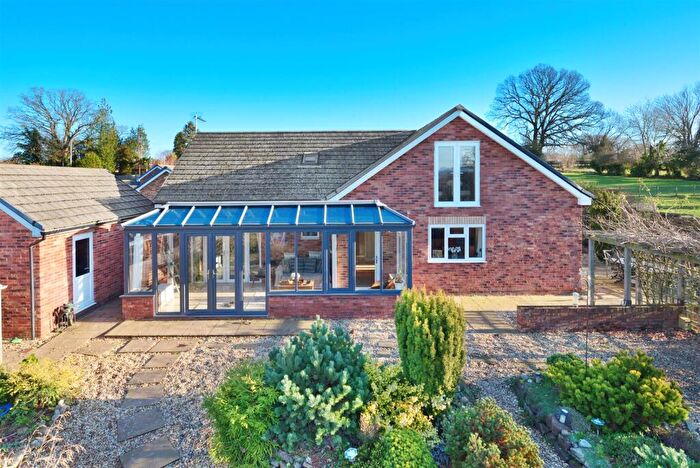
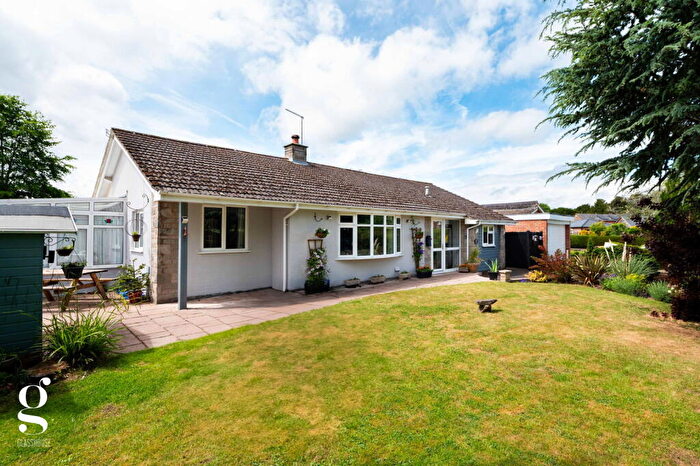
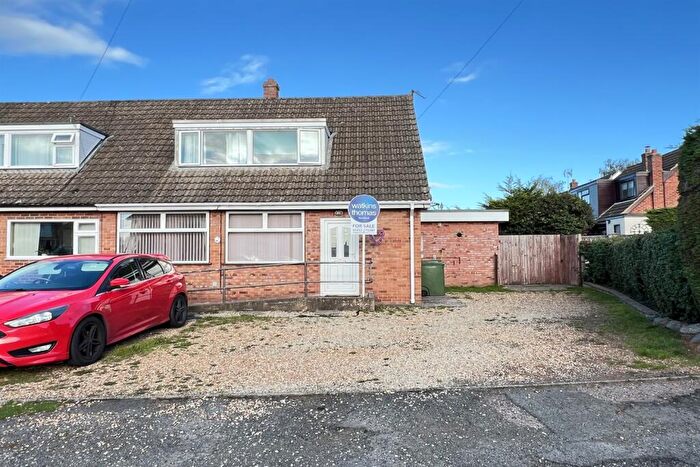
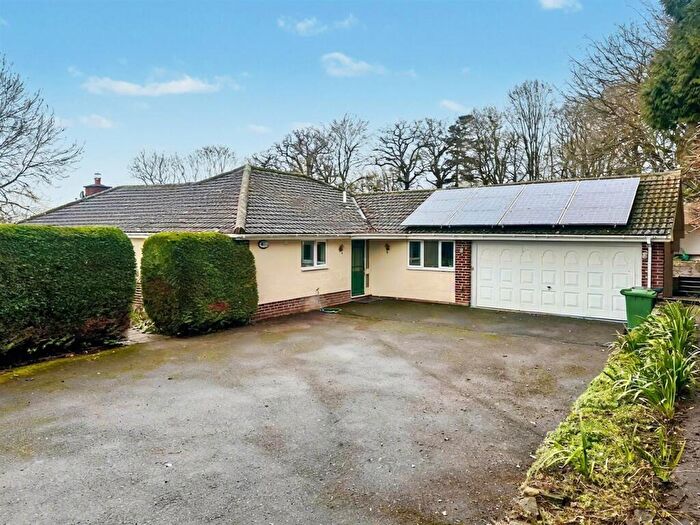
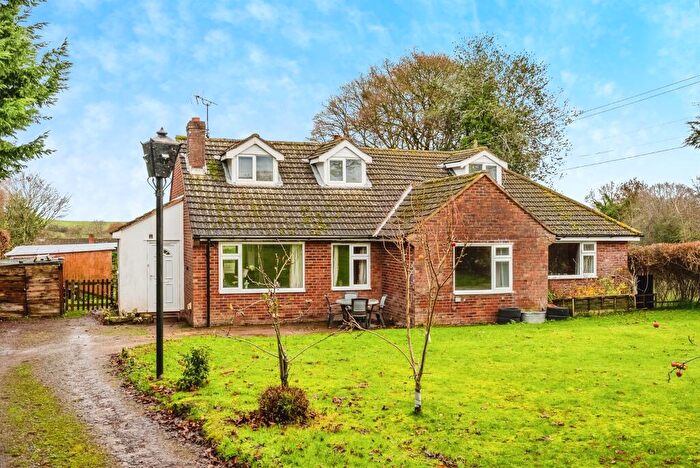
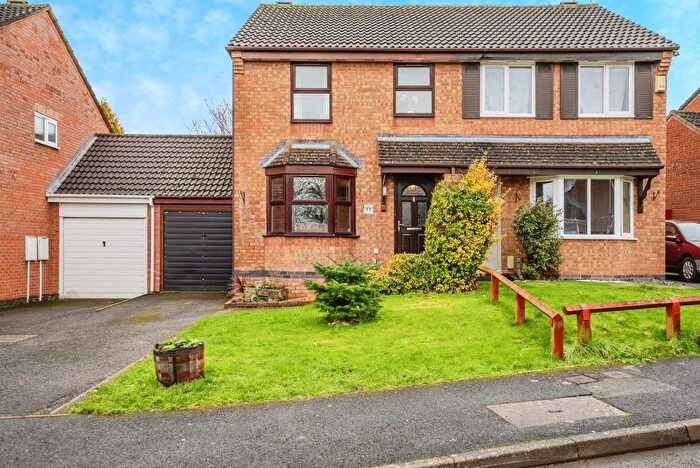
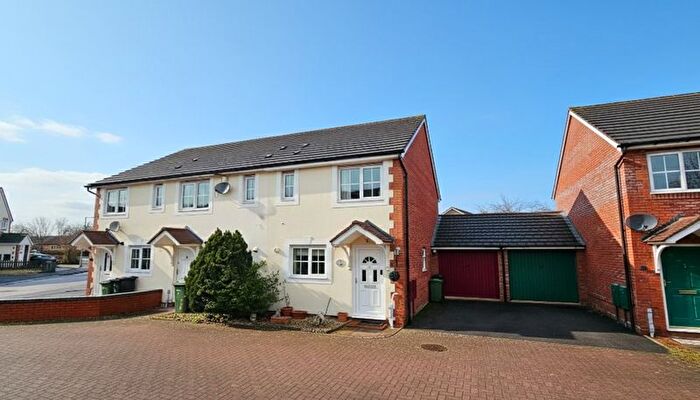
Properties for sale in Stoney Street
Roads and Postcodes in Stoney Street
Navigate through our locations to find the location of your next house in Stoney Street, Hereford for sale or to rent.
| Streets | Postcodes |
|---|---|
| Apple Tree Close | HR2 9TA |
| Archenfield | HR2 9NS |
| Bailey Close | HR2 9NW |
| Bentley Drive | HR2 9QY |
| Birch Hill | HR2 9SY |
| Birch Hill Road | HR2 9RD HR2 9RF |
| Birch Meadow | HR2 9RH |
| Brampton Road | HR2 9LX |
| Bullstall Lane | HR2 9LY |
| Canon Bridge | HR2 9JD HR2 9JF HR2 9JG HR2 9JE |
| Chilstone | HR2 9JR |
| Church Croft | HR2 9LT |
| Church Road | HR2 9SE |
| Credenhill | HR4 7EZ |
| Croft Road | HR2 9ST |
| Dene Industrial Estate | HR2 9NP |
| Elm Grove | HR2 9RB |
| Garnons | HR4 7JX |
| Glasnant Close | HR2 9FH |
| Gosmore Place | HR2 9RL |
| Gosmore Road | HR2 9SN |
| Great Brampton Park | HR2 9PG |
| Innisfield | HR2 9RJ |
| Lark Gardens | HR2 9FF |
| Lion Close | HR2 9QB |
| Lower House Drive | HR2 9FD |
| Lulham | HR2 9JJ HR2 9JP HR2 9JL HR2 9JQ HR2 9JW |
| Madley Airfield Industrial Estate | HR2 9NQ |
| Meadow View | HR2 9EL |
| Northamfield | HR2 9SR |
| Oak Close | HR2 9QZ |
| Oak Crescent | HR2 9RG |
| Paterson Close | HR2 9PQ |
| Pennyplock | HR2 9LW |
| Pickhatch Lane | HR2 9NB HR2 9ND |
| Pleasant Row | HR2 9RE |
| Primrose Avenue | HR2 9FE |
| Pulley Avenue | HR2 9QN |
| Rectory Meadow | HR2 9QJ |
| Rosemary Lane | HR2 9LS |
| Ruckhall Lane | HR2 9SB HR2 9QH HR2 9QL HR2 9RP HR2 9RZ |
| School Lane | HR2 9RQ |
| Seabourne Gardens | HR2 9SQ |
| Shepherds Meadow | HR2 9UA |
| St Marys Close | HR2 9DP |
| St Michaels Court | HR2 9RW |
| Swainshill | HR4 7QF |
| Sycamore Croft | HR2 9LR |
| Syers Croft | HR2 9SU |
| The Bines | HR2 9RA |
| The Hollies | HR2 9SP |
| The Pippins | HR2 9SG |
| Tinglebrook Close | HR2 9BZ |
| Town House Court | HR2 9GZ |
| Woodfield Gardens | HR2 9RN |
| Woodpecker Drive | HR2 9FG |
| Wye Gnat Cottages | HR2 9QE |
| HR2 9AA HR2 9LP HR2 9LU HR2 9NA HR2 9NE HR2 9NN HR2 9NU HR2 9NX HR2 9NY HR2 9NZ HR2 9PA HR2 9PB HR2 9PE HR2 9PF HR2 9PH HR2 9PJ HR2 9PL HR2 9PN HR2 9PW HR2 9QA HR2 9QD HR2 9QF HR2 9QG HR2 9QP HR2 9QQ HR2 9QR HR2 9QT HR2 9QU HR2 9QW HR2 9QX HR2 9SD HR2 9SF HR2 9SH HR2 9SJ HR2 9SL HR2 9TE HR2 9TF HR2 9TL HR2 9TQ HR4 7JJ HR2 9LZ HR2 9NF HR2 9NH HR2 9NL HR2 9NR HR2 9NT HR2 9PD HR2 9QS HR2 9RY HR2 9TG HR4 7JL HR4 7JU HR4 7JY HR4 7LA HR4 7LF HR4 7NJ HR4 7QH |
Transport near Stoney Street
- FAQ
- Price Paid By Year
- Property Type Price
Frequently asked questions about Stoney Street
What is the average price for a property for sale in Stoney Street?
The average price for a property for sale in Stoney Street is £367,332. This amount is 18% higher than the average price in Hereford. There are 1,649 property listings for sale in Stoney Street.
What streets have the most expensive properties for sale in Stoney Street?
The streets with the most expensive properties for sale in Stoney Street are Canon Bridge at an average of £616,875, Wye Gnat Cottages at an average of £612,666 and Bentley Drive at an average of £597,500.
What streets have the most affordable properties for sale in Stoney Street?
The streets with the most affordable properties for sale in Stoney Street are Elm Grove at an average of £130,000, St Michaels Court at an average of £166,750 and Primrose Avenue at an average of £190,700.
Which train stations are available in or near Stoney Street?
Some of the train stations available in or near Stoney Street are Hereford, Leominster and Ledbury.
Property Price Paid in Stoney Street by Year
The average sold property price by year was:
| Year | Average Sold Price | Price Change |
Sold Properties
|
|---|---|---|---|
| 2025 | £307,419 | -47% |
31 Properties |
| 2024 | £452,385 | 25% |
35 Properties |
| 2023 | £339,064 | -7% |
32 Properties |
| 2022 | £361,676 | -0,1% |
38 Properties |
| 2021 | £362,184 | 23% |
55 Properties |
| 2020 | £279,395 | 4% |
68 Properties |
| 2019 | £269,478 | -4% |
77 Properties |
| 2018 | £279,830 | -9% |
36 Properties |
| 2017 | £303,816 | 17% |
44 Properties |
| 2016 | £252,590 | -7% |
62 Properties |
| 2015 | £270,122 | -0,3% |
53 Properties |
| 2014 | £270,898 | 5% |
30 Properties |
| 2013 | £257,755 | 4% |
35 Properties |
| 2012 | £247,767 | 16% |
28 Properties |
| 2011 | £207,823 | -33% |
23 Properties |
| 2010 | £276,154 | 30% |
30 Properties |
| 2009 | £192,296 | -21% |
27 Properties |
| 2008 | £231,942 | -13% |
27 Properties |
| 2007 | £262,871 | 12% |
64 Properties |
| 2006 | £231,873 | -6% |
62 Properties |
| 2005 | £246,249 | 18% |
52 Properties |
| 2004 | £200,718 | 11% |
46 Properties |
| 2003 | £179,282 | 5% |
52 Properties |
| 2002 | £169,609 | 20% |
52 Properties |
| 2001 | £135,401 | 17% |
52 Properties |
| 2000 | £112,515 | 18% |
49 Properties |
| 1999 | £92,377 | 5% |
47 Properties |
| 1998 | £87,531 | 12% |
45 Properties |
| 1997 | £76,793 | -21% |
50 Properties |
| 1996 | £93,038 | 12% |
30 Properties |
| 1995 | £81,917 | - |
32 Properties |
Property Price per Property Type in Stoney Street
Here you can find historic sold price data in order to help with your property search.
The average Property Paid Price for specific property types in the last three years are:
| Property Type | Average Sold Price | Sold Properties |
|---|---|---|
| Semi Detached House | £263,892.00 | 33 Semi Detached Houses |
| Detached House | £445,416.00 | 77 Detached Houses |
| Terraced House | £280,914.00 | 21 Terraced Houses |
| Flat | £210,500.00 | 5 Flats |

