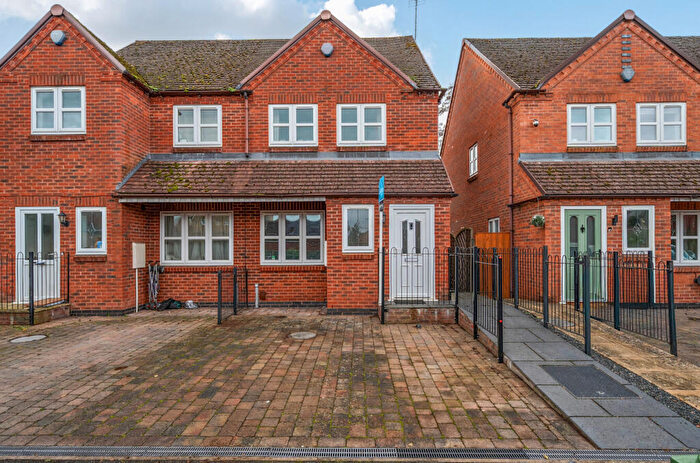
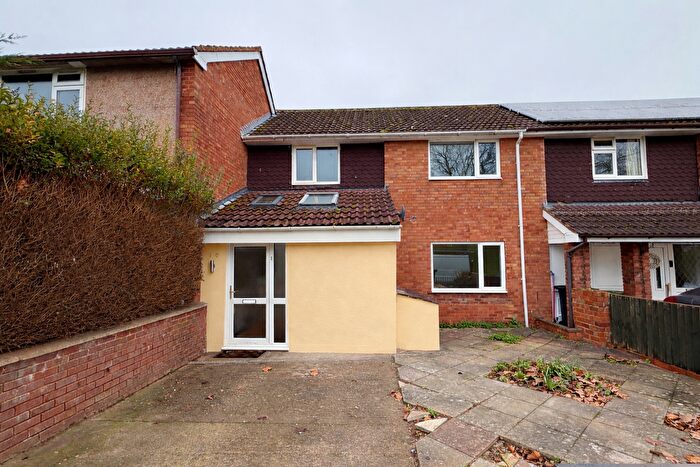
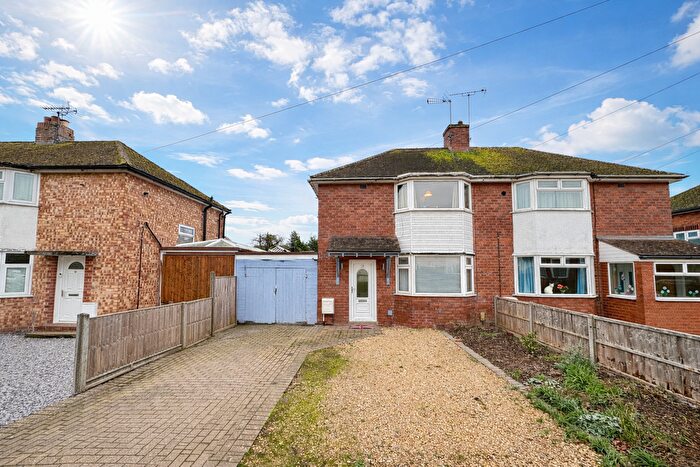
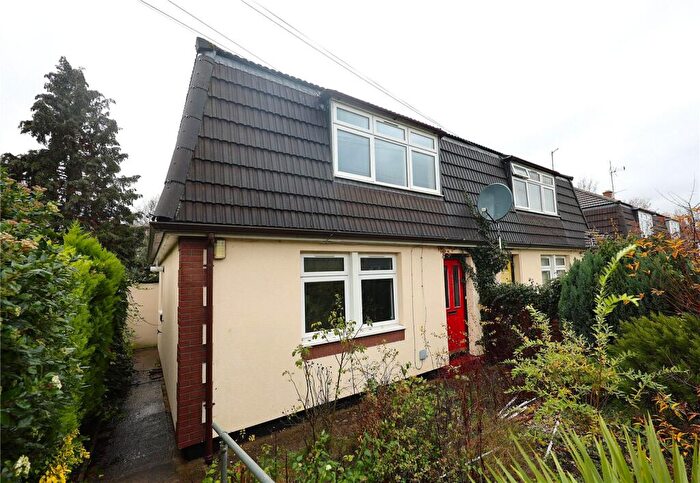
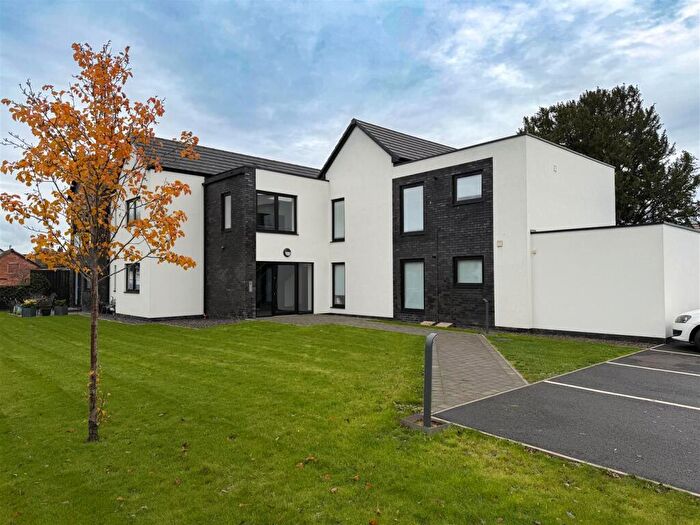
Houses for sale & to rent in Hollington, Hereford
House Prices in Hollington
Properties in Hollington have an average house price of £388,247.00 and had 65 Property Transactions within the last 3 years¹.
Hollington is an area in Hereford, County of Herefordshire with 809 households², where the most expensive property was sold for £865,000.00.
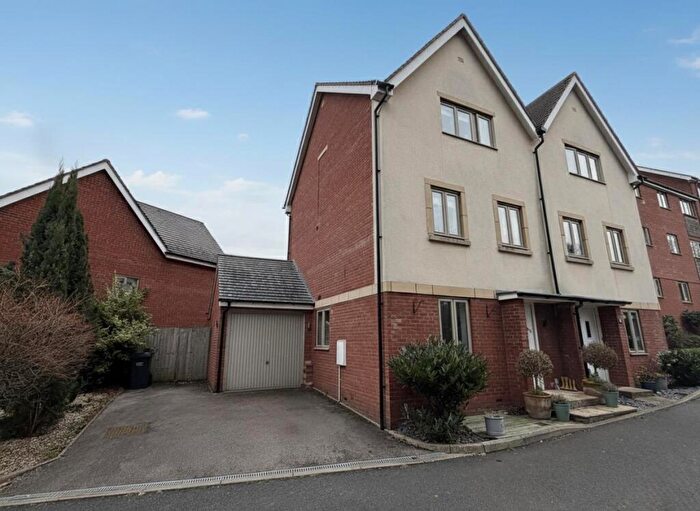
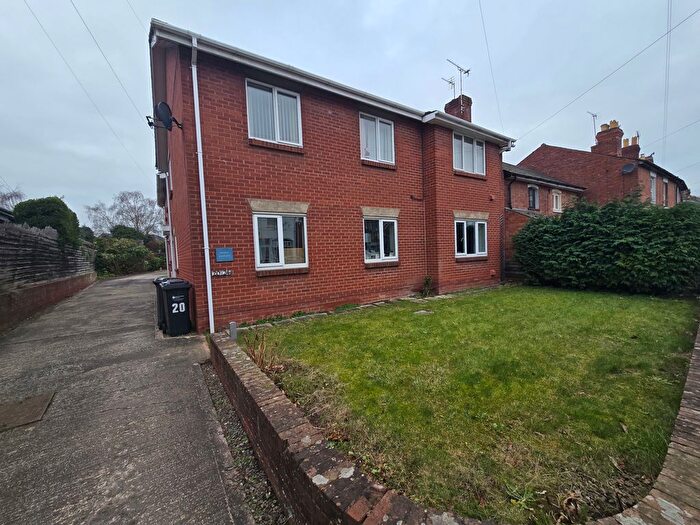
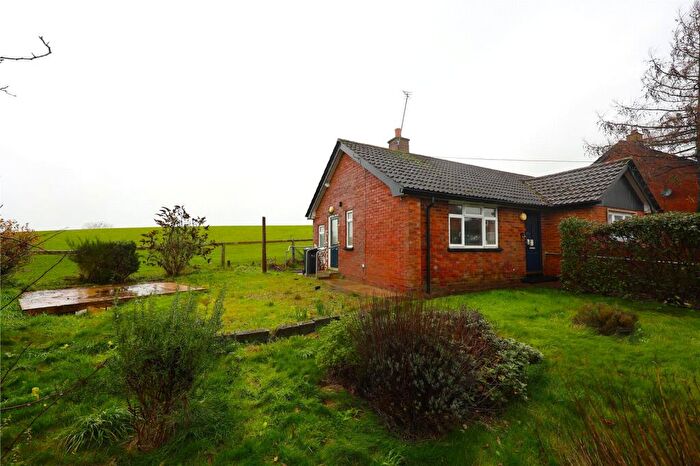
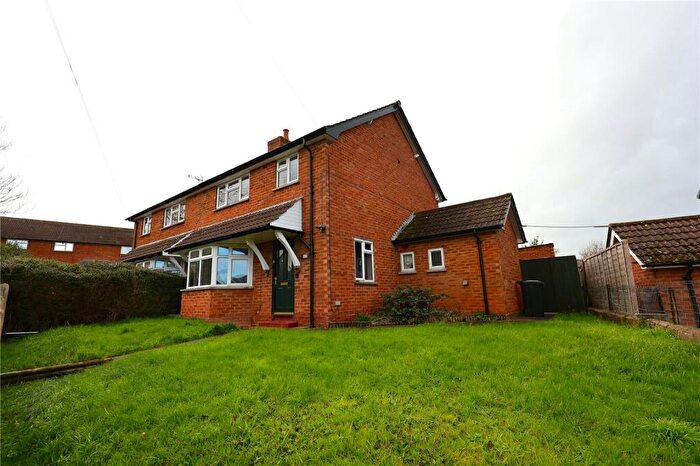
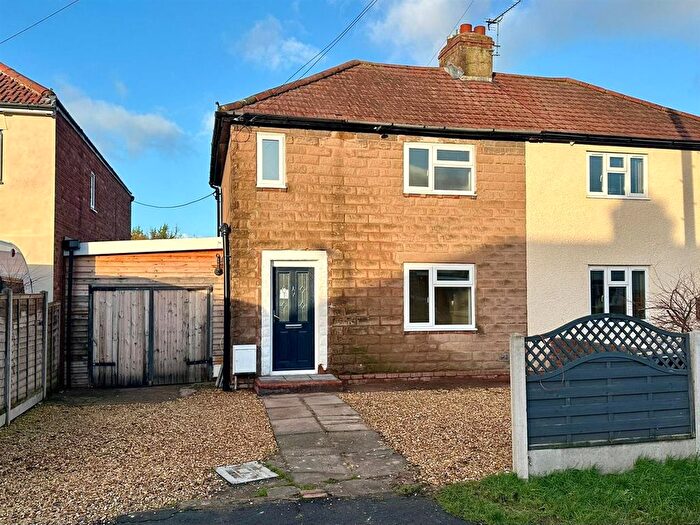
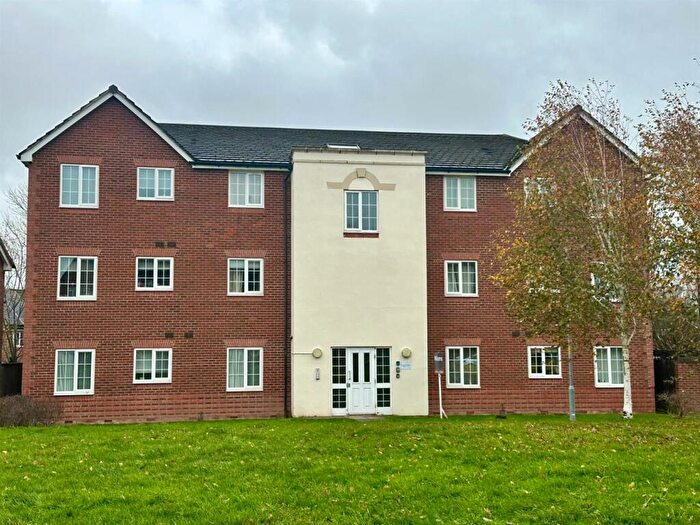
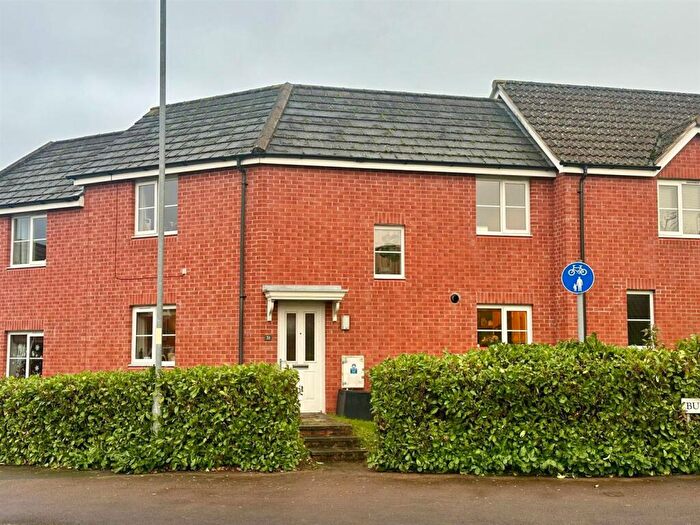
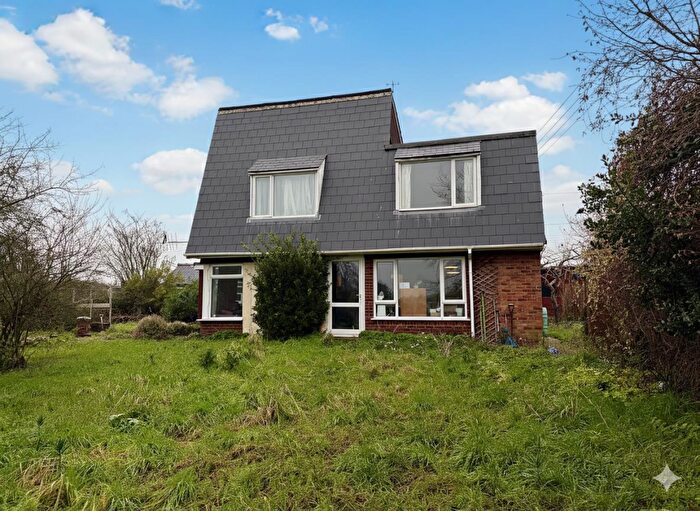
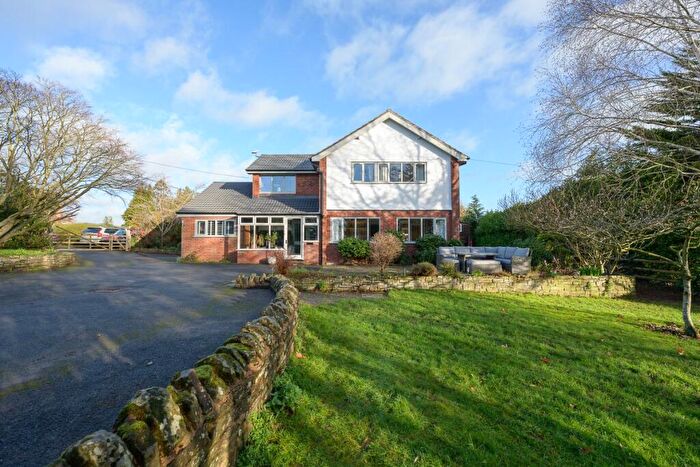
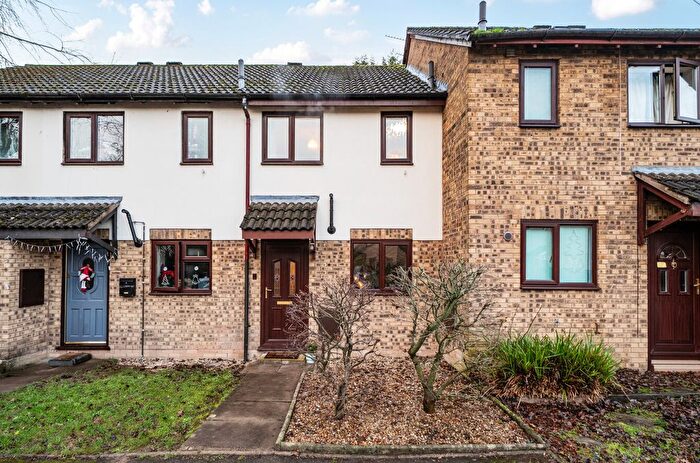
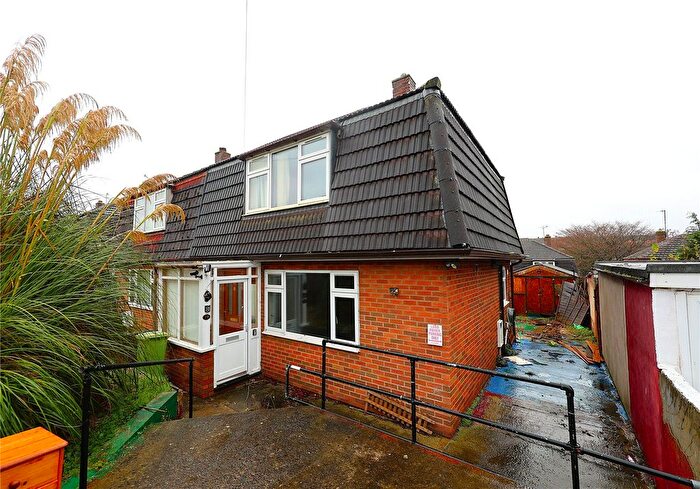
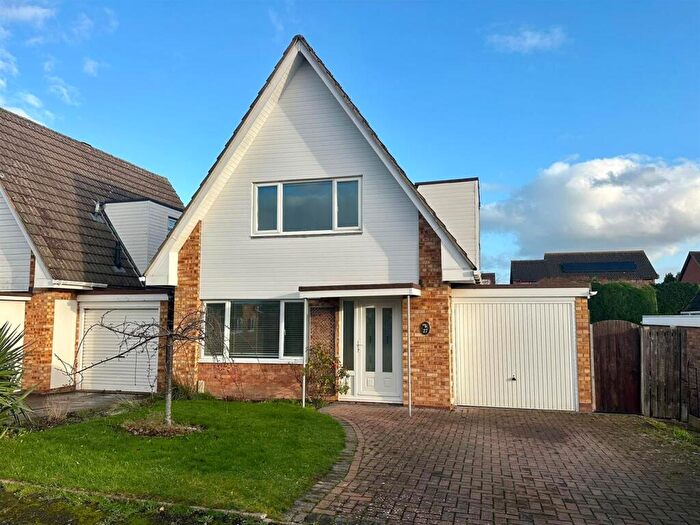
Properties for sale in Hollington
Roads and Postcodes in Hollington
Navigate through our locations to find the location of your next house in Hollington, Hereford for sale or to rent.
| Streets | Postcodes |
|---|---|
| Ballingham Hill | HR2 6NL |
| Blackberry Lane | HR2 6PZ |
| Bridge Road | HR2 6LP |
| Bromley Cottages | HR2 6QN |
| Court Close | HR2 6PT |
| Field Fare | HR2 6PU |
| Fir Tree Lane | HR2 6LA |
| Grafton Lane | HR2 8BL |
| Graftonbury Rise | HR2 8BE |
| Hardinge Close | HR2 6JY |
| Haywood | HR2 8BX |
| Hill View | HR2 6QA |
| Hillcrest | HR2 8BZ |
| Merryhill Park | HR2 9SS |
| Merryhill Terrace | HR2 9RT |
| Pump Cottages | HR2 6LW |
| Ridgehill | HR2 8AE HR2 8AF HR2 8AG |
| River View Close | HR2 6NZ |
| St Davids Rise | HR2 6PL |
| The Furrows | HR2 6QY |
| The Mews | HR2 8BN |
| The Straight Mile | HR2 6NR |
| Wyelands | HR2 6LT |
| HR2 6JP HR2 6LE HR2 6LF HR2 6LG HR2 6LH HR2 6LJ HR2 6LN HR2 6LQ HR2 6LS HR2 6LU HR2 6LY HR2 6ND HR2 6NE HR2 6NF HR2 6NG HR2 6NH HR2 6NN HR2 6NQ HR2 6PD HR2 6PF HR2 6PG HR2 6PH HR2 6PJ HR2 6PN HR2 6PP HR2 6PR HR2 6PS HR2 6PW HR2 6QB HR2 6QL HR2 8AA HR2 8AD HR2 8BP HR2 8BS HR2 8BU HR2 8BW HR2 8DA HR2 8DB HR2 8DD HR2 8DE HR2 8EB HR2 8ED HR2 8EE HR2 9RU |
Transport near Hollington
-
Hereford Station
-
Ledbury Station
-
Colwall Station
-
Leominster Station
-
Great Malvern Station
-
Malvern Link Station
-
Abergavenny Station
- FAQ
- Price Paid By Year
- Property Type Price
Frequently asked questions about Hollington
What is the average price for a property for sale in Hollington?
The average price for a property for sale in Hollington is £388,247. This amount is 25% higher than the average price in Hereford. There are 4,741 property listings for sale in Hollington.
What streets have the most expensive properties for sale in Hollington?
The streets with the most expensive properties for sale in Hollington are Ballingham Hill at an average of £577,500, River View Close at an average of £511,500 and Hardinge Close at an average of £355,625.
What streets have the most affordable properties for sale in Hollington?
The streets with the most affordable properties for sale in Hollington are St Davids Rise at an average of £188,000, Ridgehill at an average of £247,500 and Merryhill Terrace at an average of £260,833.
Which train stations are available in or near Hollington?
Some of the train stations available in or near Hollington are Hereford, Ledbury and Colwall.
Property Price Paid in Hollington by Year
The average sold property price by year was:
| Year | Average Sold Price | Price Change |
Sold Properties
|
|---|---|---|---|
| 2025 | £380,966 | -2% |
15 Properties |
| 2024 | £386,923 | -11% |
13 Properties |
| 2023 | £428,607 | 14% |
14 Properties |
| 2022 | £369,178 | -3% |
23 Properties |
| 2021 | £379,048 | 10% |
31 Properties |
| 2020 | £341,686 | -3% |
30 Properties |
| 2019 | £350,750 | 3% |
26 Properties |
| 2018 | £340,139 | 24% |
18 Properties |
| 2017 | £259,612 | -42% |
28 Properties |
| 2016 | £368,441 | 27% |
23 Properties |
| 2015 | £269,888 | 1% |
27 Properties |
| 2014 | £266,162 | -7% |
37 Properties |
| 2013 | £284,321 | -4% |
32 Properties |
| 2012 | £295,928 | 5% |
28 Properties |
| 2011 | £280,215 | -4% |
16 Properties |
| 2010 | £290,659 | 20% |
22 Properties |
| 2009 | £233,585 | -14% |
21 Properties |
| 2008 | £266,500 | 4% |
17 Properties |
| 2007 | £256,299 | -5% |
44 Properties |
| 2006 | £269,359 | -0,5% |
32 Properties |
| 2005 | £270,627 | -8% |
36 Properties |
| 2004 | £291,601 | 18% |
34 Properties |
| 2003 | £240,548 | 24% |
40 Properties |
| 2002 | £183,900 | -1% |
37 Properties |
| 2001 | £185,836 | 20% |
44 Properties |
| 2000 | £147,985 | 9% |
35 Properties |
| 1999 | £134,232 | 14% |
34 Properties |
| 1998 | £115,885 | 14% |
31 Properties |
| 1997 | £99,929 | -1% |
22 Properties |
| 1996 | £100,500 | 13% |
18 Properties |
| 1995 | £87,232 | - |
14 Properties |
Property Price per Property Type in Hollington
Here you can find historic sold price data in order to help with your property search.
The average Property Paid Price for specific property types in the last three years are:
| Property Type | Average Sold Price | Sold Properties |
|---|---|---|
| Semi Detached House | £360,368.00 | 8 Semi Detached Houses |
| Detached House | £459,933.00 | 42 Detached Houses |
| Terraced House | £194,555.00 | 9 Terraced Houses |
| Flat | £214,158.00 | 6 Flats |

